. 2020 Dec 3:11:572924.
doi: 10.3389/fimmu.2020.572924. eCollection 2020.

Differential Skewing of Circulating MR1-Restricted and γδ T Cells in Human Psoriasis Vulgaris

Affiliations

Differential Skewing of Circulating MR1-Restricted and γδ T Cells in Human Psoriasis Vulgaris

Vera Plužarić et al. Front Immunol. .

Abstract

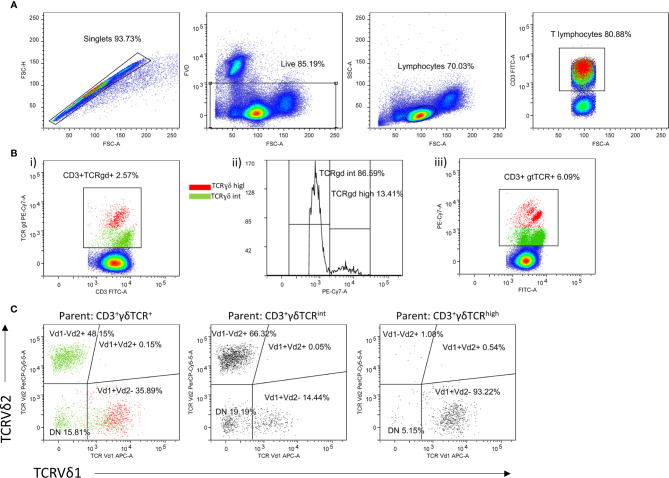
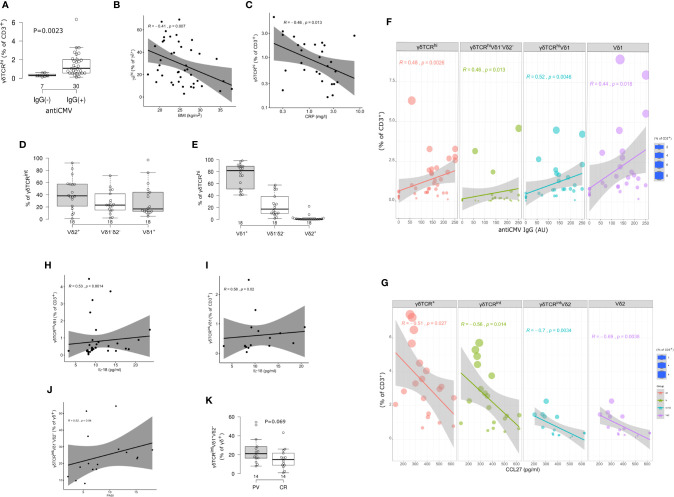
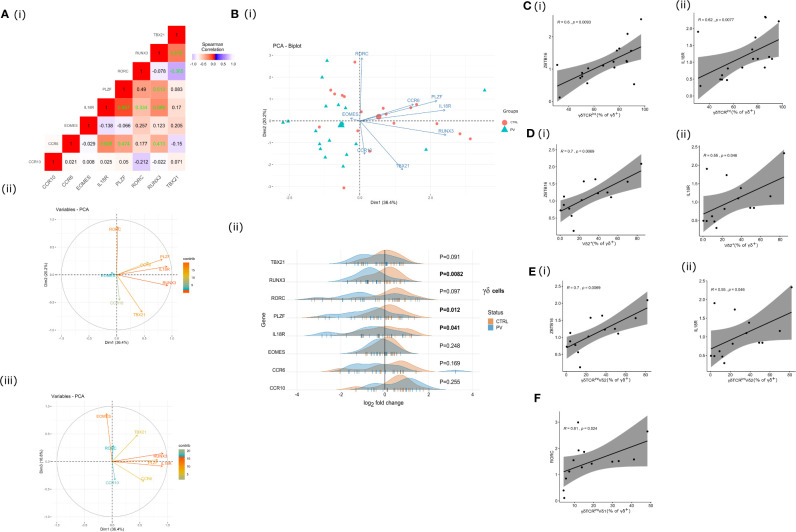
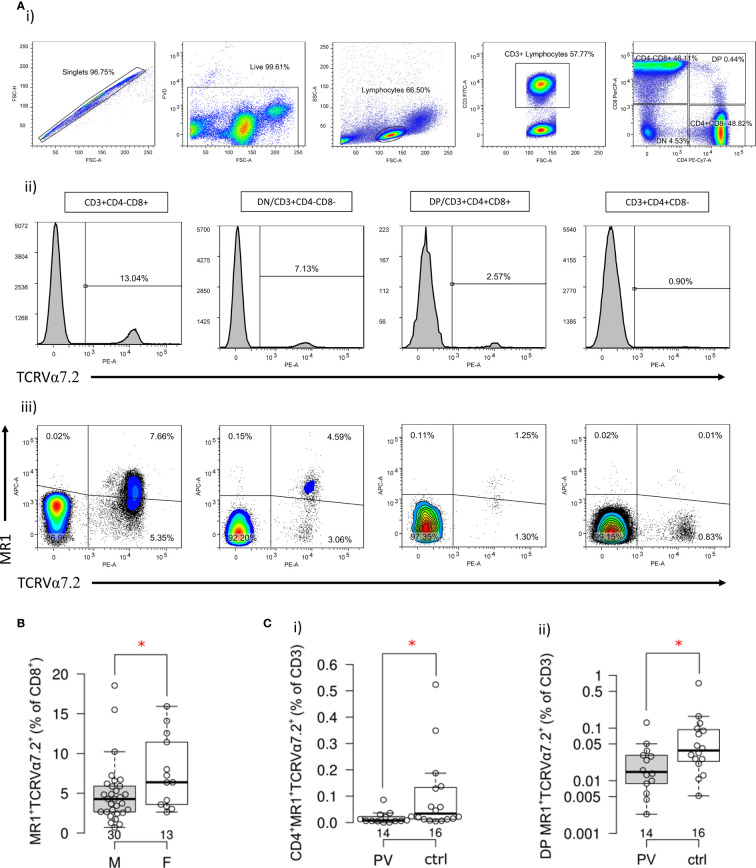
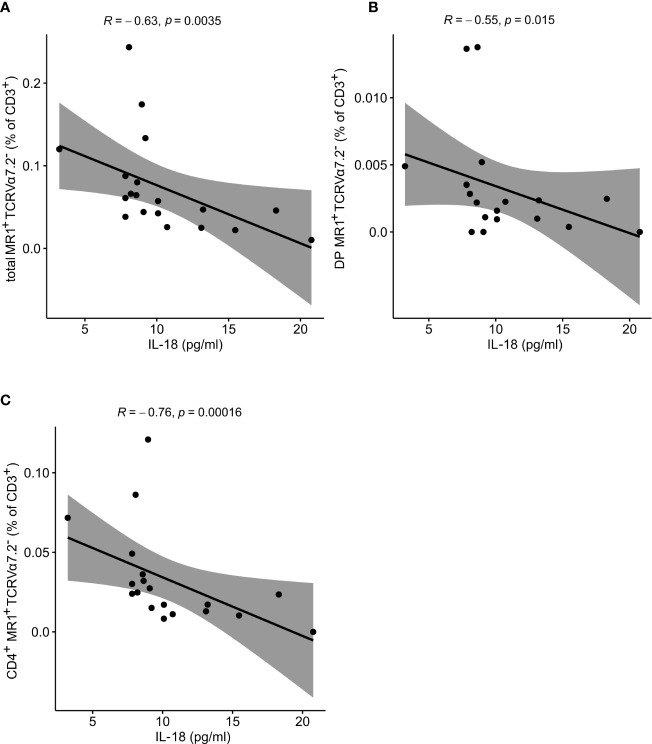
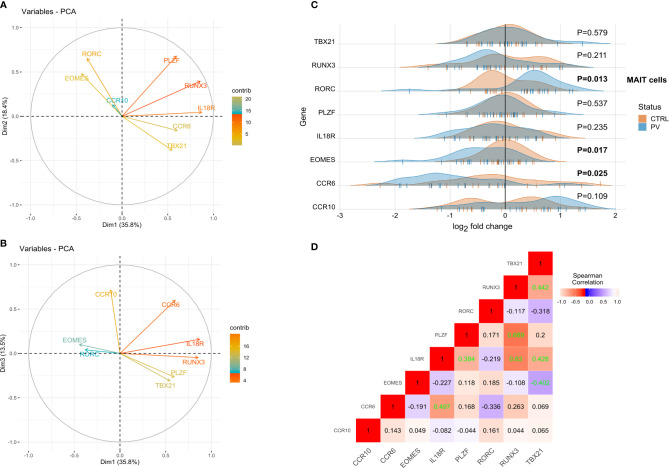
Psoriasis vulgaris (PV) is a chronic, recurrent inflammatory dermatosis mediated by aberrantly activated immune cells. The role of the innate-like T cells, particularly gammadelta T (γδT) cells and MR1-restricted T lymphocytes, is incompletely explored, mainly through animal models, or by use of surrogate lineage markers, respectively. Here, we used case-control settings, multiparameter flow cytometry, 5-OP-RU-loaded MR1-tetramers, Luminex technology and targeted qRT-PCR to dissect the cellular and transcriptional landscape of γδ and MR1-restricted blood T cells in untreated PV cases (n=21, 22 matched controls). High interpersonal differences in cell composition were observed, fueling transcriptional variability at healthy baseline. A minor subset of canonical CD4+CD8+MR1-tet+TCRVα7.2+ and CD4+CD8-MR1-tet+TCRVα7.2+ T cells was the most significantly underrepresented community in male PV individuals, whereas Vδ2+ γδ T cells expressing high levels of TCR and Vδ1-δ2- γδ T cells expressing intermediate levels of TCR were selectively enriched in affected males, partly reflecting disease severity. Our findings highlight a formerly unappreciated skewing of human circulating MAIT and γδ cytomes during PV, and reveal their compositional changes in relation to sex, CMV exposure, serum cytokine content, BMI, and inflammatory burden. Complementing numerical alterations, we finally show that flow-sorted, MAIT and γδ populations exhibit divergent transcriptional changes in mild type I psoriasis, consisting of differential bulk expression for signatures of cytotoxicity/type-1 immunity (EOMES, RUNX3, IL18R), type-3 immunity (RORC, CCR6), and T cell innateness (ZBTB16).

Keywords: MR1; cytokines; gammadelta T lymphocytes; mucosal associated invariant T cells; psoriasis.


Conflict of interest statement

The authors declare that the research was conducted in the absence of any commercial or financial relationships that could be construed as a potential conflict of interest.

Figures

Figure 1
Figure 1
Gating strategy of peripheral γδ T cells. (A) Representative dot plots illustrate gating strategy for identification of live, CD3+ T cells, (B) including gating of CD3+γδTCRint and CD3+γδTCRhigh and (C) Vδ1+, Vδ2+ and Vδ1-δ2- T cell subsets analyzed within each CD3+γδTCRint and CD3+γδTCRhigh T cell panel. The Vδ1+δ2+ T cell events were not further evaluated.
Figure 2
Figure 2
Circulating γδ T cell compartment of adults is skewed by CMV status, body mass index (BMI), inflammatory burden, and serum cytokine content. (A) Boxplot showing circulating γδTCRhigh T cells frequency in annotated groups, according to the CMV status (two-tailed Mann-Whitney test, pooled sample, PV cases + controls). Horizontal lines represent median with interquartile range. (B) γδTCRhigh blood T cells frequency is inversely related to body mass index (BMI, pooled sample). R denotes Spearman’s correlation coefficient. The black line represents a linear model fit where the shaded region indicates 95% confidence interval. (C) The relationship between circulating γδTCRhigh T cell frequency and C-reactive protein (CRP) at the time of blood sampling (log-log scale, pooled sample, cases+controls). (D, E) TCRδ chain usage in blood γδ T cells, healthy controls. Horizontal lines represent median with interquartile range. (F, G) Frequency and phenotype of circulating γδ T cells co-vary with anti-CMV IgG levels (pooled sample, PV+controls) and serum CCL27 levels (PV cases). The size of the dot reflects the percentage of cells expressing the markers, while the color encodes cell type identity within the group. Linear fit model, the shaded region indicates 95% confidence interval. (H, I) Correlation between Vδ1+ γδTCRint T cell frequency (peripheral blood) and serum IL-18 levels. h: pooled sample, i: PV cases. (J) Correlation between Vδ1-Vδ2- subset of γδTCRint cells and disease severity, measured by PASI score, at the time of blood sampling. (K) Boxplot showing circulating Vδ1-Vδ2- γδTCRint T cells frequency in annotated groups (*males* PV, CR=controls, two-tailed Mann-Whitney test). CMV status, BMI, and CRP were considered a shared covariate, common to each (case and control) study arm.
Figure 3
Figure 3
γδ T cell transcriptome is affected by changes in cell type composition and PV. A (I) Correlation heatmap depicting bulk expression of transcription factors/chemokine receptors in circulating γδ T cells (Spearman’s correlation coefficient, healthy controls). Statistically significant correlations (two-tailed P<0.05) are denoted in green. A (II), A (III), B (I) The PCA biplots A (II), A (II) and score plot B (I), transcriptomic data, γδ blood T cells (pooled sample). Positively correlated transcripts point to the same side of the plot. The score plot shows the degree of discrimination that was achievable across the groups. Each dot represents an individual: healthy controls (red) and PV cases (green). B (II) Ridgeline plots showing gene expression values of depicted genes in two clusters (healthy controls, PV cases). For differentially expressed transcripts (P<0.05, two-tailed Mann-Whitney test), P-values are depicted in bold. Each “|” point shape represents an individual. C (I), C (II), D (I), D (II), E (I), E (II), F Heterogeneous bulk mRNA expression in flow-sorted γδ T cells, healthy controls. Scatterplots showing co-variations between indicated gene expression (ZBTB16, IL18R, RORC; fold change) and γδ T cell composition. R denotes Spearman’s correlation coefficient. The black line represents a linear model fit where the shaded region indicates 95% confidence interval.
Figure 4
Figure 4
Frequency and phenotype of MR1-restricted MAIT cells in PV patients and healthy controls. (A) Representative dot plots illustrate gating strategy of MR1-5-OP-RU tetramer positive (MR1-tet+)TCRVα7.2+, MR1-tet+TCRVα7.2-, MR1-tet-TCRVα7.2+ and MR1-tet-TCRVα7.2- T cells within CD4+, CD8+, CD4-CD8- (DN) and CD4+CD8+ (DP) peripheral T cell compartment analyzed by multiparameter flow cytometry. (B) Male examinees have significantly lower frequency of circulating CD8+MR1-tet+TCRVα7.2+ cells then age-matched women, and c) compared to healthy male controls, a significantly smaller fraction of (I) CD4+ and (II) DP MR1-tet+TCRVα7.2+ MAIT cells within the circulating CD3+ T cell pool [Mann-Whitney test (B, C), P<0.05 is considered significant and illustrated by red asterisk; horizontal lines represent median with interquartile range (IQR), note that Y-axis (C II) is log scale].
Figure 5
Figure 5
Atypical MR1-restricted Vα7.2- T cells correlate with cytokine serum levels of PV patients. The peripheral frequency of atypical (A) CD3+, (B) DP and (C) CD4+TCRVα7.2- T cell compartments negatively correlate with IL-18 serum levels of PV patients, respectively (R denotes Spearman’s correlation coefficient. The black line represents a linear model fit where the shaded region indicates 95% confidence interval).
Figure 6
Figure 6
RORC, CCRC6 and EOMES transcripts are differentially expressed in circulating MR1-tet+ TCRVα7.2+T cells of PV patients. PCA biplots (A, B), transcriptomic data, MAIT blood cells (pooled sample). Positively correlated transcripts point to the same side of the plot. Negatively correlated variables point to opposite sides of the graph. (C) Ridgeline plots showing gene expression values of depicted genes in two clusters (healthy controls, PV cases). For differentially expressed transcripts (P<0.05, two-tailed Mann-Whitney test), P-values are depicted in bold. Each “|” point shape represents an individual. (D) Correlation heatmap depicting bulk expression of transcription factors/chemokine receptors in circulating MAIT cells (Spearman’s correlation coefficient, healthy controls). Statistically significant correlations (two-tailed P<0.05) are denoted in green.

Similar articles

Cited by

References

    1. Ayala-Fontánez N, Soler DC, McCormick TS. Current knowledge on psoriasis and autoimmune diseases. Psoriasis Auckl NZ (2016) 6:7–32. 10.2147/PTT.S64950 - DOI - PMC - PubMed
    1. Casciano F, Pigatto PD, Secchiero P, Gambari R. Reali E. T Cell Hierarchy in the Pathogenesis of Psoriasis and Associated Cardiovascular Comorbidities. Front Immunol (2018) 9:1390:1390. 10.3389/fimmu.2018.01390 - DOI - PMC - PubMed
    1. Cruz MS, Diamond A, Russell A, Jameson JM. Human αβ and γδ T Cells in Skin Immunity and Disease. Front Immunol (2018) 9:1304:1304. 10.3389/fimmu.2018.01304 - DOI - PMC - PubMed
    1. Kryczek I, Bruce AT, Gudjonsson JE, Johnston A, Aphale A, Vatan L, et al. Induction of IL-17+ T cell trafficking and development by IFN-γ: Mechanism and pathological relevance in psoriasis. J Immunol Baltim Md 1950 (2008) 181:4733–41. 10.4049/jimmunol.181.7.4733 - DOI - PMC - PubMed
    1. Ortega C, Fernández- AS, Carrillo JM, Romero P, Molina IJ, Moreno JC, et al. IL-17-producing CD8+ T lymphocytes from psoriasis skin plaques are cytotoxic effector cells that secrete Th17-related cytokines. J Leukoc Biol (2009) 86:435–43. 10.1189/JLB.0109046 - DOI - PubMed

Publication types

MeSH terms

Substances