Clinical Trial
. 2020 Dec 3:11:611004.
doi: 10.3389/fimmu.2020.611004. eCollection 2020.

B Cell Subsets as Severity-Associated Signatures in COVID-19 Patients

Affiliations
Clinical Trial

B Cell Subsets as Severity-Associated Signatures in COVID-19 Patients

Víctor A Sosa-Hernández et al. Front Immunol. .

Abstract

Background: SARS-CoV-2 infection represents a global health problem that has affected millions of people. The fine host immune response and its association with the disease course have not yet been fully elucidated. Consequently, we analyze circulating B cell subsets and their possible relationship with COVID-19 features and severity.

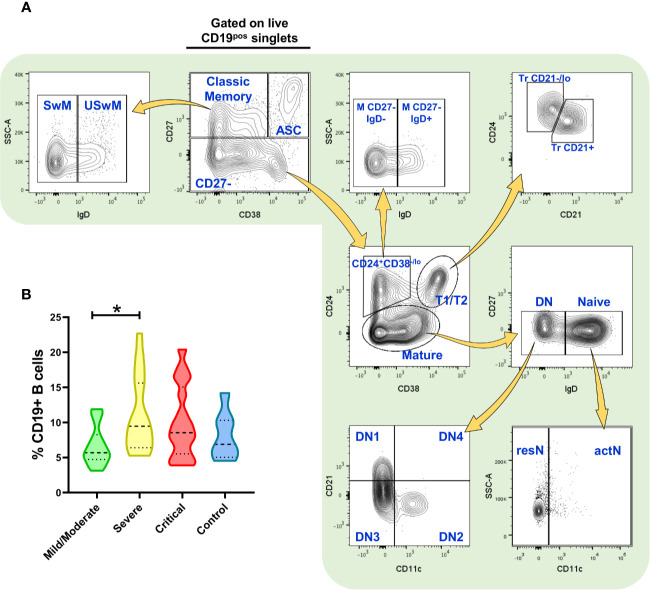
Methods: Using a multiparametric flow cytometric approach, we determined B cell subsets frequencies from 52 COVID-19 patients, grouped them by hierarchical cluster analysis, and correlated their values with clinical data.

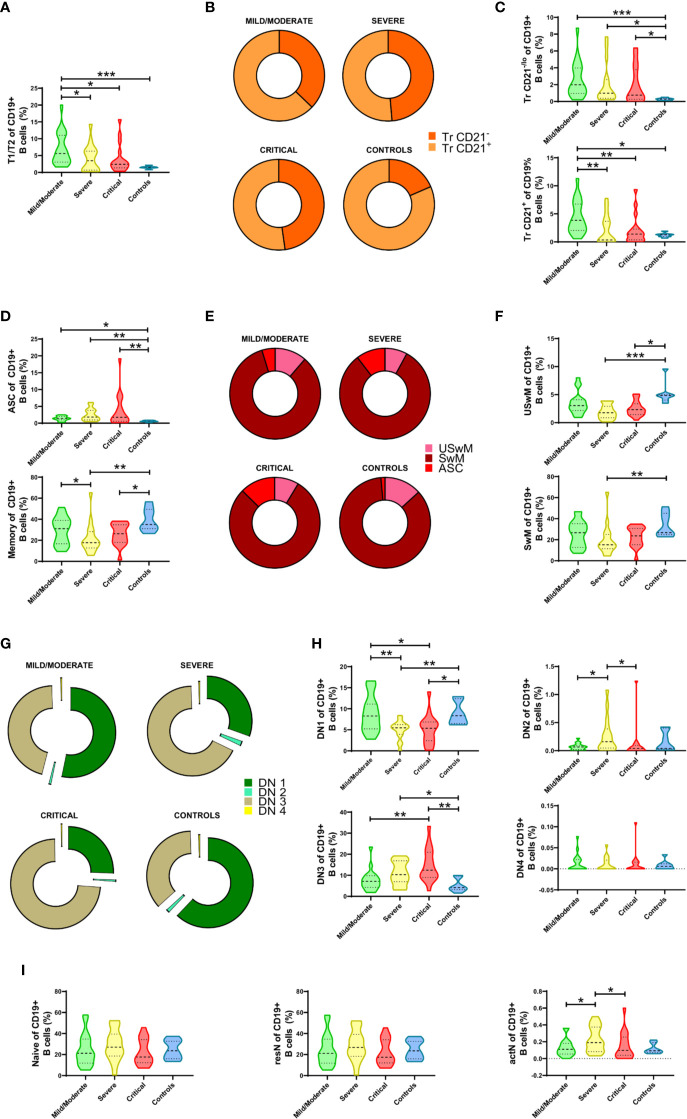
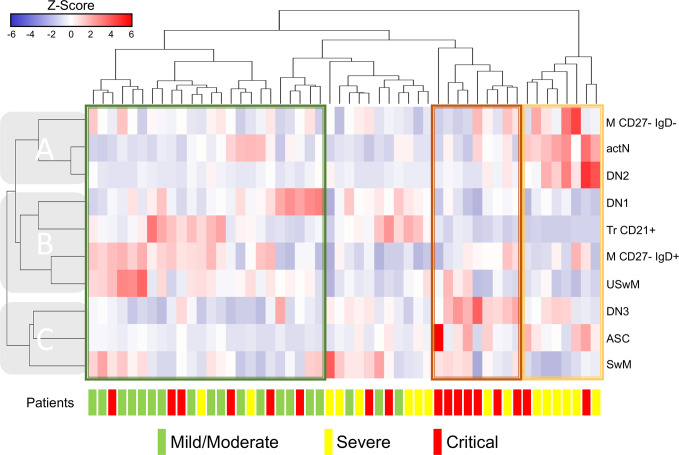
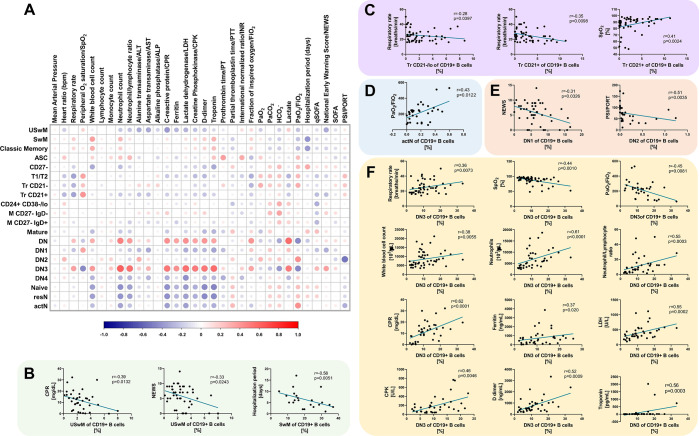
Results: The frequency of CD19+ B cells is increased in severe COVID-19 compared to mild cases. Specific subset frequencies such as transitional B cell subsets increase in mild/moderate cases but decrease with the severity of the disease. Memory B compartment decreased in severe and critical cases, and antibody-secreting cells are increased according to the severity of the disease. Other non-typical subsets such as double-negative B cells also showed significant changes according to disease severity. Globally, these differences allow us to identify severity-associated patient clusters with specific altered subsets. Finally, respiratory parameters, biomarkers of inflammation, and clinical scores exhibited correlations with some of these subpopulations.

Conclusions: The severity of COVID-19 is accompanied by changes in the B cell subpopulations, either immature or terminally differentiated. Furthermore, the existing relationship of B cell subset frequencies with clinical and laboratory parameters suggest that these lymphocytes could serve as potential biomarkers and even active participants in the adaptive antiviral response mounted against SARS-CoV-2.

Keywords: B cells; COVID-19; DN B cells; memory B cells; transitional B cells.


Conflict of interest statement

The authors declare that the research was conducted in the absence of any commercial or financial relationships that could be construed as a potential conflict of interest.

Figures

Figure 1
Figure 1
Flow cytometry analysis of B cell subsets and frequency of total (CD19+) B cells. (A) Gating strategy for the identification of the indicated B cell subsets in peripheral blood mononuclear cells (PBMCs) (depicting representative results from a healthy control) previously selected from singlets gate (SSC-A vs. SSC-H) and live Zombie Green- cells. (B) Frequency of total CD19+ B cells in PBMCs from patients infected with SARS-CoV-2 (n=52) and healthy controls (n=7, negative PCR for SARS-CoV-2). Frequency values are displayed as mean (dashed line) plus lower and upper quartiles (dotted lines). The data were analyzed by a Kruskal-Wallis test followed by a Dunn’s post-hoc test. *p < 0.01. This figure was made using arrows from Servier Medical Art (http://smart.servier.com/), licensed under a Creative Commons Attribution 3.0 Unported License (https://creativecommons.org/licenses/by/3.0/).
Figure 2
Figure 2
Alterations in the frequencies of peripheral B cell subsets from Coronavirus Disease 2019 (COVID-19) patients. (A) Comparative analysis of T1/T2 parental subset frequencies regarding CD19+ B cells. (B) Graphical representation of the Tr CD21-/lo and Tr CD21+ mean frequencies in COVID-19 patients and controls. (C) Comparative analysis of Tr CD21-/lo and Tr CD21+ frequencies relative to CD19+ B cells. (D) Comparative analysis of antibody-secreting cell (ASC) and Memory parental subsets relative to CD19+ B cells. (E) Graphical representation of the ASC, USwM, and SwM mean frequencies in COVID-19 patients and controls. (F) Comparative analysis of USwM and SwM subset frequencies relative to CD19+ B cells. (G) Representative composition of double negative (DN) fraction by graphing DN1, DN2, DN3, and DN4 subset mean frequencies. (H) Comparative analysis of DN1, DN2, DN3, and DN4 subset frequencies regarding CD19+ B cells. (I) Comparative analysis of parental naïve, resN, and actN subsets relative to CD19+ B cells. For all graphs, frequency values are displayed as mean (dashed line) plus lower and upper quartiles (dotted lines). The data were analyzed by a Kruskal-Wallis test followed by a Dunn’s post-hoc test. *p < 0.01, **p < 0.001. ***p < 0.0001.
Figure 3
Figure 3
Clustering analysis from Coronavirus Disease 2019 (COVID-19) patients vs. B cells subsets. Hierarchical clustering analysis generated by Ward’s method relating mild/moderate (green, n= 19), severe (yellow, n= 16) and critical (red, n= 17) patients with low-correlating B subset frequencies depicted according to the score denoted in the upper color-scale bar. Associated horizontal dendrograms denote the patients clustering, standing out clusters containing mainly mild/moderate patients (enclosed in green), severe (enclosed in yellow) or critical (enclosed in red). Vertical dendrograms show three main subpopulation clusters (A–C).
Figure 4
Figure 4
B cell subsets correlate with severity scores and different clinical parameters in Coronavirus Disease 2019 (COVID-19) patients. (A) Correlation matrix showing a graphical representation of calculated Spearman’s coefficient calculations between the B cell subset frequencies and indicated severity indexes/clinical and laboratory variables. The underlying color scale indicates Spearman’s coefficient values. The size of each dot also denotes the correlation strength. (B) Statistically significant correlations between memory B cell subsets and C-reactive protein (CRP), NEWS score and hospitalization length. (C) Statistically significant correlations between Tr B cell subsets and respiratory rate and SpO2. (D) The statistically significant correlation between actN subset and PaO2/FiO2. (E) Statistically significant correlations between DN1 B cell subset and NEWS score and DN2 subset with PSI/PORT score. (F) Statistically significant correlations between DN3 cell subset and respiratory rate, SpO2, PaO2/FiO2, white blood cell count, neutrophils, neutrophil/lymphocyte ratio, CPR, ferritin, lactate dehydrogenase (LDH), creatinine kinase (CPK), D-dimer, and troponin. In all graphs, calculated Spearman’s correlation (r) and significant p values (at least p < 0.01) are shown.

References

    1. Wang H, Li X, Li T, Zhang S, Wang L, Wu X, et al. The genetic sequence, origin, and diagnosis of SARS-CoV-2. Eur J Clin Microbiol Infect Dis (2020) 39(9):1629–35. 10.1007/s10096-020-03899-4 - DOI - PMC - PubMed
    1. Chan JF, Yuan S, Kok KH, To KK, Chu H, Yang J, et al. A familial cluster of pneumonia associated with the 2019 novel coronavirus indicating person-to-person transmission: a study of a family cluster. Lancet (2020) 395(10223):514–23. 10.1016/S0140-6736(20)30154-9 - DOI - PMC - PubMed
    1. Huang C, Wang Y, Li X, Ren L, Zhao J, Hu Y, et al. Clinical features of patients infected with 2019 novel coronavirus in Wuhan, China. Lancet (2020) 395(10223):497–506. 10.1016/S0140-6736(20)30183-5 - DOI - PMC - PubMed
    1. Docherty AB, Harrison EM, Green CA, Hardwick HE, Pius R, Norman L, et al. Features of 20 133 UK patients in hospital with covid-19 using the ISARIC WHO Clinical Characterisation Protocol: prospective observational cohort study. BMJ (2020) 369:m1985. 10.1136/bmj.m1985 - DOI - PMC - PubMed
    1. Lechien JR, Chiesa-Estomba CM, Place S, Van Laethem Y, Cabaraux P, Mat Q, et al. Clinical and epidemiological characteristics of 1420 European patients with mild-to-moderate coronavirus disease 2019. J Intern Med (2020) 288(3):335–44. 10.1111/joim.13089 - DOI - PMC - PubMed

Publication types