

Comprehensive MicroRNA Expression Profile of the Mammary Gland in Lactating Dairy Cows With Extremely Different Milk Protein and Fat Percentages
- PMID: 33343617
- PMCID: PMC7744623
- DOI: 10.3389/fgene.2020.548268
Comprehensive MicroRNA Expression Profile of the Mammary Gland in Lactating Dairy Cows With Extremely Different Milk Protein and Fat Percentages
Abstract
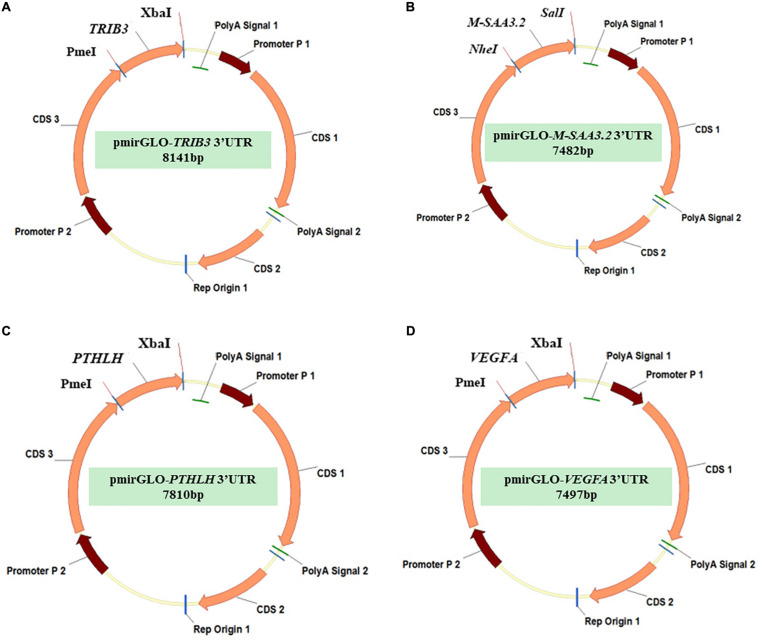
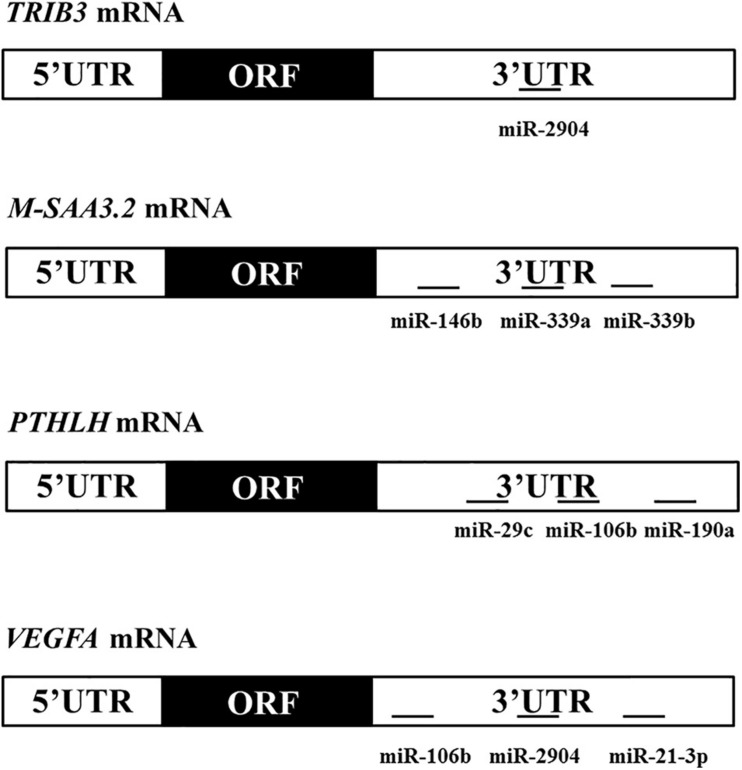
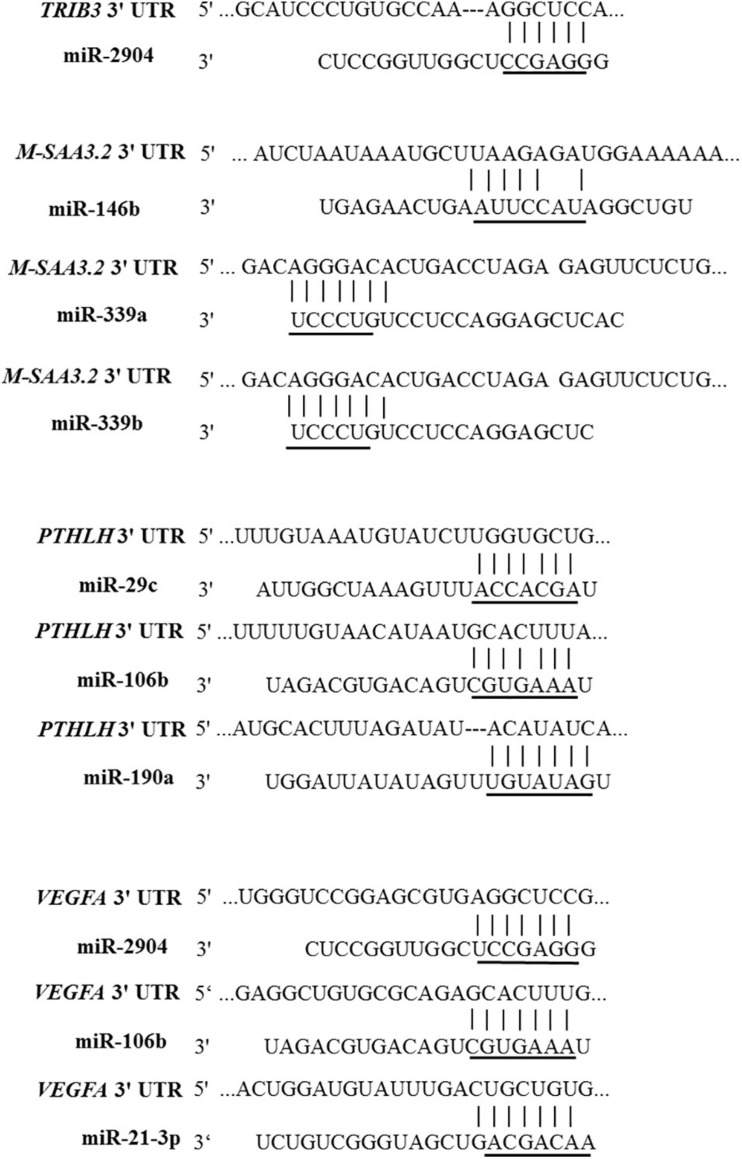
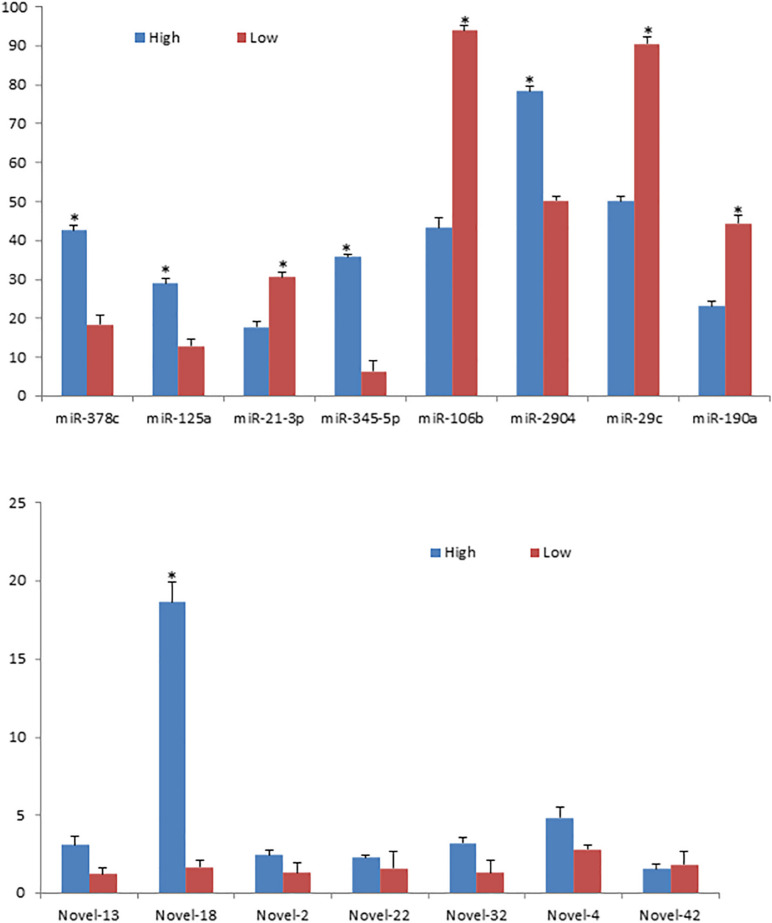
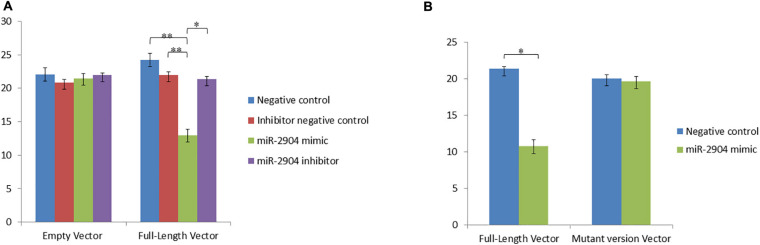
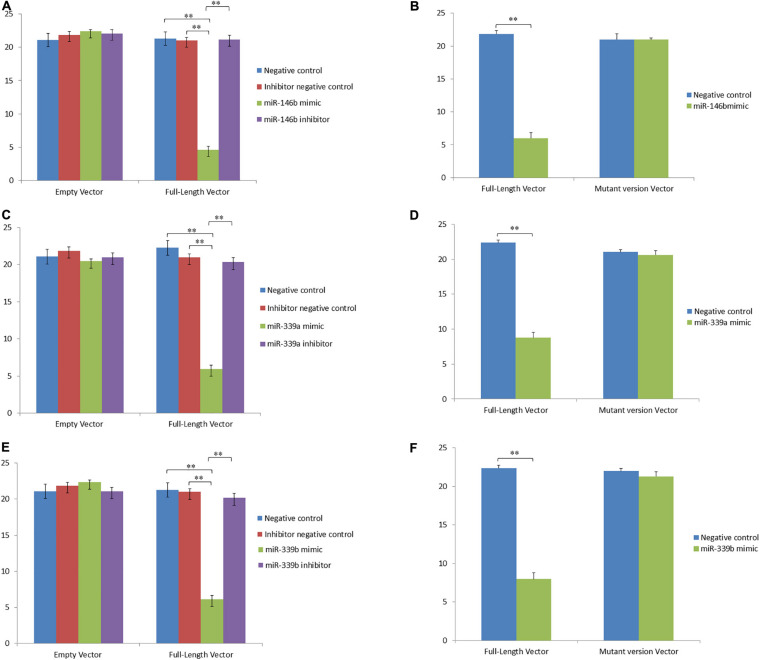
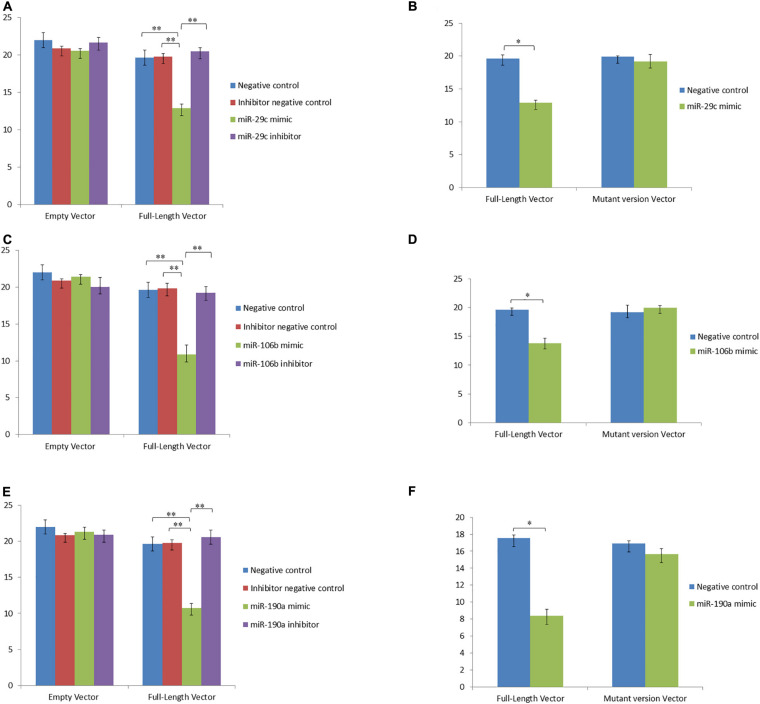
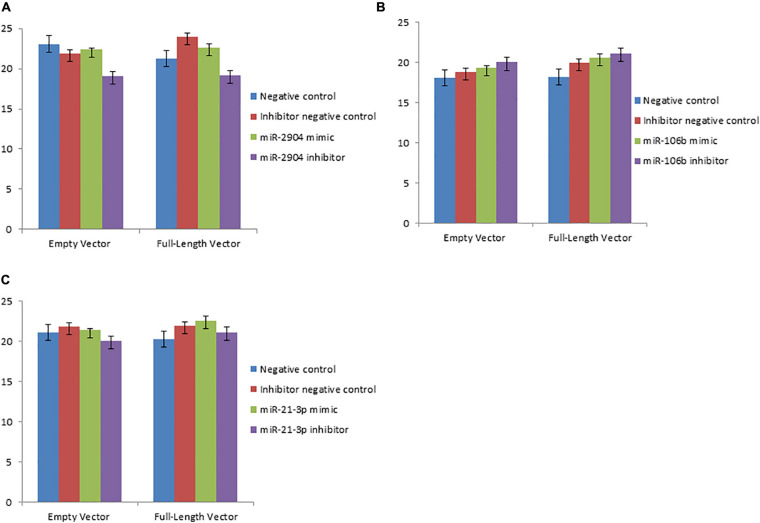
A total of 31 differentially expressed genes in the mammary glands were identified in our previous study using RNA sequencing (RNA-Seq), for lactating cows with extremely high and low milk protein and fat percentages. To determine the regulation of milk composition traits, we herein investigated the expression profiles of microRNA (miRNA) using small RNA sequencing based on the same samples as in the previous RNA-Seq experiment. A total of 497 known miRNAs (miRBase, release 22.1) and 49 novel miRNAs among the reads were identified. Among these miRNAs, 71 were found differentially expressed between the high and low groups (p < 0.05, q < 0.05). Furthermore, 21 of the differentially expressed genes reported in our previous RNA-Seq study were predicted as target genes for some of the 71 miRNAs. Gene ontology and KEGG pathway analyses showed that these targets were enriched for functions such as metabolism of protein and fat, and development of mammary gland, which indicating the critical role of these miRNAs in regulating the formation of milk protein and fat. With dual luciferase report assay, we further validated the regulatory role of 7 differentially expressed miRNAs through interaction with the specific sequences in 3'UTR of the targets. In conclusion, the current study investigated the complexity of the mammary gland transcriptome in dairy cattle using small RNA-seq. Comprehensive analysis of differential miRNAs expression and the data from previous study RNA-seq provided the opportunity to identify the key candidate genes for milk composition traits.
Keywords: RNA-seq; dairy cattle; mRNA; mammary gland; miRNA.
Copyright © 2020 Cui, Zhang, Zhang, Guo, Wu, Yao and Sun.
Conflict of interest statement
The authors declare that the research was conducted in the absence of any commercial or financial relationships that could be construed as a potential conflict of interest.
Figures
Similar articles
-
Deep RNA-Seq reveals miRNome differences in mammary tissue of lactating Holstein and Montbéliarde cows.BMC Genomics. 2019 Jul 30;20(1):621. doi: 10.1186/s12864-019-5987-4. BMC Genomics. 2019. PMID: 31362707 Free PMC article.
-
Transcriptional profiling of mammary gland in Holstein cows with extremely different milk protein and fat percentage using RNA sequencing.BMC Genomics. 2014 Mar 24;15:226. doi: 10.1186/1471-2164-15-226. BMC Genomics. 2014. PMID: 24655368 Free PMC article.
-
Comparative Analysis of the miRNome of Bovine Milk Fat, Whey and Cells.PLoS One. 2016 Apr 21;11(4):e0154129. doi: 10.1371/journal.pone.0154129. eCollection 2016. PLoS One. 2016. PMID: 27100870 Free PMC article.
-
Deep Sequencing and Screening of Differentially Expressed MicroRNAs Related to Milk Fat Metabolism in Bovine Primary Mammary Epithelial Cells.Int J Mol Sci. 2016 Feb 17;17(2):200. doi: 10.3390/ijms17020200. Int J Mol Sci. 2016. PMID: 26901190 Free PMC article.
-
Identification and bioinformatics analysis of differentially expressed milk exosomal microRNAs in milk exosomes of heat-stressed Holstein cows.Funct Integr Genomics. 2022 Feb;22(1):77-87. doi: 10.1007/s10142-021-00814-8. Epub 2021 Nov 27. Funct Integr Genomics. 2022. PMID: 34839400
Cited by
-
Milk exosomal microRNA profiling identified miR-375 and miR-199-5p for regulation of immune response during subclinical mastitis of crossbred cattle.Mol Biol Rep. 2024 Jan 2;51(1):59. doi: 10.1007/s11033-023-09070-4. Mol Biol Rep. 2024. PMID: 38165514
-
MicroRNAs in Ruminants and Their Potential Role in Nutrition and Physiology.Vet Sci. 2023 Jan 14;10(1):57. doi: 10.3390/vetsci10010057. Vet Sci. 2023. PMID: 36669058 Free PMC article. Review.
-
The Role of microRNAs in the Mammary Gland Development, Health, and Function of Cattle, Goats, and Sheep.Noncoding RNA. 2021 Dec 13;7(4):78. doi: 10.3390/ncrna7040078. Noncoding RNA. 2021. PMID: 34940759 Free PMC article. Review.
-
How Does Nutrition Affect the Epigenetic Changes in Dairy Cows?Animals (Basel). 2023 Jun 5;13(11):1883. doi: 10.3390/ani13111883. Animals (Basel). 2023. PMID: 37889793 Free PMC article. Review.
-
Comparative miRNome analysis of colostrum- and mature milk-derived extracellular vesicles from Holstein and Jersey cows.J Anim Sci Technol. 2025 Jan;67(1):193-207. doi: 10.5187/jast.2024.e84. Epub 2025 Jan 31. J Anim Sci Technol. 2025. PMID: 39974776 Free PMC article.
References
LinkOut - more resources
Full Text Sources