

Induction of HO-1 by 5, 8-Dihydroxy-4',7-Dimethoxyflavone via Activation of ROS/p38 MAPK/Nrf2 Attenuates Thrombin-Induced Connective Tissue Growth Factor Expression in Human Cardiac Fibroblasts
- PMID: 33343802
- PMCID: PMC7732388
- DOI: 10.1155/2020/1080168
Induction of HO-1 by 5, 8-Dihydroxy-4',7-Dimethoxyflavone via Activation of ROS/p38 MAPK/Nrf2 Attenuates Thrombin-Induced Connective Tissue Growth Factor Expression in Human Cardiac Fibroblasts
Abstract
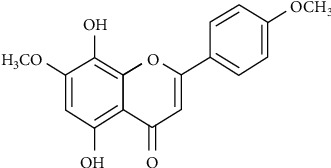
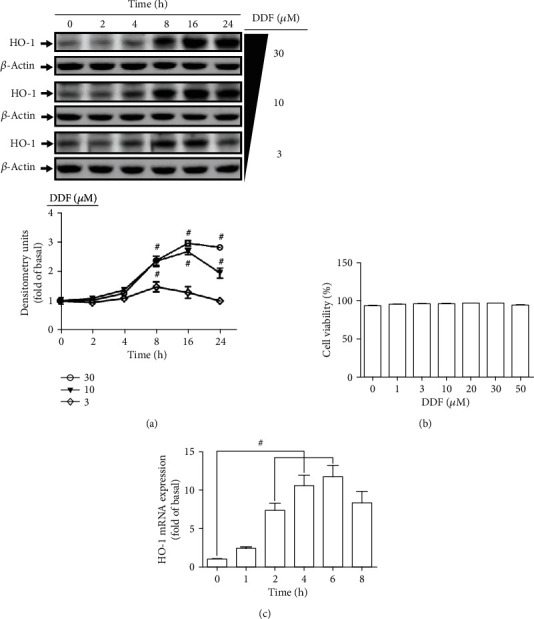
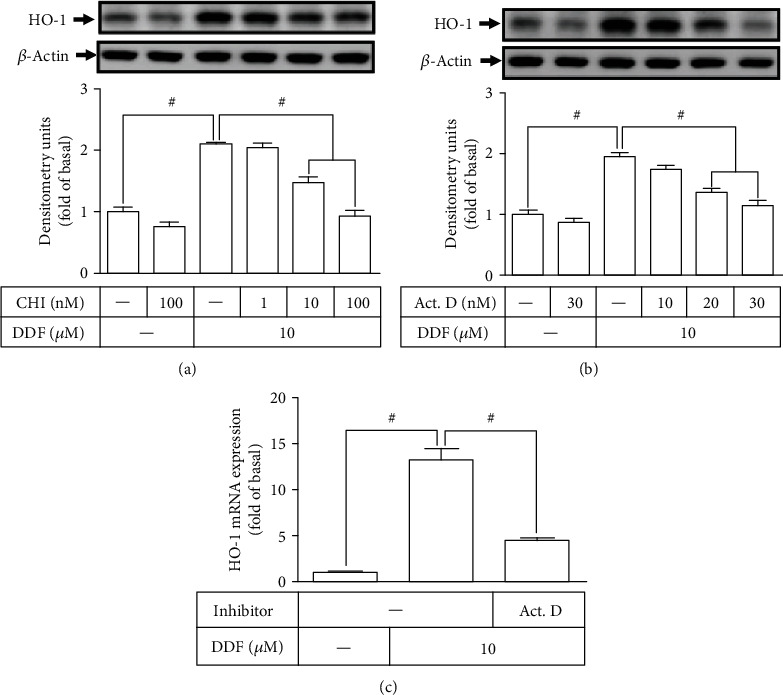
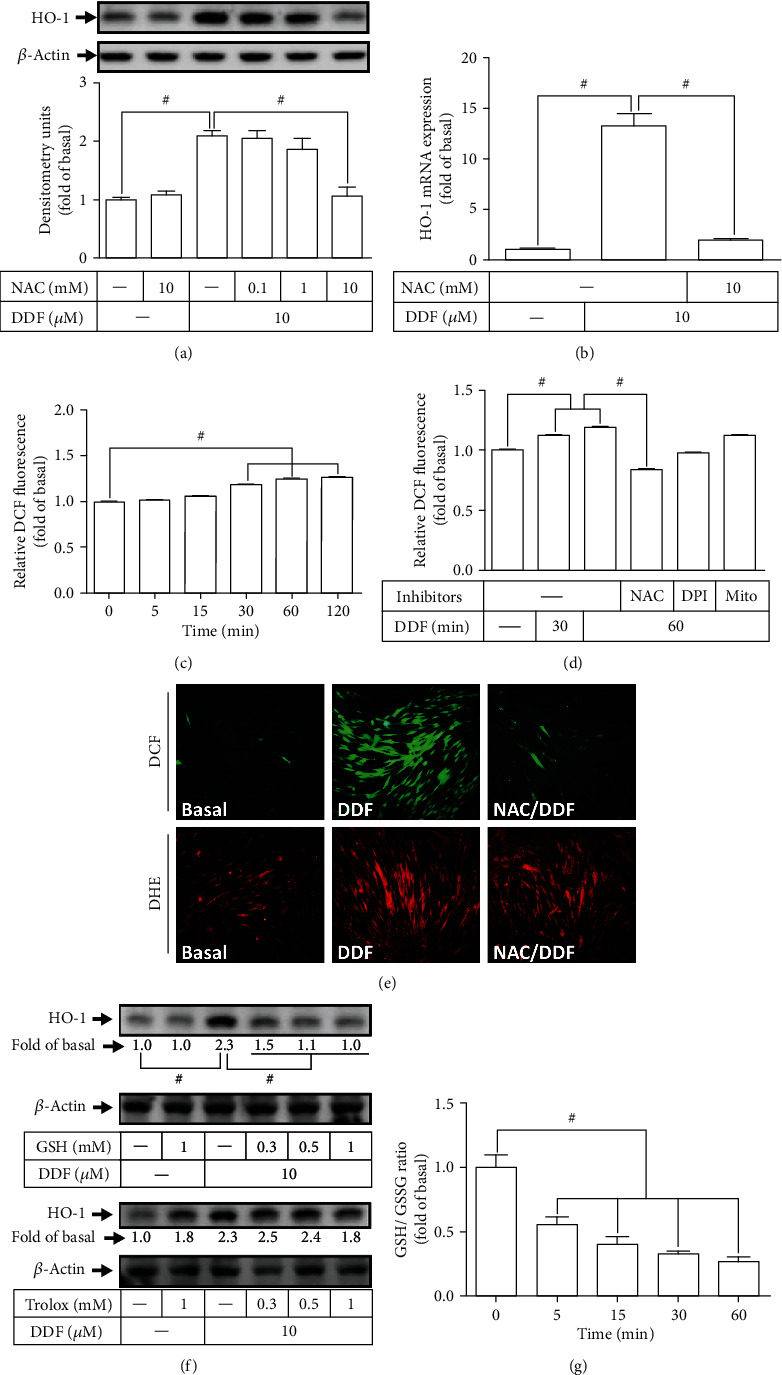
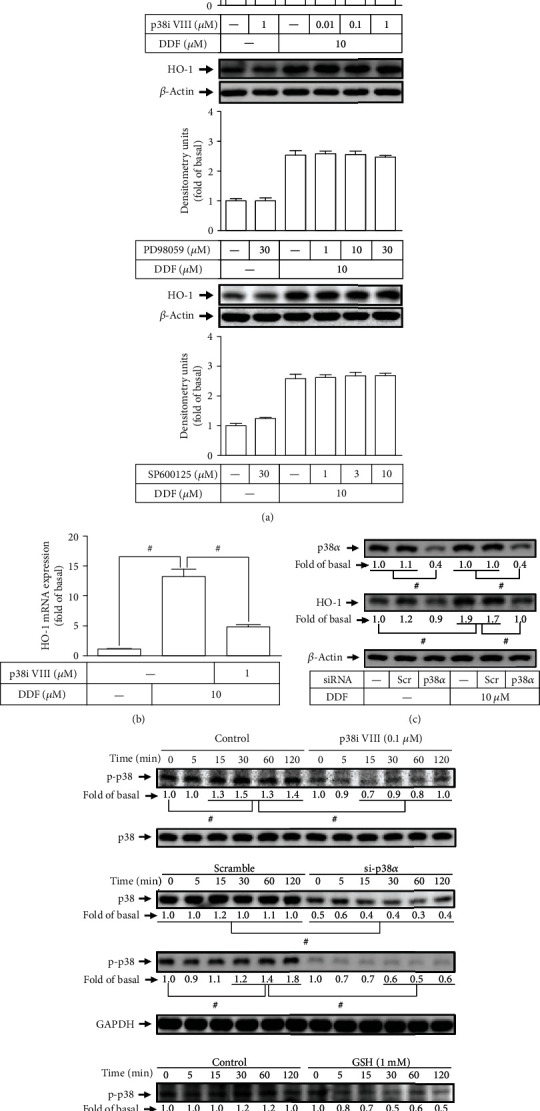
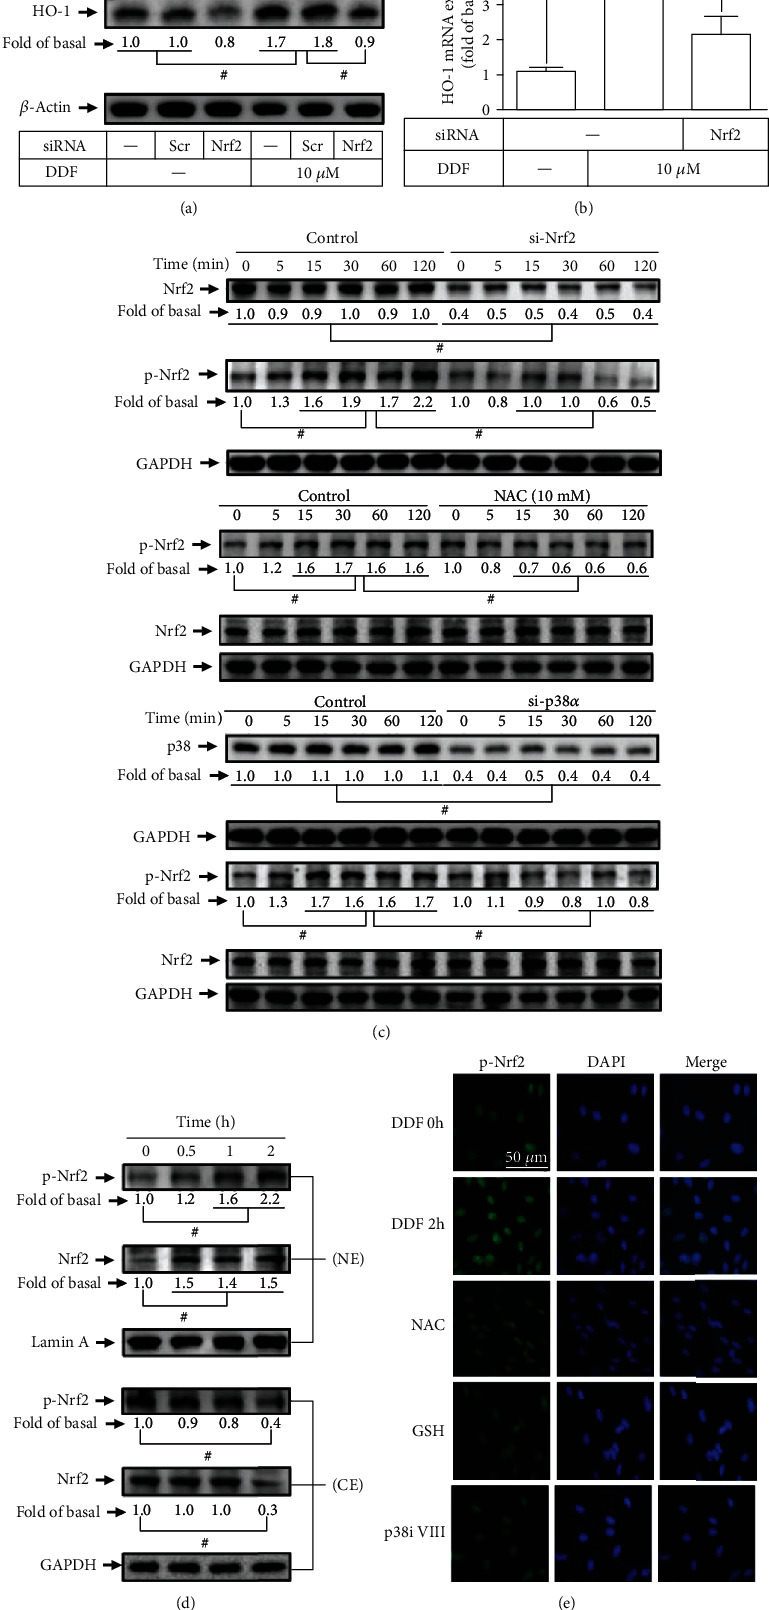
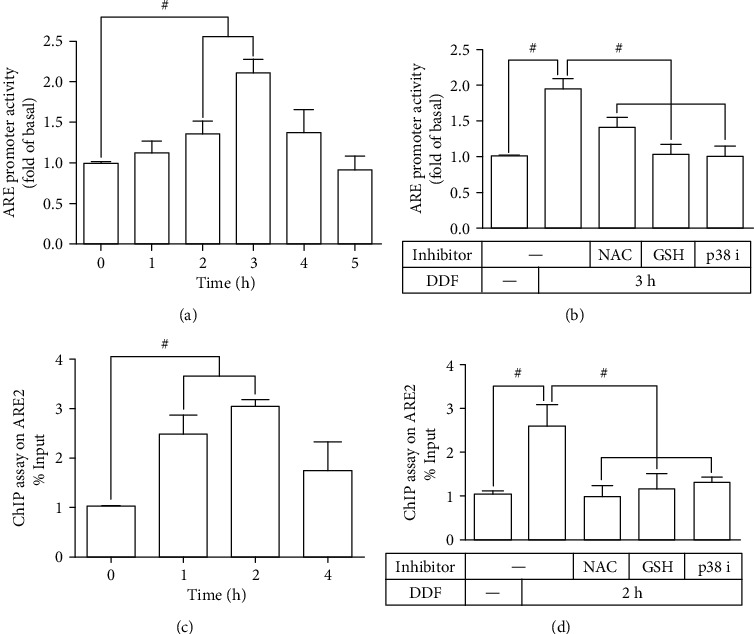
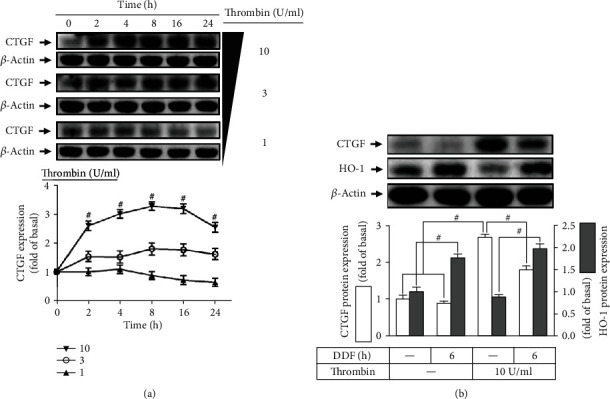
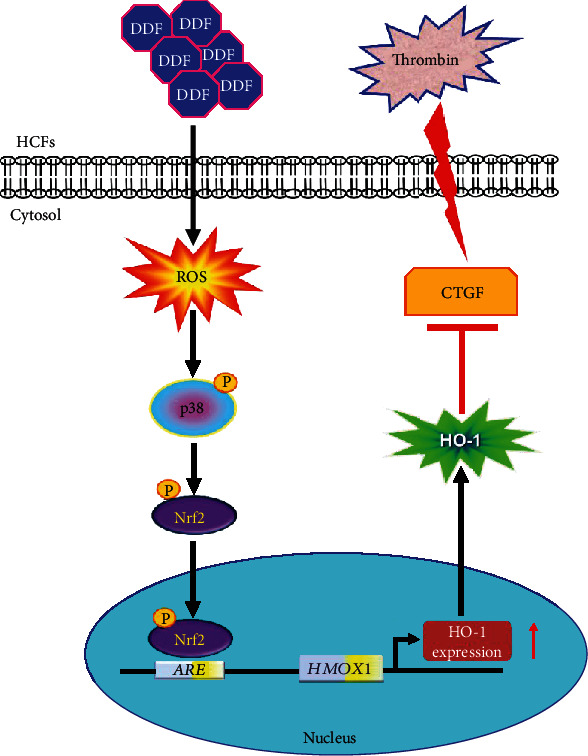
Heme oxygenase-1 (HO-1) has been shown to exert as an antioxidant and anti-inflammatory enzyme in cardiovascular inflammatory diseases. Flavonoids have been demonstrated to display anti-inflammatory and antioxidant effects through the induction of HO-1. 5,8-Dihydroxy-4',7-dimethoxyflavone (DDF), one of the flavonoid compounds, is isolated from Reevesia formosana. Whether DDF induced HO-1 expression on human cardiac fibroblasts (HCFs) remained unknown. Here, we found that DDF time- and concentration-dependently induced HO-1 protein and mRNA expression, which was attenuated by pretreatment with reactive oxygen species (ROS) scavenger N-acetyl cysteine (NAC) in HCFs. DDF-enhanced ROS generation was attenuated by NAC, but not by either diphenyleneiodonium chloride (DPI, Nox inhibitor) or MitoTempol (mitochondrial ROS scavenger). Interestingly, pretreatment with glutathione (GSH) inhibited DDF-induced HO-1 expression. The ratio of GSH/GSSG was time-dependently decreased in DDF-treated HCFs. DDF-induced HO-1 expression was attenuated by an inhibitor of p38 MAPK (p38i VIII) or siRNA, but not by MEK1/2 (PD98059) or JNK1/2 (SP600125). DDF-stimulated p38 MAPK phosphorylation was inhibited by GSH or p38i VIII. Moreover, DDF-induced HO-1 expression was mediated through Nrf2 phosphorylation and translocation into the nucleus which was attenuated by NAC or p38 siRNA. DDF also stimulated antioxidant response element (ARE) promoter activity which was inhibited by NAC, GSH, or p38i VIII. Interaction between Nrf2 and the ARE-binding sites on the HO-1 promoter was revealed by chromatin immunoprecipitation assay, which was attenuated by NAC, GSH, or p38i VIII. We further evaluated the functional effect of HO-1 expression on the thrombin-induced fibrotic responses. Our result indicated that the induction of HO-1 by DDF can attenuate the thrombin-induced connective tissue growth factor expression. These results suggested that DDF-induced HO-1 expression is, at least, mediated through the activation of the ROS-dependent p38 MAPK/Nrf2 signaling pathway in HCFs. Thus, the upregulation of HO-1 by DDF could be a candidate for the treatment of heart fibrosis.
Copyright © 2020 Chien-Chung Yang et al.
Conflict of interest statement
The authors declare no conflict of interest.
Figures
Similar articles
-
5,8-Dihydroxy-4 ', 7-dimethoxyflavone Attenuates TNF-α-Induced Expression of Vascular Cell Adhesion Molecule-1 through EGFR/PKCα/PI3K/Akt/Sp1-Dependent Induction of Heme Oxygenase-1 in Human Cardiac Fibroblasts.Oxid Med Cell Longev. 2022 Mar 4;2022:1372958. doi: 10.1155/2022/1372958. eCollection 2022. Oxid Med Cell Longev. 2022. PMID: 35281466 Free PMC article.
-
Mevastatin-Induced HO-1 Expression in Cardiac Fibroblasts: A Strategy to Combat Cardiovascular Inflammation and Fibrosis.Environ Toxicol. 2025 Feb;40(2):264-280. doi: 10.1002/tox.24429. Epub 2024 Oct 21. Environ Toxicol. 2025. PMID: 39431643
-
Butein induction of HO-1 by p38 MAPK/Nrf2 pathway in adipocytes attenuates high-fat diet induced adipose hypertrophy in mice.Eur J Pharmacol. 2017 Mar 15;799:201-210. doi: 10.1016/j.ejphar.2017.02.021. Epub 2017 Feb 14. Eur J Pharmacol. 2017. PMID: 28213287
-
P38 MAPK and Nrf2 Activation Mediated Naked Gold Nanoparticle Induced Heme Oxygenase-1 Expression in Rat Aortic Vascular Smooth Muscle Cells.Arch Med Res. 2020 Jul;51(5):388-396. doi: 10.1016/j.arcmed.2020.04.015. Epub 2020 May 11. Arch Med Res. 2020. PMID: 32409143
-
A prenylated flavonoid, 10-oxomornigrol F, exhibits anti-inflammatory effects by activating the Nrf2/heme oxygenase-1 pathway in macrophage cells.Int Immunopharmacol. 2018 Feb;55:165-173. doi: 10.1016/j.intimp.2017.12.015. Epub 2017 Dec 22. Int Immunopharmacol. 2018. PMID: 29258000
Cited by
-
Resveratrol Derivative, Trans-3, 5, 4'-Trimethoxystilbene Sensitizes Osteosarcoma Cells to Apoptosis via ROS-Induced Caspases Activation.Oxid Med Cell Longev. 2021 Mar 25;2021:8840692. doi: 10.1155/2021/8840692. eCollection 2021. Oxid Med Cell Longev. 2021. PMID: 33833855 Free PMC article.
-
Ulinastatin alleviates early brain injury after intracerebral hemorrhage by inhibiting oxidative stress and neuroinflammation via ROS/MAPK/Nrf2 signaling pathway.Acta Cir Bras. 2022 Sep 5;37(6):e370606. doi: 10.1590/acb370606. eCollection 2022. Acta Cir Bras. 2022. PMID: 36074399 Free PMC article.
-
Role of ferroptosis in colorectal cancer.World J Gastrointest Oncol. 2023 Feb 15;15(2):225-239. doi: 10.4251/wjgo.v15.i2.225. World J Gastrointest Oncol. 2023. PMID: 36908317 Free PMC article. Review.
-
Roles of NRF2 in Fibrotic Diseases: From Mechanisms to Therapeutic Approaches.Front Physiol. 2022 Jun 3;13:889792. doi: 10.3389/fphys.2022.889792. eCollection 2022. Front Physiol. 2022. PMID: 35721561 Free PMC article. Review.
-
Effects of emodin, a plant-derived anthraquinone, on TGF-β1-induced cardiac fibroblast activation and function.J Cell Physiol. 2021 Nov;236(11):7440-7449. doi: 10.1002/jcp.30416. Epub 2021 May 27. J Cell Physiol. 2021. PMID: 34041746 Free PMC article.
References
MeSH terms
Substances
LinkOut - more resources
Full Text Sources
Research Materials
Miscellaneous
