. 2020 Dec 2:2020:2641461.
doi: 10.1155/2020/2641461. eCollection 2020.

Neonatal Hyperoxia Downregulates Claudin-4, Occludin, and ZO-1 Expression in Rat Kidney Accompanied by Impaired Proximal Tubular Development

Affiliations

Neonatal Hyperoxia Downregulates Claudin-4, Occludin, and ZO-1 Expression in Rat Kidney Accompanied by Impaired Proximal Tubular Development

Xuewen Xu et al. Oxid Med Cell Longev. .

Abstract

Hyperoxia is essential to manage in preterm infants but causes injury to immature kidney. Previous study indicates that hyperoxia causes oxidative damage to neonatal kidney and impairs renal development. However, the underlying mechanisms by which neonatal hyperoxia effects on immature kidney still need to be elucidated. Tight junction, among which the representative proteins are claudin-4, occludin, and ZO-1, plays a crucial role in nephrogenesis and maintaining renal function. Inflammatory cytokines are involved in the pleiotropic regulation of tight junction proteins. Here, we investigated how neonatal hyperoxia affected the expression of key tight junction proteins and inflammatory factors (IL-6 and TNF-α) in the developing rat kidneys and elucidated their correlation with renal injury. We found claudin-4, occludin, and zonula occludens-1 (ZO-1) expression in proximal tubules was significantly downregulated after neonatal hyperoxia. The expression of these tight junction proteins was positively correlated with that of IL-6 and TNF-α, while claudin-4 expression was positively correlated with injury score of proximal tubules in mature kidneys. These findings indicated that impaired expression of tight junction proteins in kidney might be a potential mechanism of hyperoxia-induced nephrogenic disorders. It provides new insights to further study oxidative renal injury and development disorders and will be helpful for seeking potential therapeutics for hyperoxia-induced renal injury in the future.


Conflict of interest statement

The authors declare that there is no conflict of interest regarding the publication of this paper.

Figures
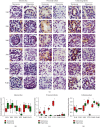
Figure 1
Figure 1
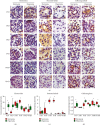
Neonatal hyperoxia downregulates expression of claudin-4 in proximal tubules. (a) Claudin-4 expression in glomeruli, proximal tubules, and collecting ducts of newborn rats, which were exposed to normoxia or hyperoxia from birth to 1st postnatal day (P1D), 3rd postnatal day (P3D), 5th postnatal day (P5D), 7th postnatal day (P7D), 10th postnatal day (P10D), and 14th postnatal day (P14D), was measured, respectively, by immunohistochemical staining (original magnification ×400. Scale bar, 20 μm. Arrow for positive staining). (b–d) The box and whisker plots represent the immunostaining intensity of claudin-4 expression in glomeruli, proximal tubules, and collecting ducts from newborn rats exposed to normoxia or hyperoxia, respectively. Relative expression is standardized to the value of normoxia group on P1D. The whiskers represent the minimal or the maximal intensity, and the boxes span the interquartile range of measurements for 10 rats with the mean value of 3 replicates (n = 10). P < 0.05, one-way ANOVA, Bonferroni post hoc test.
Figure 2
Figure 2
Neonatal hyperoxia downregulates expression of occludin in proximal tubules. (a) Occludin expression in glomeruli, proximal tubules, and collecting ducts of newborn rats, which were exposed to normoxia or hyperoxia from birth to 1st postnatal day (P1D), 3rd postnatal day (P3D), 5th postnatal day (P5D), 7th postnatal day (P7D), 10th postnatal day (P10D), and 14th postnatal day (P14D), was measured, respectively, by immunohistochemical staining (original magnification ×400. Scale bar, 20 μm. Arrow for positive staining). (b–d) The box and whisker plots represent the immunostaining intensity of occludin expression in glomeruli, proximal tubules, and collecting ducts from newborn rats exposed to normoxia or hyperoxia, respectively. Relative expression is standardized to the value of normoxia group on P1D. The whiskers represent the minimal or the maximal intensity, and the boxes span the interquartile range of measurements for 10 rats with the mean value of 3 replicates (n = 10). P < 0.05, one-way ANOVA, Bonferroni post hoc test.
Figure 3
Figure 3
Neonatal hyperoxia downregulates expression of ZO-1 in proximal tubules. (a) ZO-1 expression in glomeruli, proximal tubules, and collecting ducts of newborn rats, which were exposed to normoxia or hyperoxia from birth to 1st postnatal day (P1D), 3rd postnatal day (P3D), 5th postnatal day (P5D), 7th postnatal day (P7D), 10th postnatal day (P10D), and 14th postnatal day (P14D), was measured, respectively, by immunohistochemical staining (original magnification ×400. Scale bar, 20 μm. Arrow for positive staining). (b–d) The box and whisker plots represent the immunostaining intensity of ZO-1 expression in glomeruli, proximal tubules, and collecting ducts from newborn rats exposed to normoxia or hyperoxia, respectively. Relative expression is standardized to the value of normoxia group on P1D. The whiskers represent the minimal or the maximal intensity, and the boxes span the interquartile range of measurements for 10 rats with the mean value of 3 replicates (n = 10). P < 0.05, one-way ANOVA, Bonferroni post hoc test.
Figure 4
Figure 4
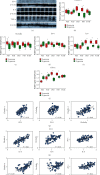
Tight junction protein expression is positively correlated with that of inflammatory cytokines after neonatal hyperoxia. (a) Expression bands of claudin-4, occludin, ZO-1, IL-6, and tumor necrosis factor-α (TNF-α) in the kidneys of newborn rats exposed to normoxia or hyperoxia till 1st postnatal day (P1D), 3rd postnatal day (P3D), 5th postnatal day (P5D), 7th postnatal day (P7D), and 14th postnatal day (P14D) were detected by western blotting. (b–f) The box and whisker plots represent relative protein expression of claudin-4, occludin, ZO-1, IL-6, and TNF-α, respectively. Quantified band intensities were normalized to β-actin and then standardized to the value of normoxia group on P1D. The whiskers represent the minimal or the maximal gray value, and the boxes span the interquartile range of measurements for 10 rats with the mean value of 3 replicates (n = 10). P < 0.05, one-way ANOVA, Bonferroni post hoc test. (g) Graphs represent linear correlation among expression of claudin-4, occludin, and ZO-1. (h) Graphs represent linear correlation between expression of claudin-4, occludin, ZO-1, and IL-6. (i) Graphs represent linear correlation between expression of claudin-4, occludin, ZO-1, and TNF-α in neonatal kidneys exposed to hyperoxia or normoxia. The correlation coefficient (r2) along with the best-fit line (solid line) and 95% confidence band (dashed line) is plotted when it is found to be statistically significant (n = 20, simple regression).
Figure 5
Figure 5
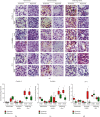
Neonatal hyperoxia downregulates claudin-4 in proximal tubules as well as occludin and ZO-1 in the collecting ducts of adult rats. (a) The expression of claudin-4, occludin, and ZO-1 in glomeruli, proximal tubules, and collecting ducts of adult rats on 30th postnatal day (P30D) and 60th postnatal day (P60D), which were exposed to normoxia or hyperoxia from birth to 14th postnatal day, was measured, respectively, by immunohistochemical staining (original magnification ×400. Scale bar, 20 μm. Arrow for positive staining). (b–d) Graphs represent the immunostaining intensity of claudin-4, occludin, and ZO-1 expression in glomeruli, proximal tubules, and collecting ducts of adult rats on P30D and P60D, which were exposed to normoxia or hyperoxia from birth to 14th postnatal day. Relative expression is standardized to the value of normoxia group on P30D. Values are means ± SE from n = 10 samples. P < 0.05 compared with normoxia group (one-way ANOVA).
Figure 6
Figure 6
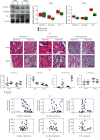
The injury score of proximal tubules is negatively correlated with claudin-4 expression in mature kidneys. (a) Expression bands of claudin-4, occludin, and ZO-1 in kidneys of adult rats on 30th postnatal day (P30D) and 60th postnatal day (P60D), which were exposed to neonatal normoxia or hyperoxia from birth to 14th postnatal day, were detected by western blotting. The whisker and box plots represent relative protein expression of claudin-4, occludin, and ZO-1. Quantified band intensities were normalized to β-actin and then standardized to the value of normoxia group on P30D. The whiskers represent the minimal or the maximal gray value, and the boxes span the interquartile range of measurements for 10 rats with the mean value of 3 replicates (n = 10). P < 0.05, one-way ANOVA, Bonferroni post hoc test. (b) The glomeruli, proximal tubules, and collecting ducts of adult rats, including those from the 30th postnatal day (P30D) and 60th postnatal day (P60D), which were exposed to neonatal normoxia or hyperoxia from birth to 14th postnatal day were detected by hematoxylin and eosin (H&E) staining (original magnification ×400. Scale bar, 100 μm or 20 μm. Arrow for vacuolation, and arrowheads for thinner tubules and tubular dilation). (c) Graphs represent the glomerular diameters, glomerular numbers, injury scores of proximal tubules, and cast counts in collecting ducts from adult rats exposed to neonatal normoxia or hyperoxia from birth to 14th postnatal day. Values are means ± SE from n = 10 samples. P < 0.05 compared with normoxia group (one-way ANOVA). (d) Graphs represent linear correlation between relative immunostaining intensity of claudin-4, occludin, ZO-1, injury scores of proximal tubules, and glomerular number in mature kidneys exposed to neonatal hyperoxia or normoxia from birth to 14th postnatal day. The correlation coefficient (r2) along with the best-fit line (solid line) and 95% confidence band (dashed line) is plotted when it is found to be statistically significant (n = 20, simple regression).

Similar articles

Cited by

References

    1. Cherian S., Morris I., Evans J., Kotecha S. Oxygen therapy in preterm infants. Paediatric Respiratory Reviews. 2014;15(2):135–141. doi: 10.1016/j.prrv.2012.12.003. - DOI - PubMed
    1. Zoban P. Optimal oxygen saturation in extremely premature neonates. Physiological Research. 2019;68(2):171–178. doi: 10.33549/physiolres.933987. - DOI - PubMed
    1. Mohr J., Voggel J., Vohlen C., et al. IL-6/Smad2 signaling mediates acute kidney injury and regeneration in a murine model of neonatal hyperoxia. The FASEB Journal. 2019;33(5):5887–5902. doi: 10.1096/fj.201801875RR. - DOI - PubMed
    1. Xu X., You K., Bu R. Proximal tubular development is impaired with downregulation of MAPK/ERK signaling, HIF-1α, and catalase by hyperoxia exposure in neonatal rats. Oxidative Medicine and Cellular Longevity. 2019;2019:9219816. doi: 10.1155/2019/9219847. - DOI - PMC - PubMed
    1. Popescu C. R., Sutherland M. R., Cloutier A., et al. Hyperoxia exposure impairs nephrogenesis in the neonatal rat: role of HIF-1α. PLoS One. 2013;8(12, article e82421) doi: 10.1371/journal.pone.0082421. - DOI - PMC - PubMed

LinkOut - more resources