. 2020 Dec 4:2020:9067610.
doi: 10.1155/2020/9067610. eCollection 2020.

Melatonin Suppresses Ferroptosis Induced by High Glucose via Activation of the Nrf2/HO-1 Signaling Pathway in Type 2 Diabetic Osteoporosis

Affiliations

Melatonin Suppresses Ferroptosis Induced by High Glucose via Activation of the Nrf2/HO-1 Signaling Pathway in Type 2 Diabetic Osteoporosis

Hongdong Ma et al. Oxid Med Cell Longev. .

Abstract

Ferroptosis is recently identified, an iron- and reactive oxygen species- (ROS-) dependent form of regulated cell death. This study was designed to determine the existence of ferroptosis in the pathogenesis of type 2 diabetic osteoporosis and confirm that melatonin can inhibit the ferroptosis of osteoblasts through activating Nrf2/HO-1 signaling pathway to improve bone microstructure in vivo and in vitro. We treated MC3T3-E1 cells with different concentrations of melatonin (1, 10, or 100 μM) and exposed them to high glucose (25.5 mM) for 48 h in vitro. Our data showed that high glucose can induce osteoblast cytotoxicity and the accumulation of lipid peroxide, the mitochondria of osteoblast show the same morphology changes as the erastin treatment group, and the expression of ferroptosis-related proteins glutathione peroxidase 4 (GPX4) and cystine-glutamate antiporter (SLC7A11) is downregulated, but these effects were reversed by ferroptosis inhibitor ferrastatin-1 and iron chelator deferoxamine (DFO). Furthermore, western blot and real-time polymerase chain reaction were used to detect the expression levels of nuclear factor erythroid 2-related factor 2 (Nrf2) and heme oxygenase-1 (HO-1); osteogenic capacity was evaluated by alizarin red S staining and the expression of osteoprotegerin, osteocalcin, and alkaline phosphatase; the results showed that the expression levels of these proteins in osteoblasts with 1, 10, or 100 μM melatonins were significantly higher than the high glucose group, but after using Nrf2-SiRNA interference, the therapeutic effect of melatonin was significantly inhibited. We also performed in vivo experiments in a diabetic rat model treated with two concentrations of melatonin (10, 50 mg/kg). Dynamic bone histomorphometry and micro-CT were used to observe the rat bone microstructure, and the expression of GPX4 and Nrf2 was determined by immunohistochemistry. Here, we first report that high glucose induces ferroptosis via increased ROS/lipid peroxidation/glutathione depletion in type 2 diabetic osteoporosis. More importantly, melatonin significantly reduced the level of ferroptosis and improved the osteogenic capacity of MC3T3-E1 through activating the Nrf2/HO-1 pathway in vivo and in vitro.


Conflict of interest statement

The authors declare no competing financial interests. No benefits in any form have been or will be received from a commercial party directly or indirectly by the authors of this article.

Figures

Figure 1
Figure 1
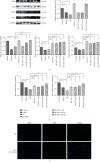
Ferroptosis is induced by high glucose in MC3T3 cells. (a) MC3T3 cells were cultured with Z-VAD-FMK (Z, 10 μM), necrostain-1 (Nec-1, 50 μM), 3-methyladenine (3-MA, 5 mM), ferrostatin-1 (Fer-1, 5 μM), and deferoxamine (DFO, 10 μM), respectively, followed by high glucose (HG, 25.5 mM) for 24 h. (b) MC3T3 cells were only cultured with Z-VAD-FMK, Nec-1, 3-MA, Fer-1, and DFO, Cell survival was tested by CCK-8 assay. (c) MC3T3 cells were treated with erastin (10 μM) as a positive control. The ferroptosis-related proteins, GPx4 and SLC7A11, were determined by western blotting. (d) Transmission electron microscopy images of MC3T3 cells treated with HG (25.5 mM) and erastin (10 μM), respectively, for 24 h. Arrows indicate mitochondria. Scale bars: 2 μm; 0.5 μm. Standard error represents three independent experiments (n = 3). P < 0.05 vs. control, #P < 0.05 vs. HG treatment.
Figure 2
Figure 2
Melatonin suppresses ferroptosis via activation of Nrf2/HO-1 signaling pathway in vitro. (a) GPx4, Nrf2, NQO1, and HO-1 protein levels in MC3T3 cells treated with high glucose (HG, 25.5 mM), melatonin (1, 10, or 100 μM), or both, determined by western blot. (b) Real-time reverse transcription-polymerase chain reaction analysis of NRF2 and HMOX1 mRNA expression levels in MC3T3 cells treated with HG (25.5 mM), melatonin (1, 10, or 100 μM), or both for 48 h. (c) Immunofluorescence staining to detect the expression and location of NRF2 in MC3T3 cells treated with HG (25.5 mM) and melatonin (100 μM). Standard error represents three independent experiments (n = 3). P < 0.05 vs. control, #P < 0.05 vs. HG treatment.
Figure 3
Figure 3
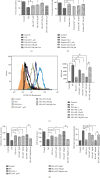
Melatonin improves MC3T3 cell viability by inhibiting lipid peroxidation. (a) MC3T3 cells were exposed to high glucose (HG, 25.5 mM) for 24 h before treatment with melatonin (1, 10, or 100 μM) for 48 h. The melatonin receptor inhibitor luzindole (Luz, 5 μM) was used in combination with the 100 μM melatonin group. Cell survival was determined by CCK-8 assay. (b) MC3T3 cells were treated with erastin (10 μM) instead of HG for 24 h before treatment with melatonin (1, 10, or 100 μM) for 48 h, and cell survival was tested by CCK-8 assay. (c) ROS generation was demonstrated by flow cytometry with dihydroethidium (10 μM) after MC3T3 cells were treated for 48 h. (d) Glutathione levels in MC3T3 cells after indicated treatments. Lipid peroxidation was determined by malondialdehyde and superoxide dismutase assays. Standard error represents three independent experiments (n = 3). P < 0.05 vs. control, #P < 0.05 vs. HG or erastin treatment, &P < 0.05 vs. HG + 100 μM melatonin treatment.
Figure 4
Figure 4
Inhibition of ferroptosis by melatonin can be regulated by NRF2-siRNA. (a) Nrf2 protein levels in MC3T3 cells demonstrated by western blotting. Histogram shows densitometry quantification of Nrf2 normalized to actin. (b) MC3T3 cells were exposed to high glucose (HG, 25.5 mM) and transfected with NRF2-siRNA for 24 h before treatment with melatonin (100 μM). Cell survival was tested by CCK-8 assay. (c) GPx4 and SLC7A11 protein levels in MC3T3 cells after different treatments, demonstrated by western blotting. Standard error represents three independent experiments (n = 3). P < 0.05 vs. HG treatment, #P < 0.05 vs. HG + 100 μM melatonin treatment.
Figure 5
Figure 5
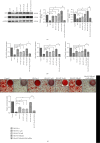
Melatonin improves osteogenic capability by suppressing ferroptosis in MC3T3 cells. (a) Osteoprotegerin (OPG) and osteocalcin (OCN) protein levels in MC3T3 cells detected by western blotting after high glucose (HG) and melatonin treatment (1, 10, or 100 μM) for 48 h, then replace transfected cells in HG+ 100 μM melatonin group. (b) Real-time reverse transcription-polymerase chain reaction analysis of ALP, OPG, and OCN mRNA expression in MC3T3 cells after indicated treatments. (c) Mineralized extracellular matrix in transfected MC3T3 cells after osteogenic differentiation for 14 days, shown by alizarin red S staining. Standard error represents three independent experiments (n = 3). P < 0.05 vs. HG treatment, #P < 0.05 vs. HG + 100 μM melatonin treatment.
Figure 6
Figure 6
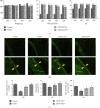
Melatonin increases mineral apposition and bone formation in type 2 diabetic osteoporosis. Forty-five model rats were divided into low-dose melatonin (LMT, n = 15, 10 mg/kg melatonin), high-dose melatonin (HMT, n = 15, 50 mg/kg melatonin), and control type 2 diabetes mellitus (T2DM, n = 15) groups. Fifteen nondiabetic rats were included as a control group. (a) Evaluation of T2DM model. Body weights were significantly lower in the model rats at 8 and 12 weeks, while FBG levels were significantly higher, and the insulin sensitivity index was consistently lower in the model rats at 4, 8, and 12 weeks, compared with the control group. (b) Calcein double-labeling was measured using a fluorescence microscope. Arrows represent bone formation in the interval between the two injections of calcein. (c) Mineral apposition rate, mineralizing surface/BS, and bone-formation rate were analyzed using the Osteo-Measure histomorphometry system. P < 0.05 vs. control, #P < 0.05 vs. T2DM.
Figure 7
Figure 7
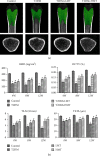
Melatonin displays protective effects on trabecular bone mass in type 2 diabetic osteoporosis. (a) Microcomputed tomography (CT) analysis of the distal metaphyseal femur region. (b) Micro-CT-based quantification within the distal metaphyseal femur region. The 3D indices in the defined region of interest were analyzed. BMD: bone mineral density; Tb.N: trabecular number; Tb.Th: trabecular thickness; BV/TV: relative bone volume over total volume. P < 0.05 vs. control, #P < 0.05 vs. T2DM.
Figure 8
Figure 8
Melatonin suppresses ferroptosis via activation of the Nrf2 signaling pathway in vivo. GPx4 and Nrf2 expression were detected by immunohistochemistry at 12 weeks. GPx4 protein expression was significantly lower in the type 2 diabetes mellitus (T2DM) compared with the control group, and GPx4 and Nrf2 expression levels were higher in the high-dose and low-dose melatonin groups compared with the T2DM group. P < 0.05 vs. control, #P < 0.05 vs. T2DM.

References

    1. Rathmann W., Kostev K. Fracture risk in patients with newly diagnosed type 2 diabetes: a retrospective database analysis in primary care. Journal of Diabetes and its Complications. 2015;29(6):766–770. doi: 10.1016/j.jdiacomp.2015.05.007. - DOI - PubMed
    1. Vestergaard P. Discrepancies in bone mineral density and fracture risk in patients with type 1 and type 2 diabetes—a meta-analysis. Osteoporosis International. 2007;18(4):427–444. doi: 10.1007/s00198-006-0253-4. - DOI - PubMed
    1. Napoli N., Strotmeyer E. S., Ensrud K. E., et al. Fracture risk in diabetic elderly men: the MrOS study. Diabetologia. 2014;57(10):2057–2065. doi: 10.1007/s00125-014-3289-6. - DOI - PMC - PubMed
    1. Adil C., Aydın T., Taşpınar Ö., et al. Bone mineral density evaluation of patients with type 2 diabetes mellitus. Journal of Physical Therapy Science. 2015;27(1):179–182. doi: 10.1589/jpts.27.179. - DOI - PMC - PubMed
    1. Pietschmann P., Patsch J. M., Schernthaner G. Diabetes and bone. Hormone & Metabolic Research. 2010;42(11):763–768. doi: 10.1055/s-0030-1262825. - DOI - PubMed

MeSH terms