. 2020 Dec 14;9(12):e1224.
doi: 10.1002/cti2.1224. eCollection 2020.

Innate lymphoid cell composition associates with COVID-19 disease severity

Affiliations

Innate lymphoid cell composition associates with COVID-19 disease severity

Marina García et al. Clin Transl Immunology. .

Abstract

Objectives: The role of innate lymphoid cells (ILCs) in coronavirus disease 2019 (COVID-19), caused by severe acute respiratory syndrome coronavirus 2 (SARS-CoV-2), is unknown. Understanding the immune response in COVID-19 could contribute to unravel the pathogenesis and identification of treatment targets. Here, we describe the phenotypic landscape of circulating ILCs in COVID-19 patients and identified ILC phenotypes correlated to serum biomarkers, clinical markers and laboratory parameters relevant in COVID-19.

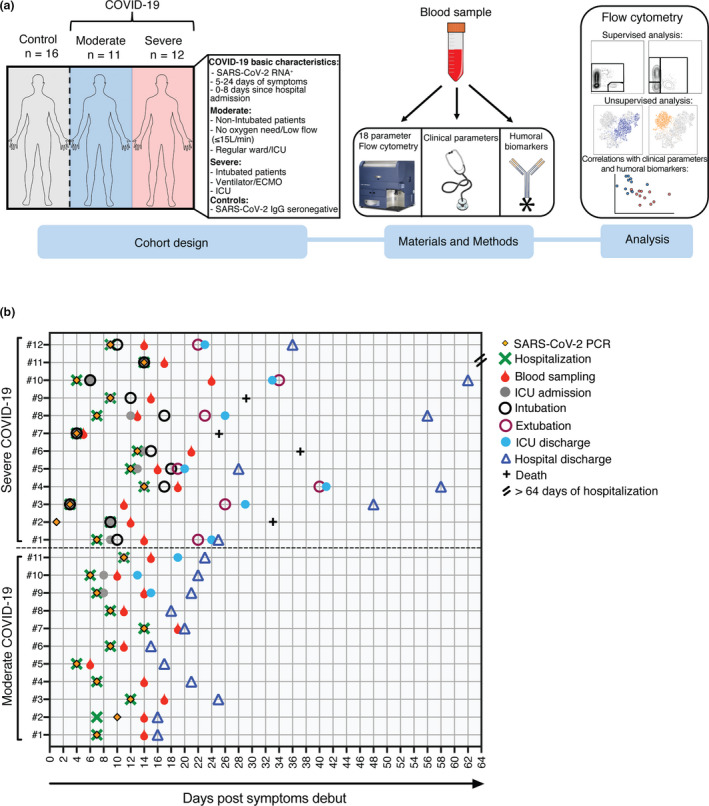
Methods: Blood samples collected from moderately (n = 11) and severely ill (n = 12) COVID-19 patients, as well as healthy control donors (n = 16), were analysed with 18-parameter flow cytometry. Using supervised and unsupervised approaches, we examined the ILC activation status and homing profile. Clinical and laboratory parameters were obtained from all COVID-19 patients, and serum biomarkers were analysed with multiplex immunoassays.

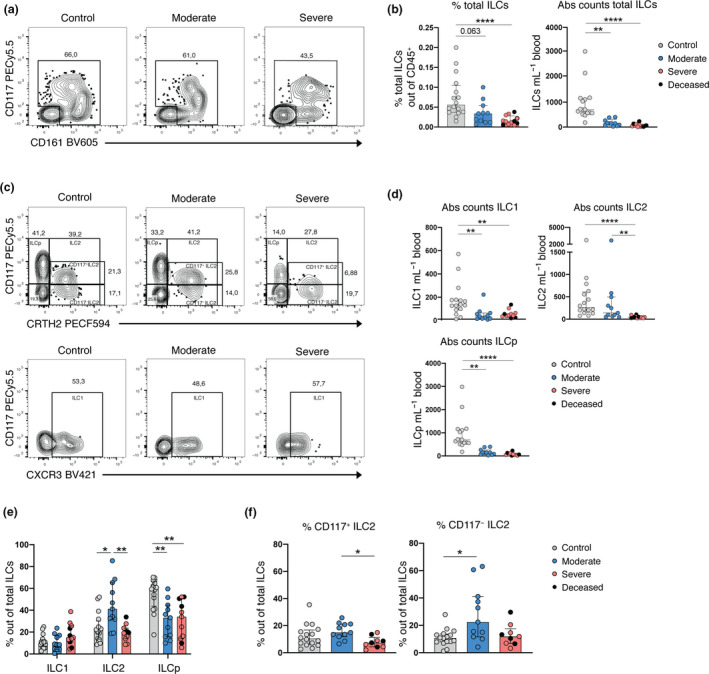
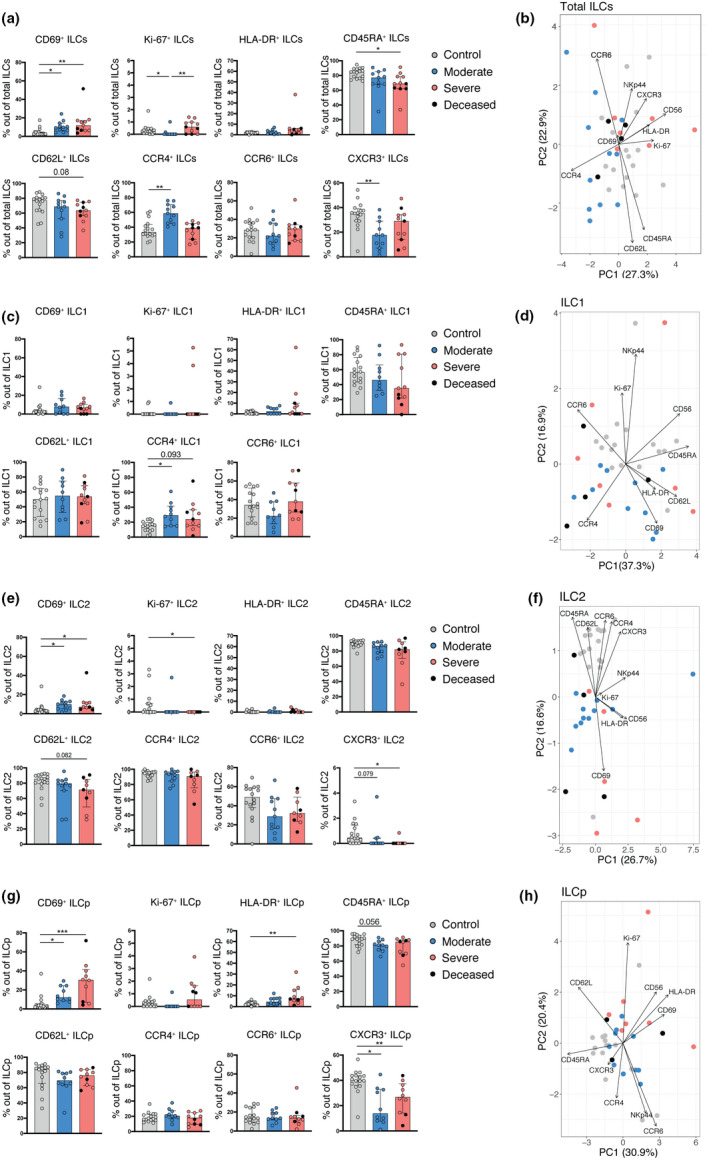
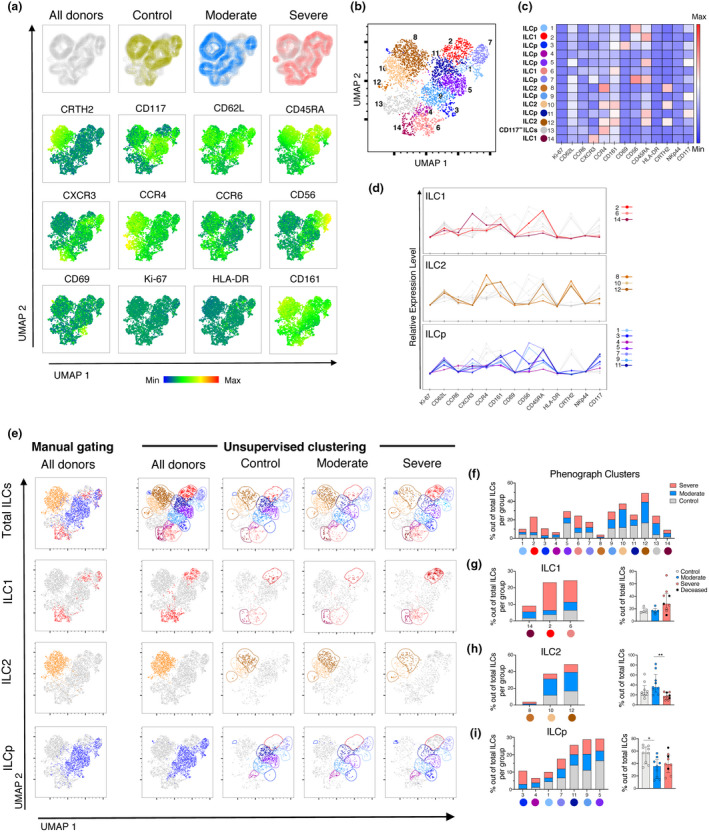
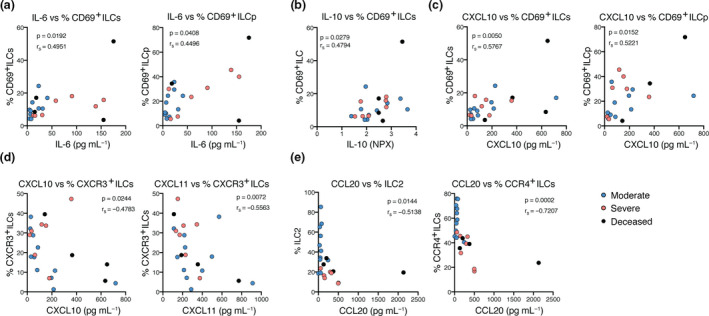
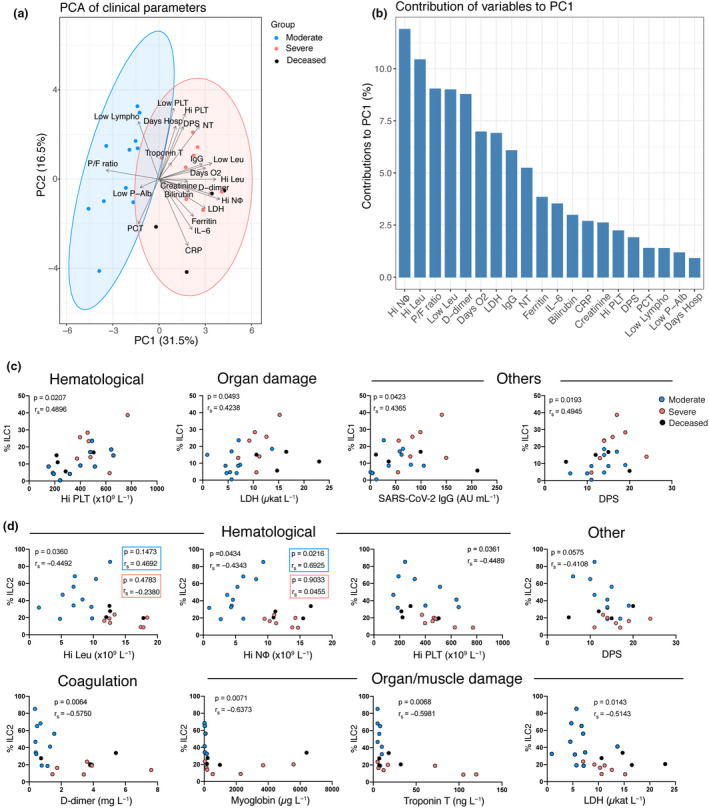
Results: Innate lymphoid cells were largely depleted from the circulation of COVID-19 patients compared with healthy controls. Remaining circulating ILCs revealed decreased frequencies of ILC2 in severe COVID-19, with a concomitant decrease of ILC precursors (ILCp) in all patients, compared with controls. ILC2 and ILCp showed an activated phenotype with increased CD69 expression, whereas expression levels of the chemokine receptors CXCR3 and CCR4 were significantly altered in ILC2 and ILCp, and ILC1, respectively. The activated ILC profile of COVID-19 patients was associated with soluble inflammatory markers, while frequencies of ILC subsets were correlated with laboratory parameters that reflect the disease severity.

Conclusion: This study provides insights into the potential role of ILCs in immune responses against SARS-CoV-2, particularly linked to the severity of COVID-19.

Keywords: COVID‐19; SARS‐CoV‐2; coronavirus; immune response; innate lymphoid cells; respiratory viral infection.


Conflict of interest statement

The authors declare that the research was conducted in the absence of any commercial or financial relationships that could be construed as a potential conflict of interest. HGL is a member of the board of XNK Therapeutics AB and Vycellix Inc.

Figures

Figure 1
Figure 1
Experimental design and COVID‐19 cohort characteristics. (a) Schematic representation of the cohort characteristics (left), materials and methods (middle) and the type of analysis performed using the flow cytometric data (right). (b) Graphical overview of all COVID‐19 patients (n = 23) illustrating clinical events from the day of symptom debut. Depicted are the day of the SARS‐CoV‐2 PCR test, hospitalisation and blood sampling. For all the severe patients and three of the moderate patients, the day of the intensive care unit (ICU) admission and discharge is indicated. Furthermore, the day of intubation/extubation of the severe patients is shown. Lastly, depicted is the day of hospital discharge for 22 out of 23 patients and the number of deceased patients (n = 4). One patient from the severe group (#11) is still in ECMO with ongoing hospitalisation (> 64 days).
Figure 2
Figure 2
Depletion and altered frequency of ILCs in the peripheral blood of COVID‐19 patients. (a) Representative flow cytometry plots depicting the gate for the identification of the total ILCs in one control donor, one moderate and one severe COVID‐19 patient. (b) Bar plot summaries of the percentage (left) and absolute counts (per mL of blood) (right) of total ILCs in control donors (n = 16), moderate (n = 11) and severe (n = 12) COVID‐19 patients. (c) Representative flow cytometry plots depicting total ILCs gated as: ILCp, ILC2 (CD117+/) (upper row) and ILC1 (lower row) in one control donor, one moderate and one severe COVID‐19 patient. (d) Bar plot summaries of absolute counts of ILC1, ILC2 and ILCp subsets (per mL of blood) in control donors (n = 16), moderate (n = 11) and severe (n = 11) COVID‐19 patients. (e) Bar plot summaries of the percentage of ILC1, ILC2 and ILCp of total ILCs in control donors (n = 16), moderate (n = 11) and severe (n = 11) COVID‐19 patients. (f) Bar plot summaries of the percentage of CD117+ and CD117 ILC2 of total ILCs in control donors (n = 16), moderate (n = 11) and severe (n = 9) COVID‐19 patients. (b, d, e, f) Statistical differences were tested using the Kruskal–Wallis test followed by Dunn's multiple comparisons test. Numbers in flow cytometry plots indicate percentage of cells within the mother gate. Bar graphs are shown as median ± IQR, *P < 0.05, **P < 0.01, ***P < 0.001. Patients with low cell numbers (fewer than 20 events) in the corresponding gate were removed from the analysis.
Figure 3
Figure 3
ILCs reveal an activated and migratory profile in peripheral blood of COVID‐19 patients. (a) Bar plot summaries showing the percentages of the indicated markers in total ILCs in control donors (n = 16), moderate (n = 11) and severe (n = 11) COVID‐19 patients. (b) PCA plot of total ILCs from control donors (n = 16), moderate (n = 11) and severe (n = 11) COVID‐19 patients based on the cell surface markers presented in (a). (c) Bar plot summaries showing the percentages of the indicated markers in the ILC1 subset in control donors (n = 16), moderate (n = 10) and severe (n = 11) groups. (d) PCA plot of ILC1 showing the contribution of cell surface markers indicated in (c). (e) Bar plot summaries showing the percentages of the indicated markers in the ILC2 subset in control donors (n = 16), moderate (n = 11) and severe (n = 9) groups. (f) PCA plot of ILC2 showing the contribution of cell surface markers indicated in (e). (g) Bar plot summaries showing the percentages of the indicated markers in the ILCp subset in control donors (n = 16), moderate (n = 10) and severe (n = 10) groups. (h) PCA plot of ILCp showing the contribution of cell surface markers indicated in (g). (a, c, e, g) Statistical differences were tested using the Kruskal–Wallis test followed by Dunn's multiple comparisons. Bar graphs are shown as median ± IQR, *P < 0.05, **P < 0.01, ***P < 0.001. Patients with low cell numbers (fewer than 20 events) in the corresponding gate were removed from the analysis. In PCA plots, each dot represents one donor. Deceased patients in the severe group are indicated by a black dot.
Figure 4
Figure 4
Dimensionality reduction analysis of ILCs in the peripheral blood of COVID‐19 patients distinguishes moderate and severe COVID‐19 patients. (a) Top row: UMAP of total ILCs from control donors and COVID‐19 patients (All donors), overlaid by patient groups: control donors (yellow), moderate COVID‐19 patients (blue) and severe COVID‐19 patients (pink) (from left to right). Middle and bottom rows: UMAP (All donors) coloured according to the fluorescence intensity expression (median) of the indicated phenotypic markers. (b) UMAP of the total ILCs overlaid with the 14 clusters identified by Phenograph. (c) Heatmap displaying the median of expression of the indicated markers for each Phenograph cluster. Each cluster was assigned an ILC subset identity (ILC1, ILC2, ILCp and CD117 ILC) based on the heatmap and the relative expression levels graph in (d). (d) Relative expression level of markers in the Phenograph clusters, grouped by ILC subsets (ILC1, ILC2 and ILCp). Grey lines in each graph are the rest of clusters not belonging to the ILC subset depicted. (e) Far left column: manually defined gates of total ILCs and ILC subsets ILC1, ILC2 and ILCp overlaid on the All donors UMAP in (a). Right columns: UMAP of total ILCs overlaid with the 14 ILCs clusters identified by Phenograph and displayed according to patient group (columns) and ILCs subsets (rows). Colours used for the clusters correspond to the colours used in Figure 4b–d. (f) Stacked bar graph of the percentage of all the Phenograph‐identified clusters out of total ILCs in control donors (grey), moderate (blue) and severe COVID‐19 patients (pink). (g) Left: stacked bar graph of the percentage of the Phenograph‐identified clusters belonging to ILC1 out of total ILCs in controls (grey), moderate (blue) and severe (pink) COVID‐19 patients. Right: Percentage of the sum of events corresponding to the ILC1 Phenograph‐identified clusters (14, 2, 6) out of total ILCs, in control donors (n = 5), moderate (n = 5) and severe (n = 9) COVID‐19 patients. (h) Left: stacked bar graph of the percentage of the Phenograph‐identified clusters belonging to ILC2 out of total ILCs in control donors, moderate and severe COVID‐19 patients. Right: Percentage of the sum of events corresponding to the ILC2 Phenograph‐identified clusters (8, 10, 12) out of total ILCs, in control donors (n = 9), moderate (n = 9) and severe (n = 9) COVID‐19 patients. (i) Left: stacked bar graph of the percentage of the Phenograph‐identified clusters belonging to ILCp out of total ILCs in control donors, moderate and severe COVID‐19 patients. Right: percentage of the sum of events corresponding to the ILCp Phenograph‐identified clusters (3, 4, 1, 7, 11, 9, 5) out of total ILCs, in control donors (n = 9), moderate (n = 9), and severe (n = 9) COVID‐19 patients. (g–i) Patients with fewer than 10 events per ILC subset (defined by the Phenograph‐identified clusters) were excluded from analysis. Statistical differences were tested using the Kruskal–Wallis test followed by Dunn's multiple comparisons test. Bar graphs are shown as median ± IQR, *P < 0.05, **P < 0.01.
Figure 5
Figure 5
Activation status and homing profile of peripheral blood ILCs associate with inflammation markers in COVID‐19 patients. Spearman correlations between (a) serum IL‐6 levels (pg mL−1) and the percentage of CD69+ ILCs and CD69+ ILCp; (b) serum IL‐10 relative levels (NPX) and the percentage of CD69+ ILCs; (c) serum CXCL10 levels (pg mL−1) and the percentage of CD69+ ILCs and CD69+ ILCp; (d) serum CXCL10 and CXCL11 levels (pg mL−1) and the percentage of CXCR3+ ILCs; (e) serum CCL20 levels (pg mL−1) and the percentage of ILC2 and CCR4+ ILCs in COVID‐19 patients. IL‐6, CXCL10, CXCL11 and CCL20 serum absolute levels were measured with Magnetic Luminex Screening assay, and IL‐10 relative levels with a proximity extension assay, where data are shown as normalised protein expression (NPX). Blue circles: moderate COVID‐19 patients (n = 11); pink circles: severe COVID‐19 patients (n = 11); black circles: deceased severe COVID‐19 patients (n = 4). P < 0.05 was considered statistically significant. r s: Spearman's rank correlation coefficient.
Figure 6
Figure 6
Peripheral blood ILC subsets associate with biochemical and haematological parameters that reflect COVID‐19 severity. (a) Principal component analysis (PCA) of COVID‐19 patients displaying the distribution and segregation of COVID‐19 patients according to clinical and laboratory parameters. (b) Bar plot showing the percentage contribution of each clinical or laboratory parameter to principal component 1 (PC1). (c) Correlation plots between the percentage of ILC1 and the indicated haematological (Hi PLT), organ damage (LDH) and other parameters (SARS‐CoV‐2 IgG and DPS) in COVID‐19 patients (moderate n = 11; severe n = 11). (d) Correlation plots between the percentage of ILC2 and the indicated haematological (Hi Leu, Hi NΦ, Hi PLT and DPS), coagulation (D‐dimer), organ damage (myoglobin, troponin T and LDH) and other (DPS) parameters in COVID‐19 patients (moderate n = 11; severe n = 11). Hi NΦ: highest neutrophil count ± 24 h from sampling (f.s.); Hi Leu: highest leukocyte count ± 24 h f. s.; P/F ratio: PaO2/FiO2 ratio (mmHg) at sampling; Low Leu: Lowest leukocyte count ± 24 h f. s.; D‐dimer: highest D‐dimer level ± 24 h f. s.; Days O2: days of oxygen treatment; LDH: highest lactate dehydrogenase before sampling (b.s); IgG/SARS‐CoV‐2 IgG: SARS‐CoV‐2 IgG antibody level; NT: neutralising antibody titres at sampling; Ferritin: highest ferritin level ± 24 h f. s.; IL‐6: IL‐6 levels at the time of sampling; Bilirubin: highest bilirubin ± 24 h f. s.; CRP: highest C‐reactive protein ± 24 h f. s.; Creatinine: highest creatinine ± 24 h f. s.; Hi PLT: highest platelet count b.s; DPS: days post‐symptom debut until sampling; PCT: highest procalcitonin ± 24 h f. s.; Low Lympho: Lowest lymphocyte count ± 24 h f. s.; Low P‐Alb: lowest P‐Albumin ± 24 h f. s.; Days Hosp: days of hospitalisation until sampling. Spearman’s rank correlation test was applied for assessing correlations between variables.

References

    1. Alijotas‐Reig J, Esteve‐Valverde E, Belizna C et al Immunomodulatory therapy for the management of severe COVID‐19. Beyond the anti‐viral therapy: a comprehensive review. Autoimmun Rev 2020; 19: 102569. - PMC - PubMed
    1. Riva L, Yuan S, Yin X et al Discovery of SARS‐CoV‐2 antiviral drugs through large‐scale compound repurposing. Nature 2020; 586: 113–119. - PMC - PubMed
    1. Le Thanh T, Andreadakis Z, Kumar A et al The COVID‐19 vaccine development landscape. Nat Rev Drug Discov 2020; 19: 305–306. - PubMed
    1. Zhou P, Lou Yang X, Wang XG et al A pneumonia outbreak associated with a new coronavirus of probable bat origin. Nature 2020; 579: 270–273. - PMC - PubMed
    1. Chen G, Wu D, Guo W et al Clinical and immunological features of severe and moderate coronavirus disease 2019. J Clin Invest 2020; 130: 2620–2629. - PMC - PubMed