. 2020 Dec 7;9(13):9.
doi: 10.1167/tvst.9.13.9. eCollection 2020 Dec.

The Influence of Axial Length Upon the Retinal Ganglion Cell Layer of the Human Eye

Affiliations

The Influence of Axial Length Upon the Retinal Ganglion Cell Layer of the Human Eye

Min Chen et al. Transl Vis Sci Technol. .

Abstract

Purpose: Variation in retinal thickness with eye size complicates efforts to estimate retinal ganglion cell number from optical coherence tomography (OCT) measures. We examined the relationship among axial length, the thickness and volume of the ganglion cell layer (GCL), and the size of the optic chiasm.

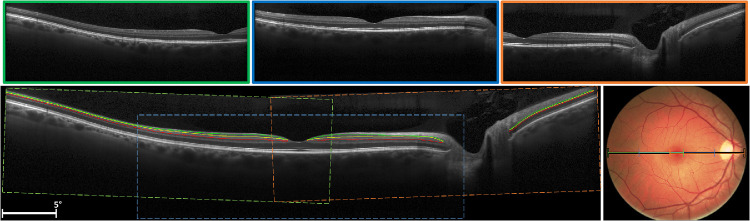
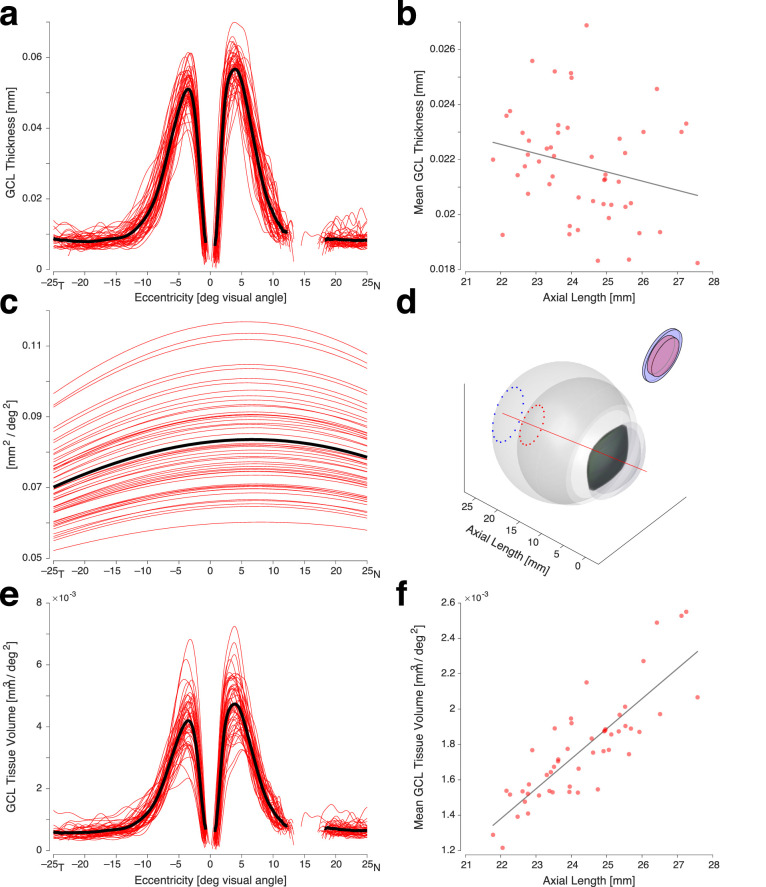
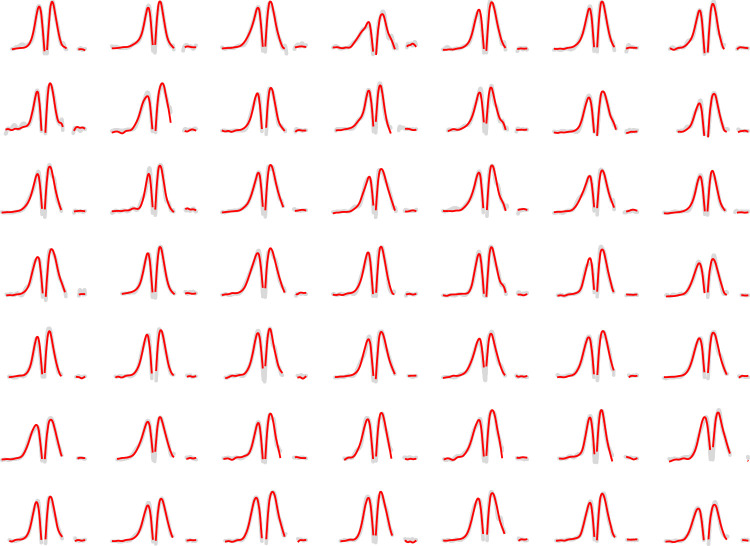
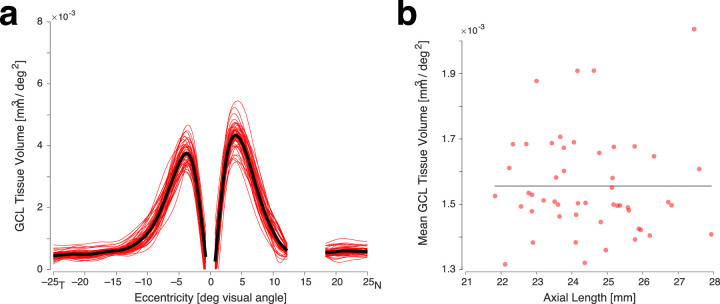
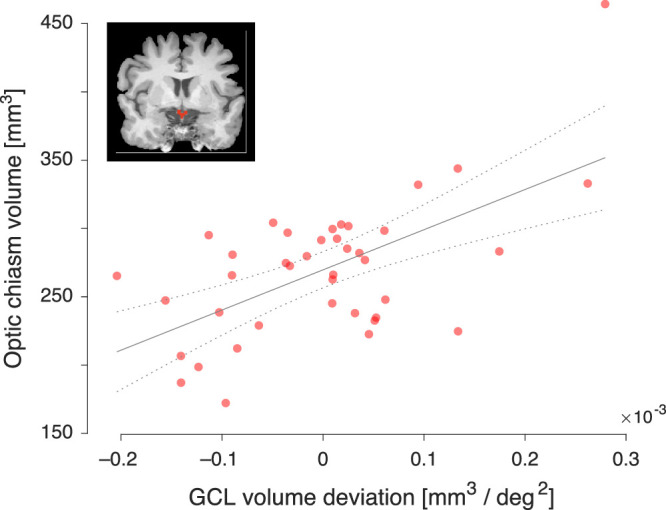
Methods: We used OCT to measure GCL thickness over 50 degrees of the horizontal meridian in 50 healthy participants with a wide range of axial lengths. Using a model eye informed by individual biometry, we converted GCL thickness to tissue volume per square degree. We also measured the volume of the optic chiasm for 40 participants using magnetic resonance imaging (MRI).

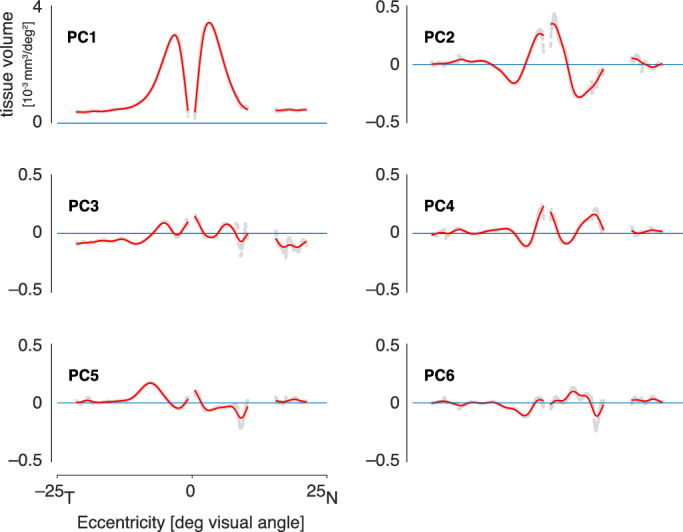
Results: There is a positive relationship between GCL tissue volume and axial length. Given prior psychophysical results, we conclude that increased axial length is associated with increased retinal ganglion cell size, decreased cell packing, or both. We characterize how retinal ganglion cell tissue varies systematically in volume and spatial distribution as a function of axial length. This model allows us to remove the effect of axial length from individual difference measures of GCL volume. We find that variation in this adjusted GCL volume correlates well with the size of the optic chiasm.

Conclusions: Our results provide the volume of ganglion cell tissue in the retina, adjusted for the presumed effects of axial length upon ganglion cell size and/or packing. The resulting volume measure accounts for individual differences in the size of the optic chiasm, supporting its use to characterize the post-retinal visual pathway.

Translational relevance: Variations in ametropia can confound clinical measures of retinal features. We present a framework within which the thickness and volume of retinal structures can be measured and corrected for the effects of axial length.

Keywords: model eye; optical coherence tomography; retinal ganglion cells; spatial acuity.


Conflict of interest statement

Disclosure: M. Chen, None; J. Nofziger, None; R. Datta, None; J.C. Gee, None; J. Morgan, None; G.K. Aguirre, None

Figures

Figure 1.
Figure 1.
Example horizontal line scans. Three images (top row) each covering 30 degrees of retina were acquired for each eye for each subject and then montaged together into a single image (bottom row, left). The relative scales of the montaged scans are shown overlaid on a color fundus photograph from the same subject (bottom row, right). The GCL and IPL in each montaged image were manually labeled. The borders (shown as yellow, green, and red) defined by these labels were smoothed with a spline.
Figure 2.
Figure 2.
Relationship among GCL thickness, volume, and axial length. (a) GCL thickness profiles for 50 subjects (red) and the population mean (black), extending from –25 degrees (temporal) to 25 degrees (nasal). (b) The relationship between axial length and the mean GCL thickness from each participant. (c) The calculated retinal surface area (in mm2) that subtends a square degree of visual angle as a function of horizontal position on the retina. The function varies across subjects (red) primarily due to differences in axial length. The population mean is shown in black. (d) Rendering of the model eyes generated for the participants with the shortest and longest axial length. The dotted circles subtend 30 degrees diameter of the visual field in each eye around the visual axis (red line). Illustrated inset is a patch of retina from these two eyes that each have a diameter of 30 degrees, have the same tissue volume, and correspondingly have different thickness. (e) The volume of GCL tissue per square degree of visual angle as a function of retinal eccentricity for the 50 participants (red) and the population mean (black). (f) The relationship between axial length and the mean GCL tissue volume per square degree across eccentricity from each participant.
Figure 3.
Figure 3.
The first six principal components derived from an analysis of GCL tissue volume profiles across the 50 participants. The initial (gray) components were smoothed (red) to reduce the influence of noisy regions of the measurement.
Figure 4.
Figure 4.
Original (gray) and reconstructed (red) GCL tissue volume profiles for the first 49 participants, using the first 6 smoothed principle components, demonstrating the accuracy of the low dimensional representation of the data.
Figure 5.
Figure 5.
The influence of axial length on the GCL tissue volume profile, as reflected in each of the first six principal components. Each plot shows how one of the principal components varies with axial length from myopic (blue, 27.57 mm), to emmetropic (green, 23.58 mm), to hyperopic (red, 21.79 mm).
Figure 6.
Figure 6.
(a) GCL tissue volume profiles for the 50 subjects after removing the effect of axial length by projecting each profile to the emmetropic eye. (b) The relationship between axial length and the mean GCL tissue volume per square degree across eccentricity from each participant following correction for variation in axial length.
Figure 7.
Figure 7.
Relation of modeled GCL tissue volume to optic chiasm volume. Optic chiasm volume was measured from an anatomic MRI image in each of forty participants (example coronal MRI image inset; optic chiasm indicated in red). The optic chiasm volume (y-axis) for each participant was related to individual variation in measured GCL tissue volume (x-axis). Variation in GCL tissue volume was modeled as the weighted and combined influence of measured mean GCL tissue volume, with and without adjustment for the effects of variation in axial length. The best fit line (with 95% confidence intervals) of the model is shown.
Figure 8.
Figure 8.
The retinal ganglion cell layer considered in different coordinate frames. The profile of the GCL along the horizontal meridian is modeled for eyes of varying axial lengths (myope 27.57 mm; emmetrope 23.58 mm; and hyperope 21.79 mm). This same set of profiles is plotted for three different choices of unit and coordinate frames. (a) GCL tissue volume per square degree of visual angle as a function of eccentricity in degrees of visual angle; (b) GCL thickness in mm as a function of eccentricity in degrees of visual angle; (c) GCL thickness in mm as a function of eccentricity in mm of retina. For the last of these, the extent of the plotted functions along the x-axis varies with eye size.

References

    1. Atchison DA, Jones CE, Schmid KL, et al. Eye shape in emmetropia and myopia. InvestOphthalmolVisSci. 2004; 45(10): 3380–3386. - PubMed
    1. Jonas JB, Xu L, Wei WB, et al. Retinal thickness and axial length. InvestOphthalmolVisSci. 2016; 57(4): 1791–1797. - PubMed
    1. Takeyama A, Kita Y, Kita R, Tomita G. Influence of axial length on ganglion cell complex (GCC) thickness and on GCC thickness to retinal thickness ratios in young adults. JpnJOphthalmol. 2014; 58(1): 86–93. - PubMed
    1. Curcio CA, Allen KA. Topography of ganglion cells in human retina. JCompNeurol. 1990; 300(1): 5–25. - PubMed
    1. Dacey DM. The mosaic of midget ganglion cells in the human retina. JNeurosci. 1993; 13(12): 5334–5355. - PMC - PubMed

Publication types