. 2020 Dec 2:8:e10320.
doi: 10.7717/peerj.10320. eCollection 2020.

Identification of a six-gene metabolic signature predicting overall survival for patients with lung adenocarcinoma

Affiliations

Identification of a six-gene metabolic signature predicting overall survival for patients with lung adenocarcinoma

Yubo Cao et al. PeerJ. .

Abstract

Background: Lung cancer is the leading cause of cancer-related deaths worldwide. Lung adenocarcinoma (LUAD) is one of the main subtypes of lung cancer. Hundreds of metabolic genes are altered consistently in LUAD; however, their prognostic role remains to be explored. This study aimed to establish a molecular signature that can predict the prognosis in patients with LUAD based on metabolic gene expression.

Methods: The transcriptome expression profiles and corresponding clinical information of LUAD were obtained from The Cancer Genome Atlas and Gene Expression Omnibus databases. The differentially expressed genes (DEGs) between LUAD and paired non-tumor samples were identified by the Wilcoxon rank sum test. Univariate Cox regression analysis and the lasso Cox regression model were used to construct the best-prognosis molecular signature. A nomogram was established comprising the prognostic model for predicting overall survival. To validate the prognostic ability of the molecular signature and the nomogram, the Kaplan-Meier survival analysis, Cox proportional hazards model, and receiver operating characteristic analysis were used.

Results: The six-gene molecular signature (PFKP, PKM, TPI1, LDHA, PTGES, and TYMS) from the DEGs was constructed to predict the prognosis. The molecular signature demonstrated a robust independent prognostic ability in the training and validation sets. The nomogram including the prognostic model had a greater predictive accuracy than previous systems. Furthermore, a gene set enrichment analysis revealed several significantly enriched metabolic pathways, which suggests a correlation of the molecular signature with metabolic systems and may help explain the underlying mechanisms.

Conclusions: Our study identified a novel six-gene metabolic signature for LUAD prognosis prediction. The molecular signature could reflect the dysregulated metabolic microenvironment, provide potential biomarkers for predicting prognosis, and indicate potential novel metabolic molecular-targeted therapies.

Keywords: GEO; Lung adenocarcinoma; Metabolic signature; Overall survival; Prognostic model; TCGA.


Conflict of interest statement

The authors declare there are no competing interests.

Figures

Figure 1
Figure 1. Overall flowchart of steps used in the construction of the prognostic metabolic gene signature.
The TCGA dataset was utilized to construct the prognostic metabolic gene signature. The TCGA clinical information, the GSE68465 dataset and online databases from international platforms were further utilized to validate the prognostic model. TCGA, The Cancer Genome Atlas; OS, overall survival; ROC, the receiver operating characteristic.
Figure 2
Figure 2. Heatmap and Volcano plot of metabolism-related DEGs.
(A) The heatmap of metabolism-related DEGs. The red color represented high expression genes, the blue color represented low expression genes, and the white color represented the expression genes with no significant difference (FDR < 0.05, absolute log FC > 1). (B) Volcano plot of metabolism-related DEGs. The pink, blue and black dots represented the high expression genes, low expression genes, and the expression genes with no significant difference (FDR < 0.05, absolute log FC > 1). DEGs, differentially expressed genes; FDR, false discovery rate.
Figure 3
Figure 3. Identification of the prognostic model in lung adenocarcinoma.
(A, B) Kaplan–Meier curves of overall survival of the high-risk and low-risk groups stratified by the six-gene signature- based risk score in the TCGA or GEO dataset. (C, D) Risk score distribution, survival status distribution in the TCGA or GEO dataset. (E, F) The expression heatmap of the six prognostic genes in the TCGA or GEO dataset. (G, H) Time-dependent ROC curves of the six-gene signature in the TCGA or GEO dataset. TCGA, The Cancer Genome Atlas; GEO, Gene Expression Omnibus; ROC, receiver operating characteristic.
Figure 4
Figure 4. Cox regression analysis of the associations between the prognostic model and clinicopathological characteristics with overall survival in LAUD.
Univariate and multivariate Cox regression analyses in the TCGA dataset (A) and GEO dataset (B). LUAD, lung adenocarcinoma; TCGA, The Cancer Genome Atlas; GEO, Gene Expression Omnibus.
Figure 5
Figure 5. The time-dependent receiver operating characteristic (ROC) analysis for the prognostic model and clinicopathological characteristics in LAUD.
(A) The time-dependent ROC curves of risk score, age, gender, TNM stage, T stage, N stage, and M stage in the TCGA dataset. (B) The time-dependent ROC curves of risk score, age, gender, grade, T stage, and N stage in the GEO dataset. LUAD, lung adenocarcinoma.
Figure 6
Figure 6. Construction and validation of a nomogram for survival prediction in LUAD from the TCGA dataset.
(A) The nomogram was built in the TCGA dataset. (B) Calibration plots revealed the nomogram-predicted survival probabilities. (C) The time-dependent ROC analysis evaluated the accuracy of the nomogram. TCGA, The Cancer Genome Atlas; ROC, receiver operating characteristic; LUAD, lung adenocarcinoma.
Figure 7
Figure 7. The representative enriched metabolism-related KEGG pathways in the TCGA dataset by GSEA.
(A) The top five significantly representative enriched metabolism-related KEGG pathways in the high-risk group. (B) The top five significantly representative enriched metabolism-related KEGG pathways in the low-risk group. Related parameters for the ten representative enriched metabolism-related KEGG pathways are given in Table 3. GSEA, Gene Set Enrichment Analysis; KEGG, Kyoto Encyclopedia of Genes and Genomes; TCGA, The Cancer Genome Atlas.
Figure 8
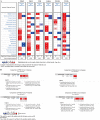
Figure 8. mRNA expression levels of the six prognostic genes from online databases.
(A) mRNA expression levels of the six genes in the Oncomine database (http://www.oncomine.org/). The threshold is shown at the bottom (P value < 0.001 and fold change > 2 were utilized for screening). The figure in the colored cell represents the number of datasets complying with the threshold. The red cells indicate that the genes were overexpressed in the cancer, while the blue cells indicate that the genes were overexpressed in the normal tissues. (B) Comparisons of the mRNA expression levels of the six genes between LUAD and normal tissues in the combined LUAD datasets from the Oncomine database. PFKP, phosphofructokinase platelet; PKM, pyruvate kinase muscle; TPI1, triosephosphate isomerase 1; LDHA, lactate dehydrogenase A; PTGES, prostaglandin E synthase; TYMS, thymidylate synthase; LUAD, lung adenocarcinoma.
Figure 9
Figure 9. mRNA expression levels of the six prognostic genes extracted from online database.
The mRNA expression levels of the six genes in different tumour types from the TIMER database (http://cistrome.shinyapps.io/timer/) (*P < 0.05, **P < 0.01, ***P < 0.001). PFKP, phosphofructokinase platelet; PKM, pyruvate kinase muscle; TPI1, triosephosphate isomerase 1; LDHA, lactate dehydrogenase A; PTGES, prostaglandin E synthase; TYMS, thymidylate synthase.
Figure 10
Figure 10. Protein expression levels and genetic alterations of the corresponding six prognostic genes obtained from online databases.
(A) The representative immunohistochemistry images of the protein expression of the six genes in the normal lung tissues and LUAD tissues from the Human Protein Atlas database (http://www.proteinatlas.org/). (B) The percentage of protein expression levels in the normal lung tissues and LUAD tissues analysed based on the Human Protein Atlas database. Anti-PFKP antibody is HPA018257; anti-PKM antibody is CAB019421; anti-TPI1 antibody is HPA053568; anti-LDHA antibody is CAB069404; anti-PTGES is HPA045064; anti-TYMS antibody is CAB002784. (C) Genetic alterations of the six genes in 230 LUAD patients / samples (TCGA, Firehose Legacy). Data were obtained from the cBioportal for Cancer Genomics (http://www.cbioportal.org/). PFKP, phosphofructokinase platelet; PKM, pyruvate kinase muscle; TPI1, triosephosphate isomerase 1; LDHA, lactate dehydrogenase A; PTGES, prostaglandin E synthase; TYMS, thymidylate synthase; TCGA, The Cancer Genome Atlas; LUAD, lung adenocarcinoma.

Similar articles

Cited by

References

    1. Applebaum MA, Jha AR, Kao C, Hernandez KM, DeWane G, Salwen HR, Chlenski A, Dobratic M, Mariani CJ, Godley LA, Prabhakar N, White K, Stranger BE, Cohn SL. Integrative genomics reveals hypoxia inducible genes that are associated with a poor prognosis in neuroblastoma patients. Oncotarget. 2016;7(47):76816–76826. doi: 10.18632/oncotarget.12713. - DOI - PMC - PubMed
    1. Asavasupreechar T, Chan M, Saito R, Miki Y, Boonyaratanakornkit V, Sasano H. Sex steroid metabolism and actions in non-small cell lung carcinoma. The Journal of Steroid Biochemistry and Molecular Biology. 2019;193:105440. doi: 10.1016/j.jsbmb.2019.105440. - DOI - PubMed
    1. Beer DG, Kardia SL, Huang CC, Giordano TJ, Levin AM, Misek DE, Lin L, Chen G, Gharib TG, Thomas DG, Lizyness ML, Kuick R, Hayasaka S, Taylor JM, Iannettoni MD, Orringer MB, Hanash S. Gene-expression profiles predict survival of patients with lung adenocarcinoma. Nature Medicine. 2002;8(8):816–824. doi: 10.1038/nm733. - DOI - PubMed
    1. Bjerre MT, Strand SH, Nørgaard M, Kristensen H, Rasmussen AK, Mortensen MM, Fredsøe J, Mouritzen P, Ulhøi B, Ørntoft T, Borre M, Sørensen KD. Aberrant DOCK2, GRASP, HIF3A and PKFP hypermethylation has potential as a prognostic biomarker for prostate cancer. International Journal of Molecular Sciences. 2019;20(5):1173. doi: 10.3390/ijms20051173. - DOI - PMC - PubMed
    1. Bray F, Ferlay J, Soerjomataram I, Siegel RL, Torre LA, Jemal A. Global cancer statistics 2018: GLOBOCAN estimates of incidence and mortality worldwide for 36 cancers in 185 countries. CA: a Cancer Journal for Clinicians. 2018;68(6):394–424. doi: 10.3322/caac.21492. - DOI - PubMed

LinkOut - more resources