. 2020 Nov 13;7(24):2003036.
doi: 10.1002/advs.202003036. eCollection 2020 Dec.

Theranostic Nanomedicine for Synergistic Chemodynamic Therapy and Chemotherapy of Orthotopic Glioma

Affiliations

Theranostic Nanomedicine for Synergistic Chemodynamic Therapy and Chemotherapy of Orthotopic Glioma

Junyi Tan et al. Adv Sci (Weinh). .

Abstract

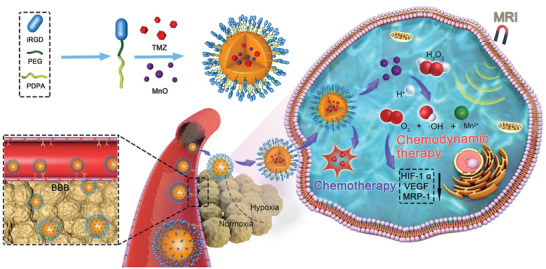
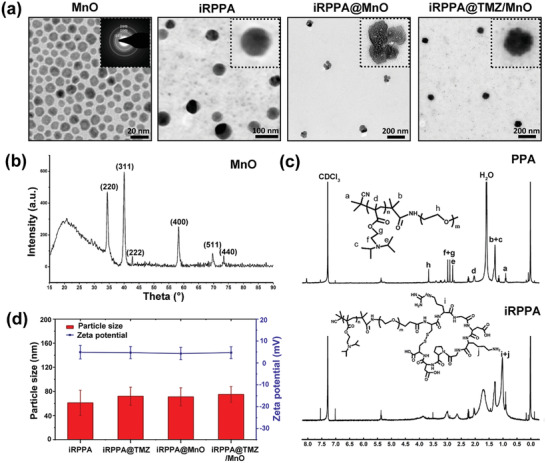
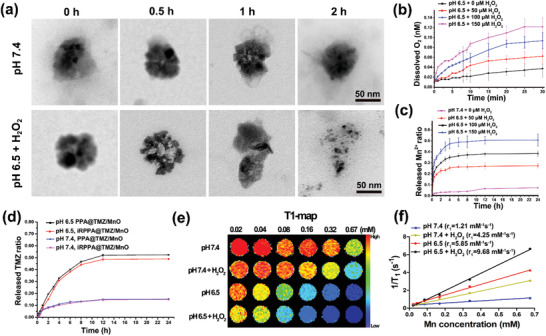
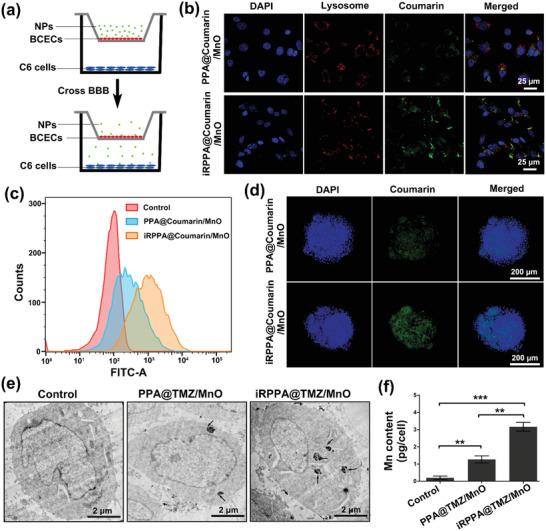
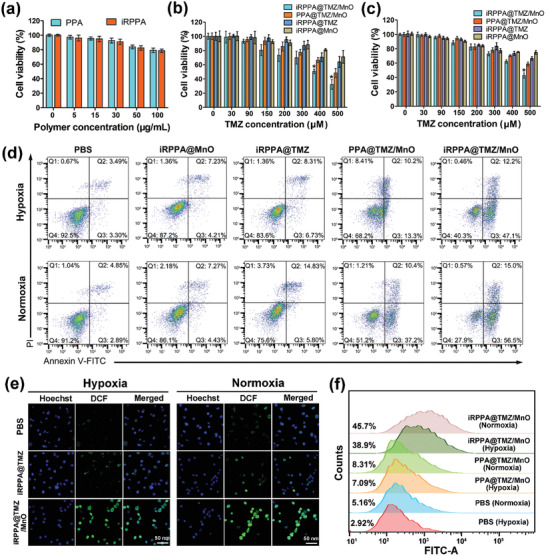
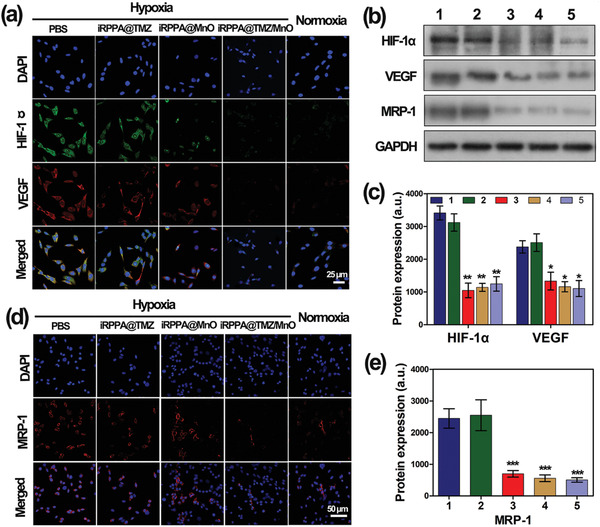
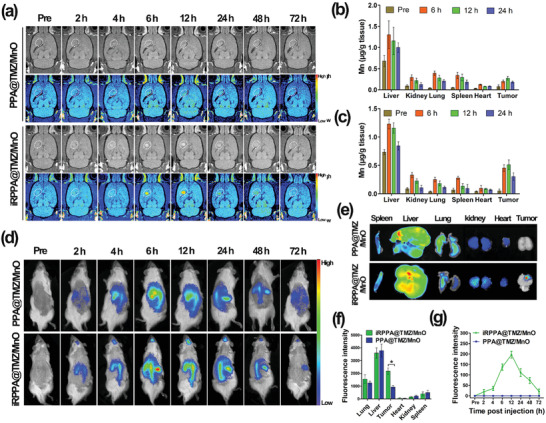
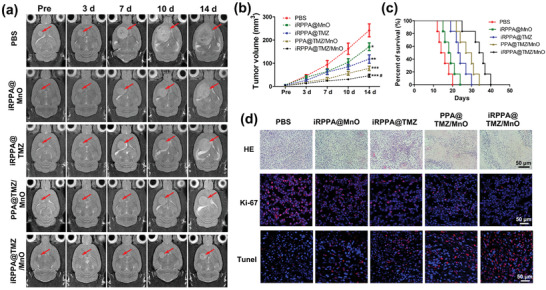
Glioma is a common primary brain malignancy with a poor prognosis. Chemotherapy is the first-line treatment for brain tumors but low efficiency of drugs in crossing the blood-brain barrier (BBB) and drug resistance related to tumor hypoxia thwart its efficacy. Herein, a theranostic nanodrug (iRPPA@TMZ/MnO) is developed by incorporating oleic acid-modified manganese oxide (MnO) and temozolomide (TMZ) into a polyethylene glycol-poly(2-(diisopropylamino)ethyl methacrylate-based polymeric micelle containing internalizing arginine-glycine-aspartic acid (iRGD). The presence of iRGD provides the nanodrug with a high capacity of crossing the BBB and penetrating the tumor tissue. After accumulation in glioma, the nanodrug responds to the tumor microenvironment to simultaneously release TMZ, Mn2+, and O2. The released TMZ induces tumor cell apoptosis and the released Mn2+ causes intracellular oxidative stress that kill tumor cells via a Fenton-like reaction. The O2 produced in situ alleviates tumor hypoxia and enhances the chemotherapy/chemodynamic therapeutic effects against glioma. The Mn2+ can also serve as a magnetic resonance imaging (MRI) contrast agent for tumor imaging during therapy. The study demonstrates the great potential of this multifunctional nanodrug for MRI-visible therapy of brain glioma.

Keywords: chemodynamic therapy; chemotherapy; glioma; magnetic resonance imaging; tumor microenvironment.


Conflict of interest statement

The authors declare no conflict of interest.

Figures

Scheme 1
Scheme 1
Schematic illustrations of iRPPA@TMZ/MnO for MRI‐guided synergistic chemotherapy/CDT against brain glioma.
Figure 1
Figure 1
Characterizations of polymer and theranostic nanodrugs. a) TEM images of MnO, iRGD‐PEG‐PDPA (iRPPA), iRPPA@MnO, and iRPPA@TMZ/MnO. b) XRD pattern of MnO. c)1H NMR spectra of PEG‐PDPA (PPA) and iRPPA. d) Hydrodynamic diameters and zeta potentials of iRPPA, iRPPA@TMZ, iRPPA@MnO, and iRPPA@TMZ/MnO characterized by DLS.
Figure 2
Figure 2
In vitro TME‐responsive properties of nanodrugs. a) Serial TEM images show the decomposition process of iRPPA@TMZ/MnO at pH 7.4 or pH 6.5 + 100 × 10−6 mH2O2. b) Oxygen generation by iRPPA@TMZ/MnO at pH 6.5 + 0 – 150 × 10−6 mH2O2(n= 3). c) Mn2+produced from iRPPA@TMZ/MnO at pH 7.4 without H2O2, pH 6.5 + 50 – 150 × 10−6 mH2O2(n= 3). d) TME‐responsive drug release profiles of PPA@TMZ/MnO and iRPPA@TMZ/MnO at pH 6.5 and pH 7.4 measured by HPLC (n= 3). e) In vitro MRI T1‐map of iRPPA@TMZ/MnO at different stimulations. f) Ther 1relaxivities of iRPPA@TMZ/MnO at different stimulations.
Figure 3
Figure 3
In vitro BBB‐penetrating ability and cellular uptake of nanodrugs. a) An illustration of the in vitro two‐compartment BBB model. b) CLSM and c) quantitative flow cytometric analysis showing the uptake of nanodrugs by C6 glioma cells in the bottom well after incubation with PPA@coumarin/MnO and iRPPA@coumarin/MnO. d) CLSM showing the in vitro penetrating effect of PPA@coumarin/MnO and iRPPA@coumarin/MnO on C6 glioma cell spheroids. e) Representative cellular TEM images of C6 glioma cells treated with PBS, PPA@TMZ/MnO, and iRPPA@TMZ/MnO. Black arrows indicate the uptake of nanoparticle clusters. f) The graph shows the intracellular manganese contents of C6 glioma cells after incubation with PBS, PPA@TMZ/MnO, and iRPPA@TMZ/MnO, determined by AAS. Data are expressed as mean ± SD (n= 3). **p< 0.01; ***p< 0.001.
Figure 4
Figure 4
In vitro cytotoxicity and ROS generation. a) Cell viabilities of BCECs incubated with PPA and iRPPA at different concentrations (n= 6). Viabilities of C6 glioma cells after 24 h of incubation with different nanodrugs under the b) normoxic or c) hypoxic conditions. Data are expressed as mean ± SD (n= 6). *p< 0.05. d) Cell apoptosis detected by flow cytometry at 24 h after various cell incubations under the hypoxic or normoxic condition. e) In vitro cellular ROS generation of different nanodrugs under hypoxic or normoxic conditions. f) Quantitative flow cytometry analysis of the DCF fluorescence in C6 cells after different treatments under hypoxic or normoxic conditions.
Figure 5
Figure 5
In vitro fluorescence expression of hypoxia‐related and drug resistance‐related biomarkers. a) Representative CLSM images showing HIF‐1αand VEGF expressions in C6 cells after different treatments under hypoxic or normoxic conditions. b) Western blot analysis showing protein expression of HIF‐1α, VEGF, and MRP‐1 in C6 cells after different treatments under hypoxic or normoxic conditions. c) Quantification of protein expression levels of HIF‐1αand VEGF using Western blot analysis. d) Representative CLSM images of MRP‐1 expression in C6 cells after different treatments under hypoxic and normoxic conditions. e) Quantification of protein expression levels of MRP‐1 using Western blot analysis. 1) PBS under hypoxic condition; 2) iRPPA@TMZ under hypoxic condition; 3) iRPPA@MnO under hypoxic condition; 4) PPA@TMZ/MnO under hypoxic condition; and 5) control cells under normoxic condition. Data are expressed as mean ± SD (n= 3). *p< 0.05; **p< 0.01; ***p< 0.001.
Figure 6
Figure 6
In vivo distribution of nanodrug. a) In vivo serial T1WI MRI images of the intracranial orthotopic glioma before and after intravenous injection of PPA@TMZ/MnO and iRPPA@TMZ/MnO (dose: 5 mg Mn kg−1). Mn accumulation in tumor and major organs before and after intravenous injection of b) iRPPA@TMZ/MnO and c) PPA@TMZ/MnO detected by ICP‐MS (n= 3). d) In vivo fluorescence imaging of C6 tumor‐bearing rats after intravenous injection of PPA@DiR/MnO and iRPPA@DiR/MnO at different time points. e) Ex vivo fluorescence imaging of the major organs and tumor at 72 h after nanodrug injection. f) Relative fluorescence intensities of the ex vivo major organs and tumor at 72 h after nanodrug injection. Data are expressed as mean ± SD (n= 3). *p< 0.05. g) Dynamic changes of fluorescence intensity in tumor against time after injection of PPA@DiR/MnO and iRPPA@DiR/MnO. Data are expressed as mean ± SD (n= 3).
Figure 7
Figure 7
In vivo synergistic antitumor effects in orthotopic glioma‐bearing rats. a) Serial T2WI MRI images of orthotopic glioma (red arrows) within 14 days after treatment with PBS, iRPPA@MnO, iRPPA@TMZ, PPA@TMZ/MnO, and iRPPA@TMZ/MnO. Data are expressed as mean ± SD (n= 6), *p< 0.05; **p< 0.01; ***p< 0.001 versus PBS group,# p< 0.05 for iRPPA@TMZ/MnO group versus other nanodrug groups. b) Tumor volumes of orthotopic glioma for each group of tumor‐bearing rats. c) Survival rates of orthotopic glioma‐bearing rats (n= 6). d) In vivo HE, Ki‐67, and TUNEL analyses of orthotopic glioma at 14 days after different treatments for each group.
Figure 8
Figure 8
In vivo biosafety, alleviation of tumor hypoxia, and inhibition of MRP‐1 expression. a) Images of major organs stained by H&E in each group receiving different treatments. b) ALT and AST blood biochemistry tests for liver function assessment in tumor‐bearing rats in each group (n= 3). c) CR and BUN blood biochemical analysis for the renal function assessment for each group of tumor‐bearing rats (n= 3). In vivo expressions of d) HIF‐1αand VEGF and e) MRP‐1 in tumor tissues of glioma‐bearing rats observed on CLSM. f) HIF‐1α, VEGF, and MRP‐1 protein expression in tumor tissues of glioma‐bearing rats analyzed by Western blot analysis. e) Quantification of protein expression levels of HIF‐1α, VEGF, and MRP‐1 based on Western blot analysis in tumor tissues. Data are expressed as mean ± SD (n= 3). 1) PBS; 2) iRPPA@TMZ; 3) iRPPA@MnO; 4) PPA@TMZ/MnO; and 5) iRPPA@TMZ/MnO.

References

    1. Lapointe S., Perry A., Butowski N. A., Lancet 2018, 392, 432. - PubMed
    1. a) Sanai N., Berger M. S., Nat. Rev. Clin. Oncol. 2018, 15, 112; - PubMed
    2. b) Shergalis A., Bankhead A., Luesakul U., Muangsin N., Neamati N., Pharmacol. Rev. 2018, 70, 412. - PMC - PubMed
    1. a) Lim M., Xia Y., Bettegowda C., Weller M., Nat. Rev. Clin. Oncol. 2018, 15, 422; - PubMed
    2. b) Lee C. Y., OncoTargets Ther. 2017, 10, 265. - PMC - PubMed
    1. Rankin E. B., Giaccia A. J., Science 2016, 352, 175. - PMC - PubMed
    1. Ge X., Pan M. H., Wang L., Li W., Jiang C., He J., Abouzid K., Liu L. Z., Shi Z., Jiang B. H., Cell Death Dis. 2018, 9, 1128. - PMC - PubMed

LinkOut - more resources