. 2020 Dec 4:10:584477.
doi: 10.3389/fonc.2020.584477. eCollection 2020.

Iron Supplementation Interferes With Immune Therapy of Murine Mammary Carcinoma by Inhibiting Anti-Tumor T Cell Function

Affiliations

Iron Supplementation Interferes With Immune Therapy of Murine Mammary Carcinoma by Inhibiting Anti-Tumor T Cell Function

Piotr Tymoszuk et al. Front Oncol. .

Abstract

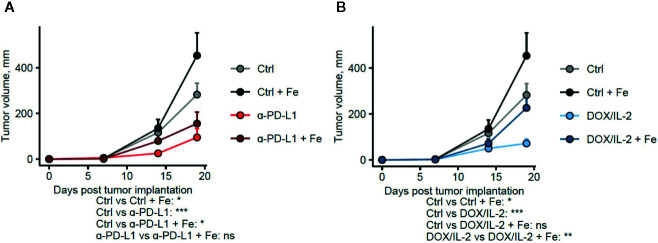
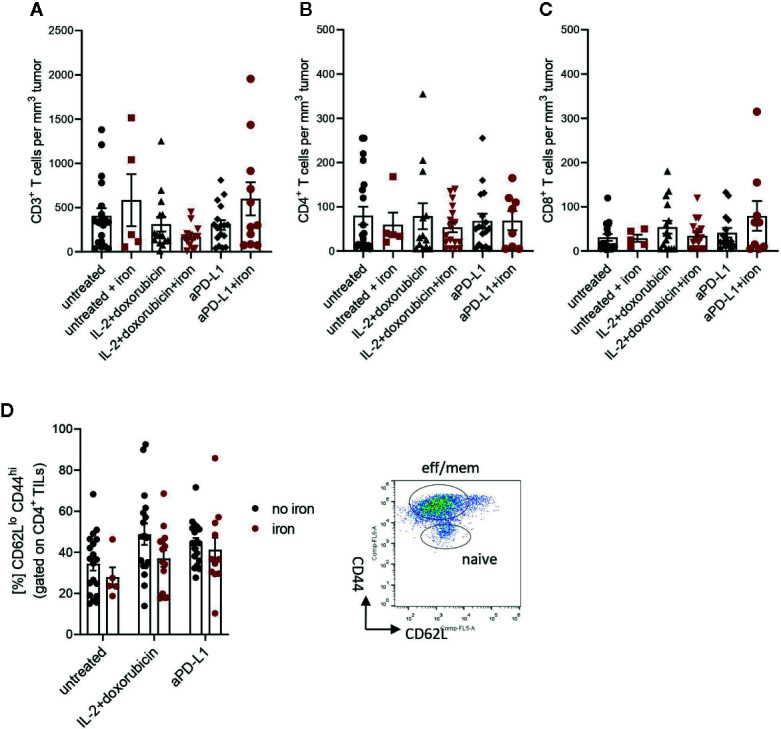
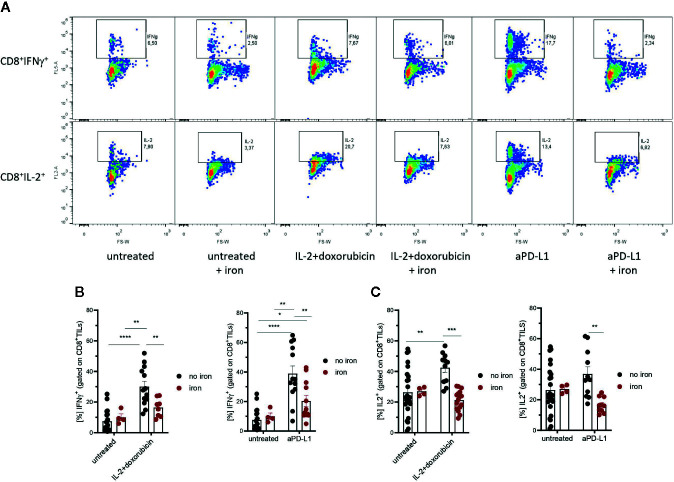
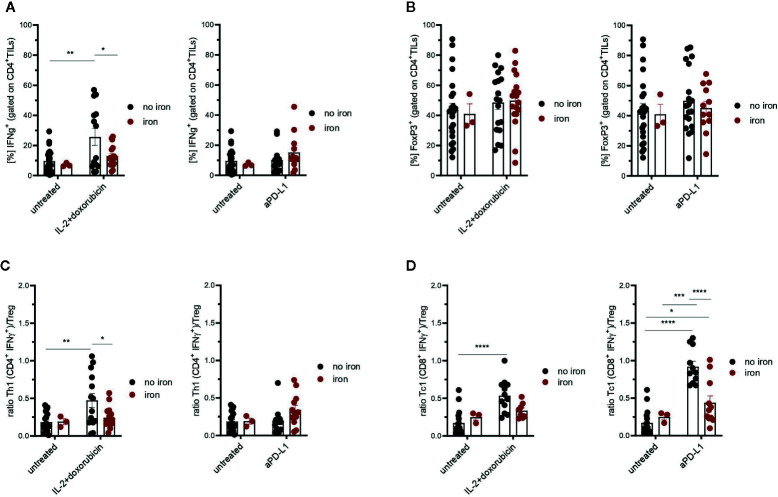
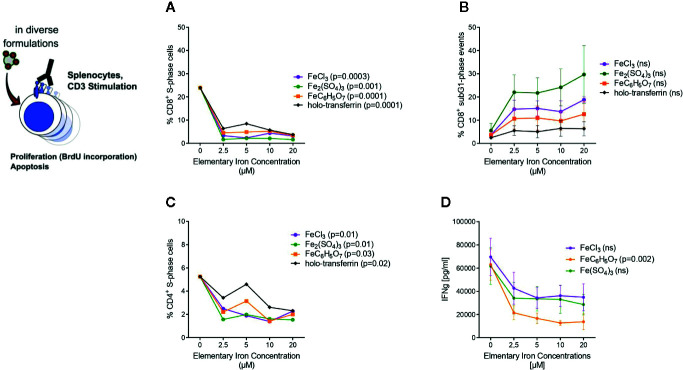
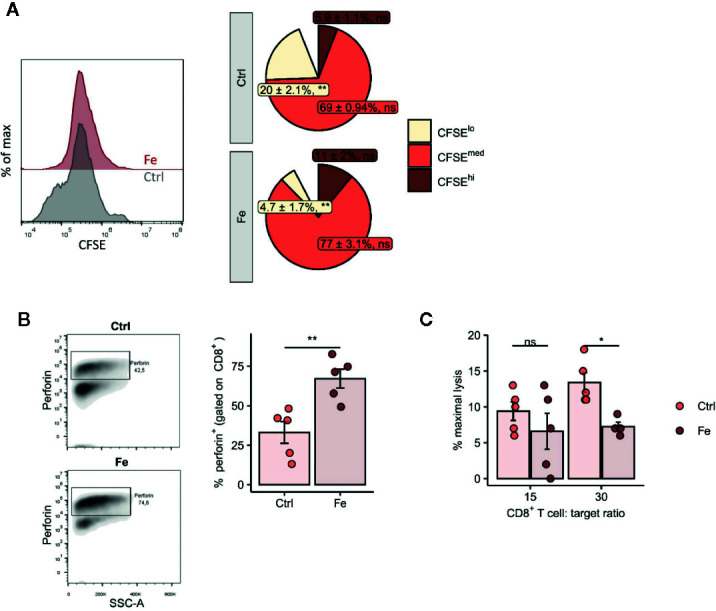
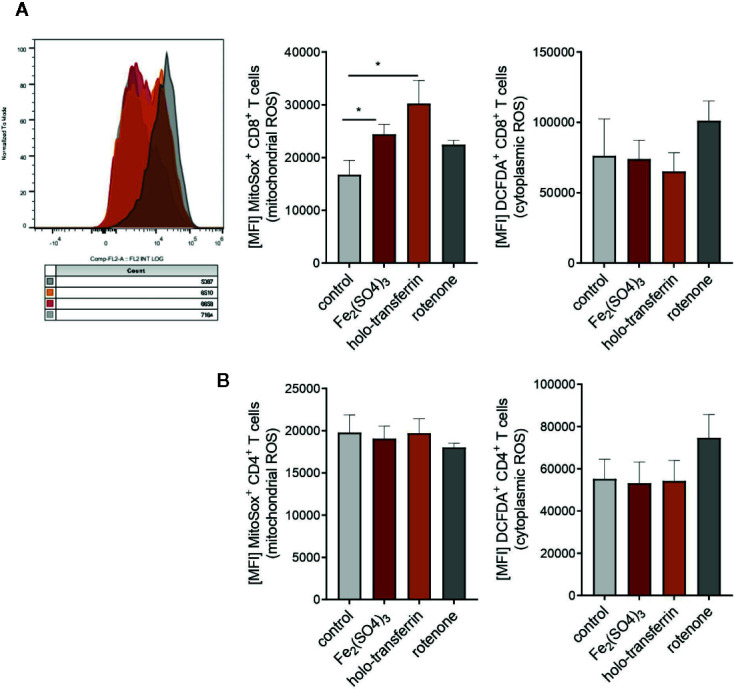
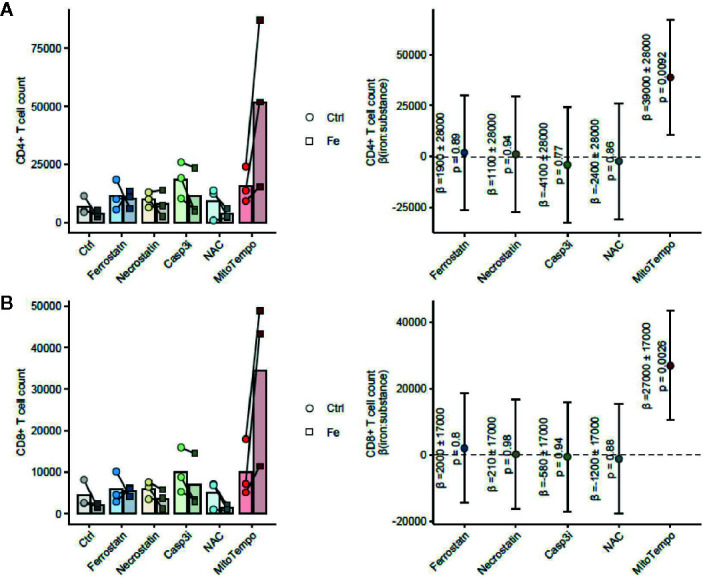
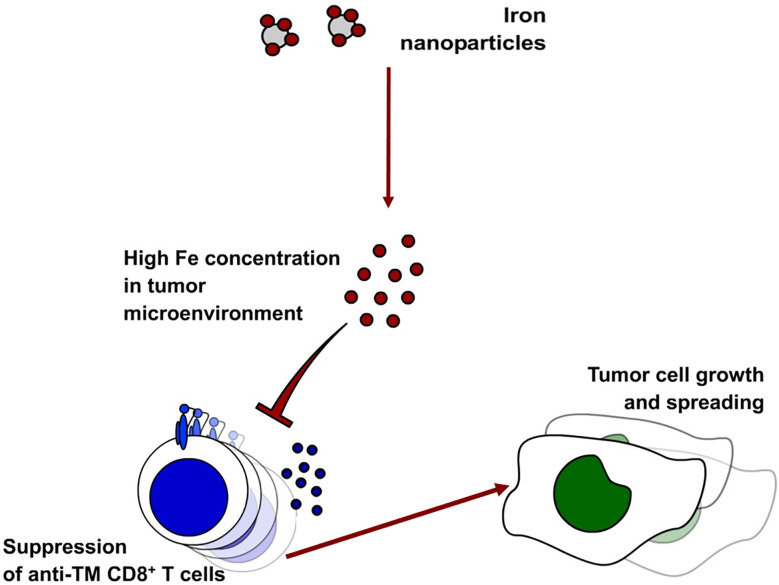
Iron is both, an essential compound for many metabolic processes, and iron deficiency can impact on the proliferation of cells including lymphocytes but also tumor cells. On the other hand, excess iron-catalyzed radical formation can induce cellular toxicity which has been previously demonstrated for T cells in hereditary iron overload. Despite these interconnections, little is known on the effects of clinically approved intravenous iron supplements for curing cancer-related anemia, on T cell differentiation, tumor proliferation, anti-tumor T cell responses and, of clinical importance, on efficacy of cancer immunotherapies. Herein, we analyzed the effects of intravenous iron supplementation on T cell function and on the effectiveness of anti-cancer chemotherapy with IL-2/doxorubicin or immunotherapy with checkpoint-inhibitor anti-PD-L1 in C57Bl/6N female mice with implanted E0771 mammary carcinomas. We found that iron application resulted to an increased availability of iron in the tumor microenvironment and stimulation of tumor growth. In parallel, iron application inhibited the activation, expansion and survival of cytotoxic CD8+ T cells and of CD4+ T helper cells type 1 and significantly reduced the efficacy of the investigated anti-cancer treatments. Our results indicate that iron administration has a tumor growth promoting effect and impairs anti-cancer responses of tumor infiltrating T lymphocytes along with a reduced efficacy of anti-cancer therapies. Iron supplementation in cancer patients, especially in those treated with immunotherapies in a curative setting, may be thus used cautiously and prospective studies have to clarify the impact of such intervention on the outcome of patients.

Keywords: T cell; cancer prognosis; immune checkpoint; immunotherapy; iron; mammary carcinoma.


Conflict of interest statement

The authors declare that the research was conducted in the absence of any commercial or financial relationships that could be construed as a potential conflict of interest.

Figures

Figure 1
Figure 1
Administration of iron negatively influences the efficacy of different immunotherapies. Female C57Bl/6 mice were subcutaneously implanted with E0771 cells (2.5 × 10⁵ cells per animal), supplemented with intravenous iron isomaltoside (Fe, 2 mg elementary iron per animal) 3 days after tumor implantation and treated with anti-PD-L1 (A) or IL-2 and doxorubicin (B) as described in Materials and Methods. Therapy-naive: n = 17, therapy-naive/iron: n = 5, anti-PD-L1: n = 14, anti-PD-L1/iron: n = 17, IL-2/doxorubicin: n = 13, IL-2/doxorubicin/iron: n = 14. Tumor volume was determined weekly by caliper measurements. Statistical significance was determined by mixed-effect multiple linear regression (fixed effects: time point and time point: treatment group interaction, random effect: individual animal). Group means with SEM are presented. P values were corrected for multiple comparisons with Benjamini–Hochberg method. P values for differences in growth rate between the untreated control and the given group and for the differences in growth rate between the immunotherapy and immunotherapy/iron groups (the time point: treatment group interaction term estimates) are presented under the plots. ns: not significant, *p < 0.05, **p < 0.01, ***p < 0.001.
Figure 2
Figure 2
Administration of intravenous iron has no influence on the numbers of effector CD3+ (A), CD4+ (B), CD8+ (C) and effector-memory (D) tumor infiltrating lymphocytes in different immunotherapeutic settings. Naive TILs were identified as CD62LhiCD44lo, effector-memory TILs were described as CD62LloCD44hi in tumors 21 days post implantation. Mean with SEM is presented in the plots. Statistical significance was determined by 2-way ANOVA. untreated n = 20, untreated + iron n = 5, IL-2 + doxorubicin n = 15, IL-2 + doxorubicin + iron n = 14, aPD-L1 n = 17, aPD-L1 + iron n = 11. The results of ANOVA are presented in Materials and Methods/Specific statistical data analysed in main figures.
Figure 3
Figure 3
Effects of intravenous iron on functional T cell subsets. Intravenous iron supplementation significantly reduces the function of CD8+ tumor infiltrating lymphocytes (AC). Representative plots are shown (mean ± SEM). Statistical significance was determined by 2-way ANOVA. The results of Tuckey post-hoc-test are presented in the plots: ns: not significant, *p < 0.05, ** p < 0.01, ***p < 0.001, ****p < 0.0001. untreated n = 20, untreated + iron n = 4, IL-2 + doxorubicin n = 13, IL-2 + doxorubicin + iron n = 8, aPD-L1 n = 13, aPD-L1 + iron n = 12. The results of ANOVA are presented in Materials and Methods/Specific statistical data analyzed in main figures.
Figure 4
Figure 4
Effects of intravenous iron on CD4+ TILs (A), regulatory T cells (B) and Th1/Treg or Tc1/Treg ratios (C, D) in immunotherapy and chemoimmunotherapy of mouse mammary carcinomas. Ratios Th1/Treg (C) and Tc1/Treg (D) were calculated. Representative plots are shown (mean ± SEM). Statistical significance was determined by 2-way ANOVA. The results of Tuckey post-hoc-test are presented in the plots: ns: not significant, *p < 0.05, **p < 0.01, ***p < 0.001, ****p < 0.0001. untreated n = 24, untreated + iron n = 3, IL-2 + doxorubicin n = 14, IL-2 + doxorubicin + iron n = 17, aPD-L1 n = 13, aPD-L1 + iron n = 12. The results of ANOVA are presented in Materials and Methods/Specific statistical data analyzed in main figures.
Figure 5
Figure 5
Transferrin bound and non-transferrin bound iron impairs T cells proliferation and promotes apoptosis. Splenocytes isolated from tumor-naive C57Bl/6N mice were stimulated with plate-bound anti-CD3 antibodies and supplemented with iron in the form of holo-transferrin (transferrin bound iron, TBI), ferric chloride FeCl3, ferric sulfate Fe2(SO4)3, or ferric citrate FeC6H5O7 (non-transferrin bound iron, NTBI). BrdU incorporation and cell cycle distribution in CD4+ and CD8+ T cells was measured by flow cytometry (AC) and IFNγ concentration in culture supernatant was determined by Multiplex 72 h after culture start (D). Statistical significance was assessed by one-way ANOVA for each iron source. Each point represents mean with SEM from n = 3 independent experiments.
Figure 6
Figure 6
In vitro addition of iron to splenocytes decreases the number of proliferating CD8+ T cells (CFSE low) (A), negatively affects perforin degranulation in CD8+ cytotoxic T cells (B) and significantly reduces the CD8+ T cell dependent lysis of target cells (C). (A, B) Splenocytes isolated from tumor-naive C57Bl/6N mice were stimulated with plate-bound anti-CD3 antibodies and iron in form of iron citrate (FeC6H5O7; non-transferrin bound iron, NTBI) was added. Proliferation of CD8+ T cells was measured by flow cytometry depending on CFSE 72h after culture start. Data are presented as Pie Plots (mean ± SEM) n = 4. Perforin was stained intracellularly as described in Materials and Methods n=5. Statistical significance was determined by a two-tailed T-test and corrected for multiple comparisons with the Benjamini–Hochberg method. (C) The capability of iron treated and non-iron treated CD8+ T cells to lyse target cells was measured with a chromium release assay as described in Material and Methods. Representative flow cytometry results and summary plots are shown (mean ± SEM). Statistical significance was determined by 2-way ANOVA. The results of Tuckey post-hoc-test are presented in the plots: ns: not significant, *p < 0.05, **: p < 0.01. control, Fe (ratio 15:1) n = 5, control, Fe (ratio 30:1) n = 4. The results of ANOVA are presented in Materials and Methods/Specific statistical data analyzed in main figures.
Figure 7
Figure 7
Iron administration to splenocytes leads to oxidative stress and increased production of mitochondrial reactive oxygen species (ROS). Splenocytes were isolated from tumor-naive C57Bl/6N female mice and cultured in 96 well plates coated with anti-CD3. Fe2(SO4)3 and holo-transferrin were added as NTBI and TBI, the inhibitor of oxidative phosphorylation rotenone was used as a positive control for ROS formation. After 24h DCFDA+ and MitoSox+ CD8+ T cells (A) and CD4+ T cells (B) were analysed by flow cytometry. DCFDA is defined as indicator for cytoplasmic ROS, MitoSox for mitochondrial ROS. Statistical significance was determined by Student`s t-test. Representative flow cytometry results and summary plots are shown (mean±SEM; n = 3).
Figure 8
Figure 8
The mitochondrial ROS scavenger MitoTempo reverses the iron-mediated inhibition of T cell growth. Splenocytes were isolated from tumor-naive C57Bl/6 mice (n = 3 separate cell donors) and cultured for 72 h in presence of 1 µg/ml activating anti-CD3 antibody and the inhibitors of ferroptosis (Ferrostatin: 1 µM), necroptosis (Necrostatin: 30 µM), apoptosis (Casp3i, z-DEVD-FMK: 20 µM) or cytoplasmic (NAC, N-acetylcysteine, 10 mM) or mitochondrial (MitoTempo, 20 µM) ROS scavengers. CD4+ T cells (A) and CD8+ T cells (B) were enumerated by flow cytometry. Statistical significance for reversal of the iron-mediated inhibition of T cell growth measured as the positive interaction of iron and cell death/ROS inhibitor was assessed by mixed-effect linear regression (fixed effects: iron, cell death/ROS inhibitor and the iron: cell death/ROS inhibitor interaction; random effect: cell donor). Left panels: cell counts are presented as points, lines connect data for the same cell donor; right panels: forest plots showing the regression coefficients (beta) of the iron:cell death/ROS inhibitor interaction as points and 95% confidence intervals as error bars.
Figure 9
Figure 9
Administration of intravenous iron in the form of ferric isomaltose leads to higher iron concentrations in the tumor milieu. This leads to the inhibition of anti-tumor CD8+ T cells.

References

    1. Hentze MW, Muckenthaler MU, Galy B, Camaschella C. Two to tango: regulation of Mammalian iron metabolism. Cell (2010) 142(1):24–38. 10.1016/j.cell.2010.06.028 - DOI - PubMed
    1. Nemeth E, Tuttle MS, Powelson J, Vaughn MB, Donovan A, Ward DM, et al. Hepcidin regulates cellular iron efflux by binding to ferroportin and inducing its internalization. Science (2004) 306(5704):2090–3. 10.1126/science.1104742 - DOI - PubMed
    1. Gkouvatsos K, Papanikolaou G, Pantopoulos K. Regulation of iron transport and the role of transferrin. Biochim Biophys Acta (2012) 1820(3):188–202. 10.1016/j.bbagen.2011.10.013 - DOI - PubMed
    1. Wang S, He X, Wu Q, Jiang L, Chen L, Yu Y, et al. Transferrin receptor 1-mediated iron uptake plays an essential role in hematopoiesis. Haematologica (2019) 105(8):2071–82. 10.3324/haematol.2019.224899 - DOI - PMC - PubMed
    1. Ned RM, Swat W, Andrews NC. Transferrin receptor 1 is differentially required in lymphocyte development. Blood (2003) 102(10):3711–8. 10.1182/blood-2003-04-1086 - DOI - PubMed