

MicroRNA-16-1-3p Represses Breast Tumor Growth and Metastasis by Inhibiting PGK1-Mediated Warburg Effect
- PMID: 33344462
- PMCID: PMC7744604
- DOI: 10.3389/fcell.2020.615154
MicroRNA-16-1-3p Represses Breast Tumor Growth and Metastasis by Inhibiting PGK1-Mediated Warburg Effect
Erratum in
-
Corrigendum: MicroRNA-16-1-3p Represses Breast Tumor Growth and Metastasis by Inhibiting PGK1-Mediated Warburg Effect.Front Cell Dev Biol. 2021 Jan 21;9:649787. doi: 10.3389/fcell.2021.649787. eCollection 2021. Front Cell Dev Biol. 2021. PMID: 33553193 Free PMC article.
Abstract
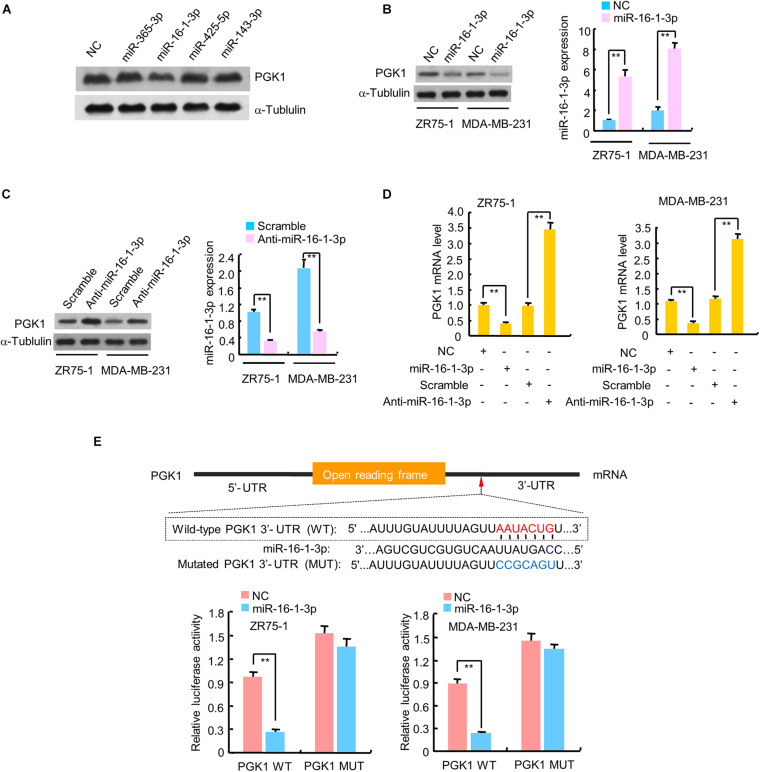
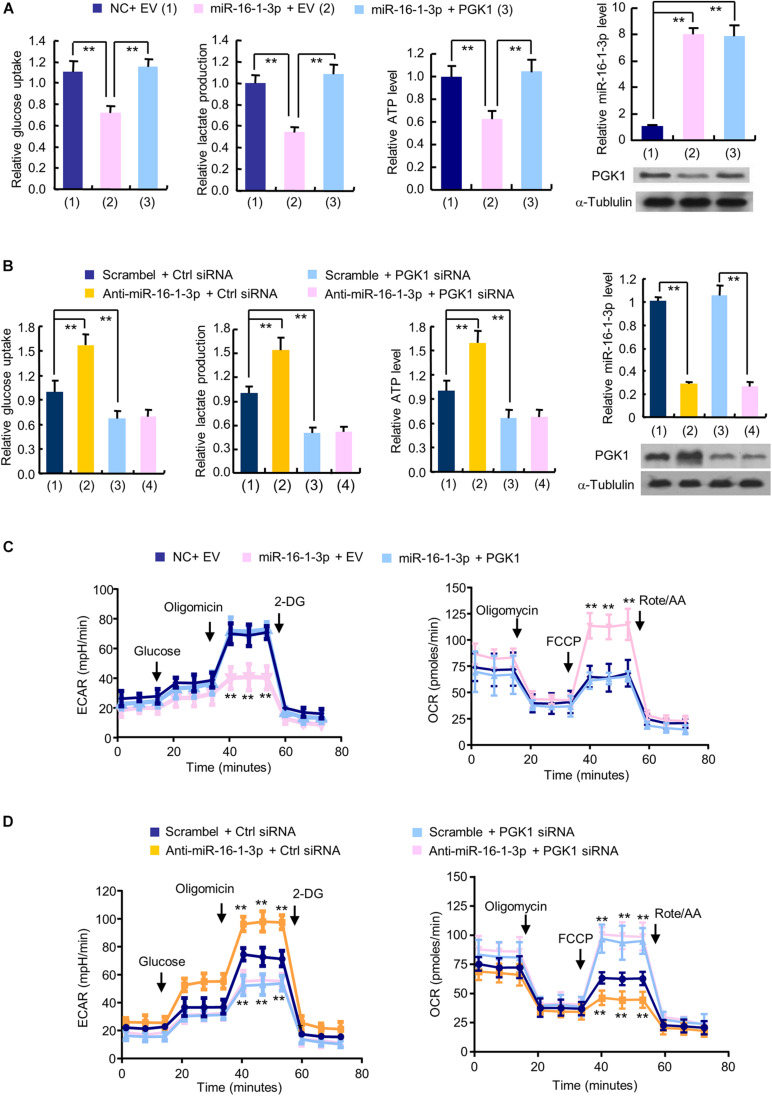
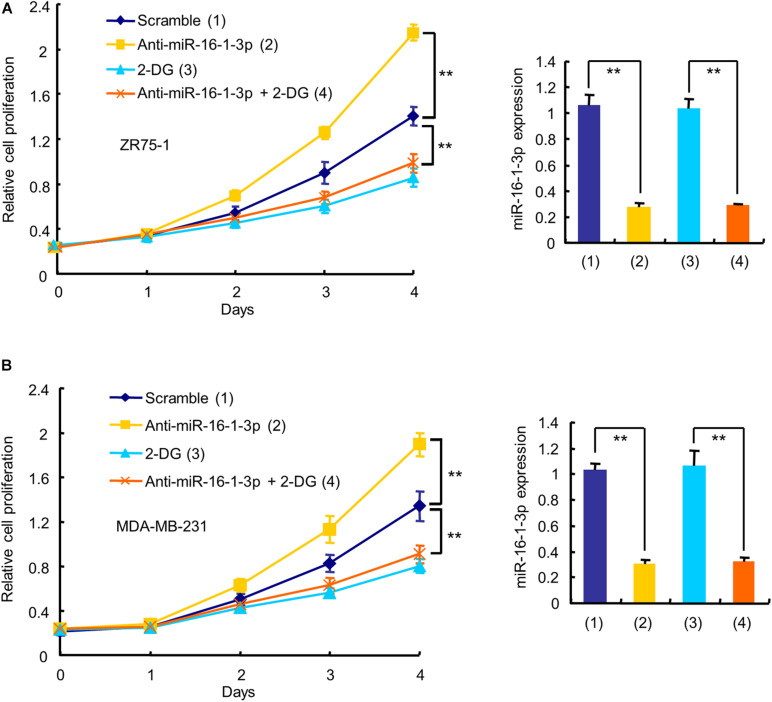
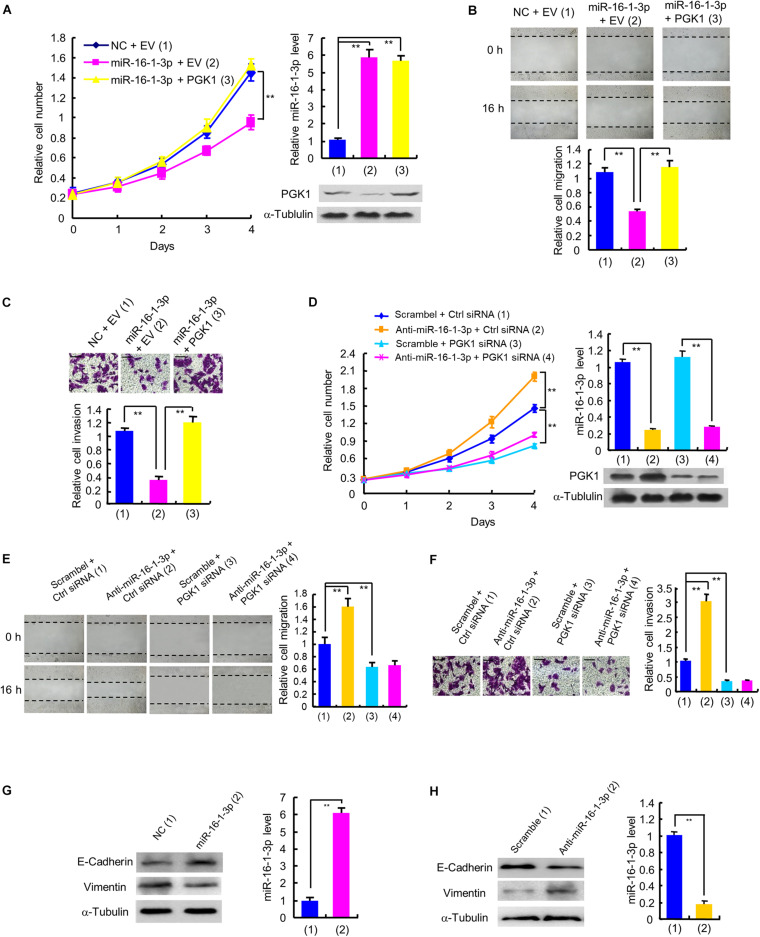
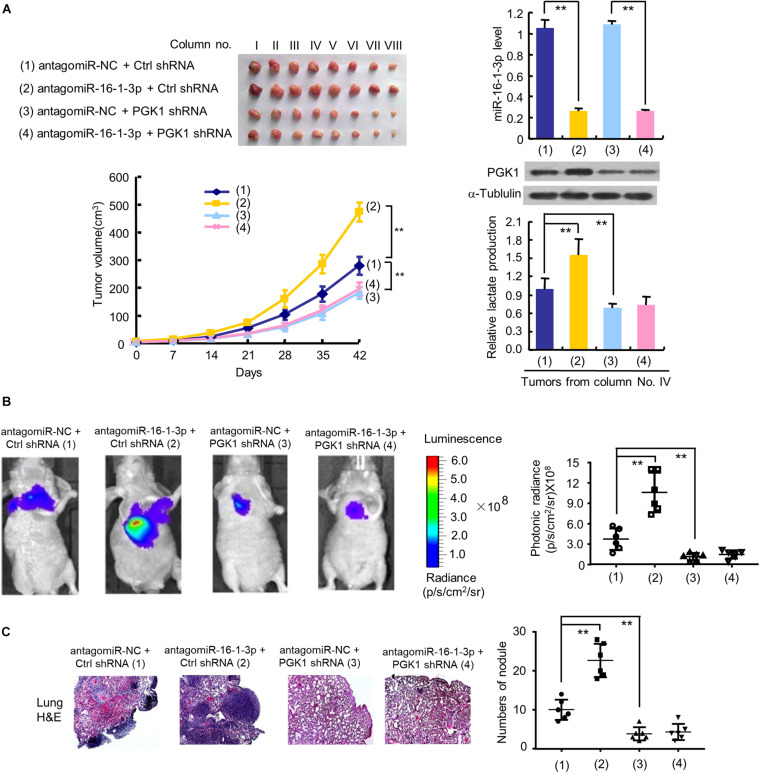
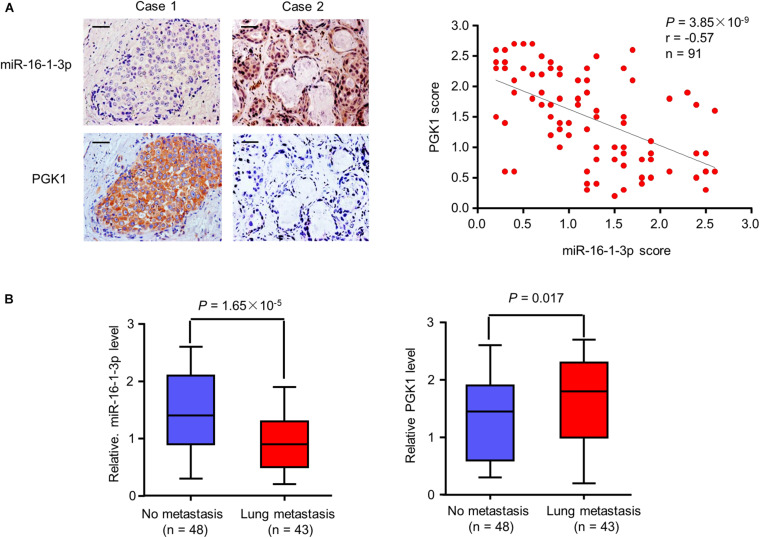
The Warburg effect (aerobic glycolysis) is a hallmark of cancer and is becoming a promising target for diagnosis and therapy. Phosphoglycerate kinase 1 (PGK1) is the first adenosine triphosphate (ATP)-generating glycolytic enzyme in the aerobic glycolysis pathway and plays an important role in cancer development and progression. However, how microRNAs (miRNAs) regulate PGK1-mediated aerobic glycolysis remains unknown. Here, we show that miR-16-1-3p inhibits PGK1 expression by directly targeting its 3'-untranslated region. Through inhibition of PGK1, miR-16-1-3p suppressed aerobic glycolysis by decreasing glucose uptake, lactate and ATP production, and extracellular acidification rate, and increasing oxygen consumption rate in breast cancer cells. Aerobic glycolysis regulated by the miR-16-1-3p/PGK1 axis is critical for modulating breast cancer cell proliferation, migration, invasion and metastasis in vitro and in vivo. In breast cancer patients, miR-16-1-3p expression is negatively correlated with PGK1 expression and breast cancer lung metastasis. Our findings provide clues regarding the role of miR-16-1-3p as a tumor suppressor in breast cancer through PGK1 suppression. Targeting PGK1 through miR-16-1-3p could be a promising strategy for breast cancer therapy.
Keywords: PGK1; cell proliferation; metastasis; miR-16-1-3p; the Warburg effect.
Copyright © 2020 Ye, Liang, Zhang and Zhang.
Conflict of interest statement
The authors declare that the research was conducted in the absence of any commercial or financial relationships that could be construed as a potential conflict of interest.
Figures
Similar articles
-
Regulation of phosphoglycerate kinase 1 and its critical role in cancer.Cell Commun Signal. 2023 Sep 18;21(1):240. doi: 10.1186/s12964-023-01256-4. Cell Commun Signal. 2023. PMID: 37723547 Free PMC article. Review.
-
miR-30a-5p suppresses breast tumor growth and metastasis through inhibition of LDHA-mediated Warburg effect.Cancer Lett. 2017 Aug 1;400:89-98. doi: 10.1016/j.canlet.2017.04.034. Epub 2017 Apr 29. Cancer Lett. 2017. PMID: 28461244
-
MiR-150-5p regulates melanoma proliferation, invasion and metastasis via SIX1-mediated Warburg Effect.Biochem Biophys Res Commun. 2019 Jul 12;515(1):85-91. doi: 10.1016/j.bbrc.2019.05.111. Epub 2019 May 23. Biochem Biophys Res Commun. 2019. PMID: 31128917
-
miR-489-3p/SIX1 Axis Regulates Melanoma Proliferation and Glycolytic Potential.Mol Ther Oncolytics. 2019 Nov 27;16:30-40. doi: 10.1016/j.omto.2019.11.001. eCollection 2020 Mar 27. Mol Ther Oncolytics. 2019. PMID: 32258386 Free PMC article.
-
Phosphoglycerate Kinase 1: An Effective Therapeutic Target in Cancer.Front Biosci (Landmark Ed). 2024 Mar 6;29(3):92. doi: 10.31083/j.fbl2903092. Front Biosci (Landmark Ed). 2024. PMID: 38538272 Review.
Cited by
-
Metabolism-regulating non-coding RNAs in breast cancer: roles, mechanisms and clinical applications.J Biomed Sci. 2024 Feb 26;31(1):25. doi: 10.1186/s12929-024-01013-w. J Biomed Sci. 2024. PMID: 38408962 Free PMC article. Review.
-
Knockdown of FBI-1 Inhibits the Warburg Effect and Enhances the Sensitivity of Hepatocellular Carcinoma Cells to Molecular Targeted Agents via miR-3692/HIF-1α.Front Oncol. 2021 Nov 12;11:796839. doi: 10.3389/fonc.2021.796839. eCollection 2021. Front Oncol. 2021. PMID: 34869045 Free PMC article.
-
Regulation of phosphoglycerate kinase 1 and its critical role in cancer.Cell Commun Signal. 2023 Sep 18;21(1):240. doi: 10.1186/s12964-023-01256-4. Cell Commun Signal. 2023. PMID: 37723547 Free PMC article. Review.
-
Phosphoglycerate kinase 1 as a potential prognostic biomarker in papillary thyroid carcinoma.Front Pharmacol. 2025 Jul 23;16:1542159. doi: 10.3389/fphar.2025.1542159. eCollection 2025. Front Pharmacol. 2025. PMID: 40771921 Free PMC article.
-
Therapeutic Metabolic Reprograming Using microRNAs: From Cancer to HIV Infection.Genes (Basel). 2022 Jan 29;13(2):273. doi: 10.3390/genes13020273. Genes (Basel). 2022. PMID: 35205318 Free PMC article. Review.
References
-
- Chen J. Y., Xu L. F., Hu H. L., Wen Y. Q., Chen D., Liu W. H. (2020). MiRNA-215-5p alleviates the metastasis of prostate cancer by targeting PGK1. Eur. Rev. Med. Pharmacol. Sci. 24 639–646. - PubMed
LinkOut - more resources
Full Text Sources
Miscellaneous