. 2020 Aug 6:2:88.
doi: 10.3389/fspor.2020.00088. eCollection 2020.

Achilles Tendon Morphology Is Related to Triceps Surae Muscle Size and Peak Plantarflexion Torques During Walking in Young but Not Older Adults

Affiliations

Achilles Tendon Morphology Is Related to Triceps Surae Muscle Size and Peak Plantarflexion Torques During Walking in Young but Not Older Adults

Katherine R Knaus et al. Front Sports Act Living. .

Abstract

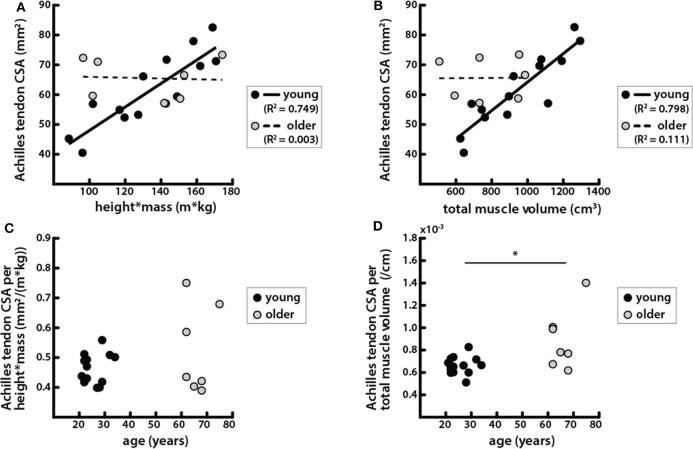
The interaction of the triceps surae muscles and the Achilles tendon is critical in producing the ankle plantarflexion torque required for human walking. Deficits in plantarflexor output are a hallmark of reduced mobility in older adults and are likely associated with changes in the triceps surae muscles that occur with age. Structural differences between young and older adults have been observed in the Achilles tendon and in the triceps surae muscles. However, less is known about how age-related differences in muscle and tendon morphology correspond with each other and, furthermore, how those morphology differences correlate with age-related deficits in function. The goal of this work was to investigate whether there is a correlation between age-related differences in triceps surae muscle size and Achilles tendon cross-sectional area (CSA) and whether either is predictive of ankle plantarflexion torque during walking. We used magnetic resonance imaging (MRI) to measure triceps surae muscle volumes and tendon CSAs in young (n = 14, age: 26 ± 4 years) and older (n = 7, age: 66 ± 5 years) adults, and we determined peak plantarflexion torques during treadmill walking. We found that individual muscle volumes as a percentage of the total triceps surae volume did not differ between young and older adults, though muscle volumes per body size (normalized by the product of height and mass) were smaller in older adults. Achilles tendon CSA was correlated with body size and muscle volumes in young adults but not in older adults. The ratio of tendon CSA to total triceps surae muscle volume was significantly greater in older adults. Peak ankle plantarflexion torque during walking correlated with body size and triceps surae volume in young and older adults but was correlated with tendon CSA only in the young adults. Structure-function relationships that seem to exist between the Achilles tendon and the triceps surae muscles in young adults are no longer evident in all older adults. Understanding mechanisms that determine altered Achilles tendon CSA in older adults may provide insight into age-related changes in function.

Keywords: aging gait; gastrocnemius; muscle volume; plantarflexion torque; soleus; tendon cross-sectional area.


Figures

Figure 1
Figure 1
Triceps surae muscles were segmented in axial MR images. The muscle cross sections were defined for the medial (green) and lateral (yellow) heads of the gastrocnemius and the posterior (blue) and anterior (orange) compartments of the soleus. Each muscle was reconstructed in 3-D.
Figure 2
Figure 2
Relative volumes of triceps surae muscles did not differ between young and older adults. Relative volumes of individual triceps surae muscles as a percentage of the total triceps surae volume are shown for young (black) and older (gray) adults. A Mann–Whitney rank sum test detected no significant differences between young and older adults for any muscle (Table 2).
Figure 3
Figure 3
Triceps surae muscle volumes per body size were correlated with body size and were smaller per body size in older adults. (A) Total triceps surae volumes vs. the product of height and mass for young (black circles, solid line: R2 = 0.867, p = 1.33e−6) and older (gray circles, dashed line: R2 = 0.706, p = 0.018) adults. (B) Total triceps surae muscle volumes normalized by height * mass vs. age; a Mann–Whitney rank sum test determined muscle volume normalized by body size was significantly different between young and older adults (p = 0.015). (C) Average individual triceps surae muscle volumes normalized by height * mass for older adults vs. young adults; error bars indicate standard deviation. Points falling below the unity line (gray) indicate muscles that are smaller in older adults than in young adults (Table 2). *Indicates significant difference between young and old adults.
Figure 4
Figure 4
Tendons exhibited greater variation in length and CSA within age groups than between young and older adults. Achilles tendon CSA was measured in axial MR images of (A) young and (D) older adults from the most proximal image where the calcaneus was visible to the most distal image where the soleus was visible. CSA locations are reported as their distance from the calcaneus in the proximal–distal direction. To account for variations in free tendon length, CSA locations were normalized to length for (B) young and (E) older adults with the top of the calcaneus being the most distal point at 0% and the soleus MTJ the most proximal point at 100%. Average tendon CSA is plotted with normalized tendon length in (C) young (solid line, gray shading for standard deviation) and (F) older (dotted line, light gray shading) adults.
Figure 5
Figure 5
Achilles tendon CSA was correlated with body and muscle size in young adults but not in older adults. (A) Achilles tendon CSAs vs. the product of height and mass in young (black circles, solid line: R2 = 0.749, p = 6.42e−5) and older (gray circles, dashed line: R2 = 0.003, p = 0.901) adults. (B) Achilles tendon CSA vs. total triceps surae muscle volume in young (black circles, solid line: R2 = 0.798, p = 1.69e−5) and older (gray circles, dashed line: R2 = 0.111, p = 0.139) adults. (C) Achilles tendon CSA normalized by height * mass vs. age; a Mann-Whitney rank sum test determined that there were no significant differences between age groups in tendon CSA normalized by body size (p = 0.737). (D) Achilles tendon CSA normalized by total triceps surae muscle volume vs. age; a Mann–Whitey rank sum test determined that tendon CSA normalized by muscle size was significantly different between young and older adults (p = 0.019). *Indicates significant difference between young and old adults.
Figure 6
Figure 6
Peak ankle plantarflexion torque during walking was correlated with body and muscle size in young and older adults but correlated with tendon size only in young adults. (A) Average ankle torque normalized by body size, calculated as the product of height and mass, in young (solid line, gray shading for standard deviation) and older (dotted line, light gray shading) adults walking at 1.25 m/s plotted over one gait cycle. (B) Peak plantarflexion torque during walking at 1.25 m/s vs. the product of height and mass in young (black circles, solid line: R2 = 0.926, p = 3.77e−8) and older (gray circles, dashed line: R2 = 0.892, p = 1.35e−3) adults. (C) Peak torque vs. total triceps surae muscle volume in young (black circles, solid line: R2 = 0.801, p = 1.56e-5) and older (gray circles, dashed line: R2 = 0.760, p = 0.010) adults. (D) Peak torque vs. Achilles tendon CSA in young (black circles, solid line: R2 = 0.672, p = 3.31e−4) and older (gray circles, dashed line: R2 = 0.044, p = 0.651) adults. (E) Estimated peak forces, calculated by dividing peak torques by Achilles tendon moment arms, vs. total triceps surae muscle volume in young (black circles, solid line: R2 = 0.723, p = 1.16e−4) and older (gray circles, dashed line: R2 = 0.406, p = 0.124) adults.

Similar articles

Cited by

References

    1. Agur A. M., Thow-Hing V. G., Ball K. A., Fiume E., Hunt McKee N. (2003). Documentation and three-dimensional modelling of human soleus muscle architecture. Clin. Anatomy 16, 285–293. 10.1002/ca.10112 - DOI - PubMed
    1. Albracht K., Arampatzis A., Baltzopoulos V. (2008). Assessment of muscle volume and physiological cross-sectional area of the human triceps surae muscle in vivo. J. Biomech. 41, 2211–218. 10.1016/j.jbiomech.2008.04.020 - DOI - PubMed
    1. Anderson F. C., Pandy M. G. (2003). Individual muscle contributions to support in normal walking. Gait Posture 17, 159–169. 10.1016/S0966-6362(02)00073-5 - DOI - PubMed
    1. Arampatzis A., Karamanidis K., Morey-Klapsing G., De Monte G., Stafilidis S. (2007). Mechanical properties of the triceps surae tendon and aponeurosis in relation to intensity of sport activity. J. Biomech. 40, 1946–1952. 10.1016/j.jbiomech.2006.09.005 - DOI - PubMed
    1. Baxter J. R., Stephen J. P. (2014). Plantar flexor moment arm and muscle volume predict torque-generating capacity in young men. J. Appl. Physiol. 116, 538–544. 10.1152/japplphysiol.01140.2013 - DOI - PMC - PubMed

LinkOut - more resources