. 2020 Oct 9:2:570449.
doi: 10.3389/fspor.2020.570449. eCollection 2020.

Sex Differences in Human Ankle Stiffness During Standing Balance

Affiliations

Sex Differences in Human Ankle Stiffness During Standing Balance

Ermyntrude Adjei et al. Front Sports Act Living. .

Abstract

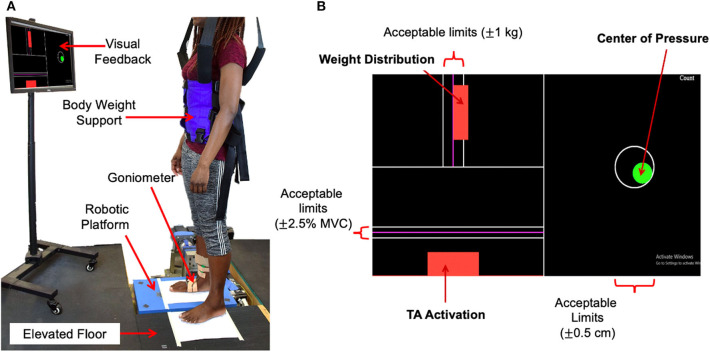
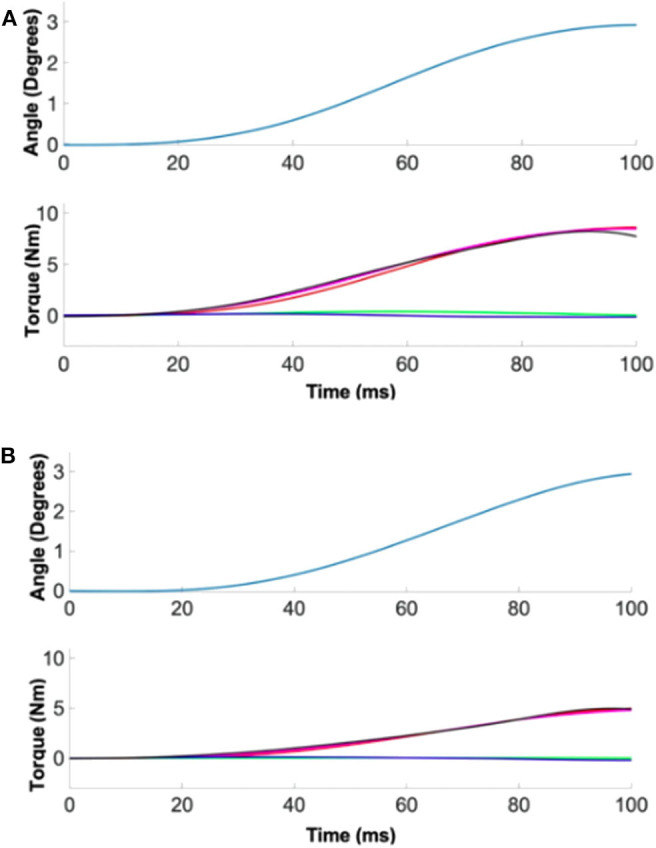
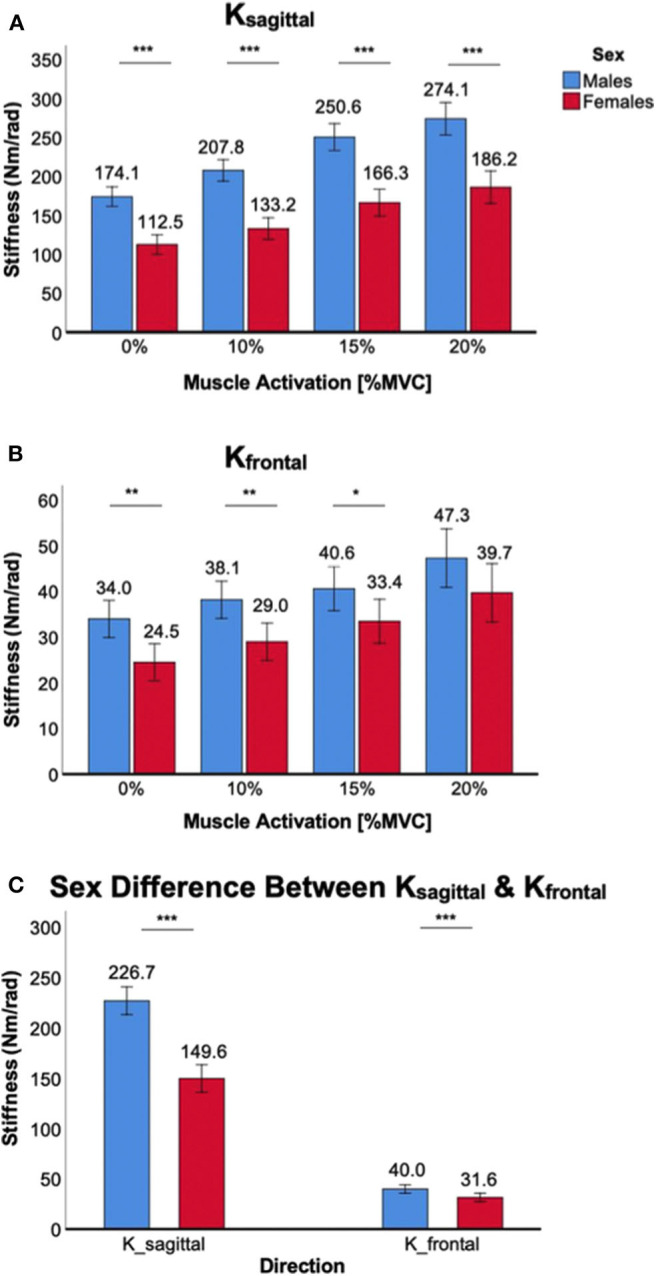
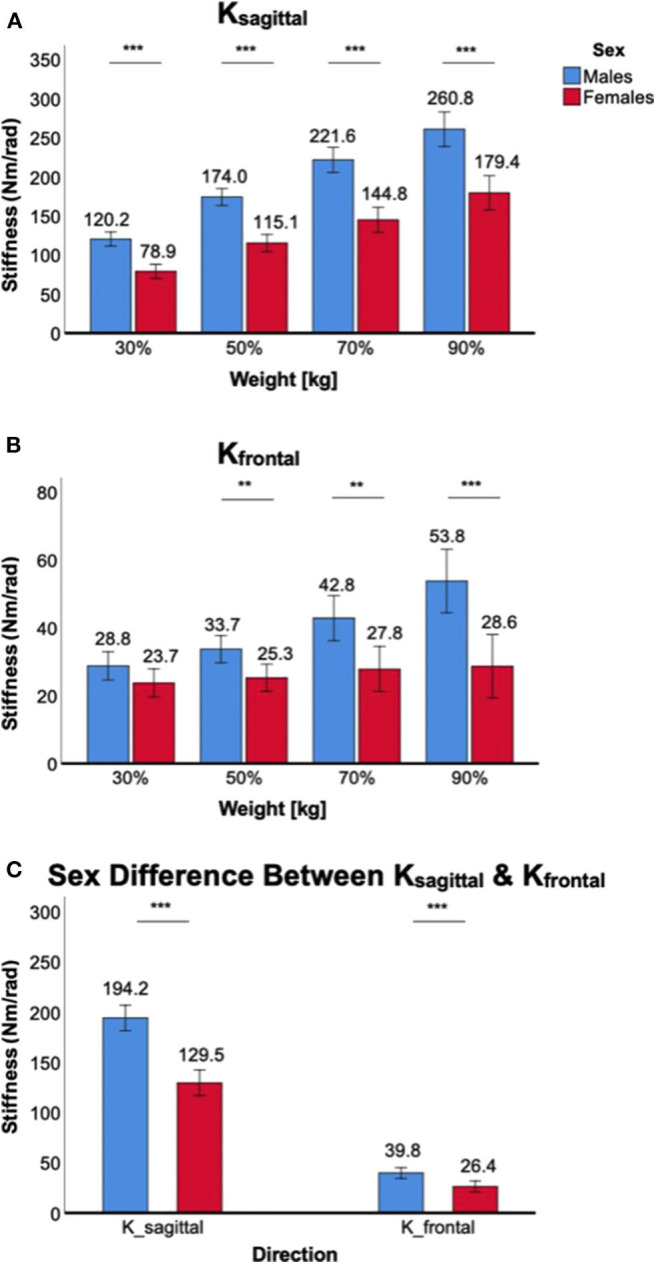
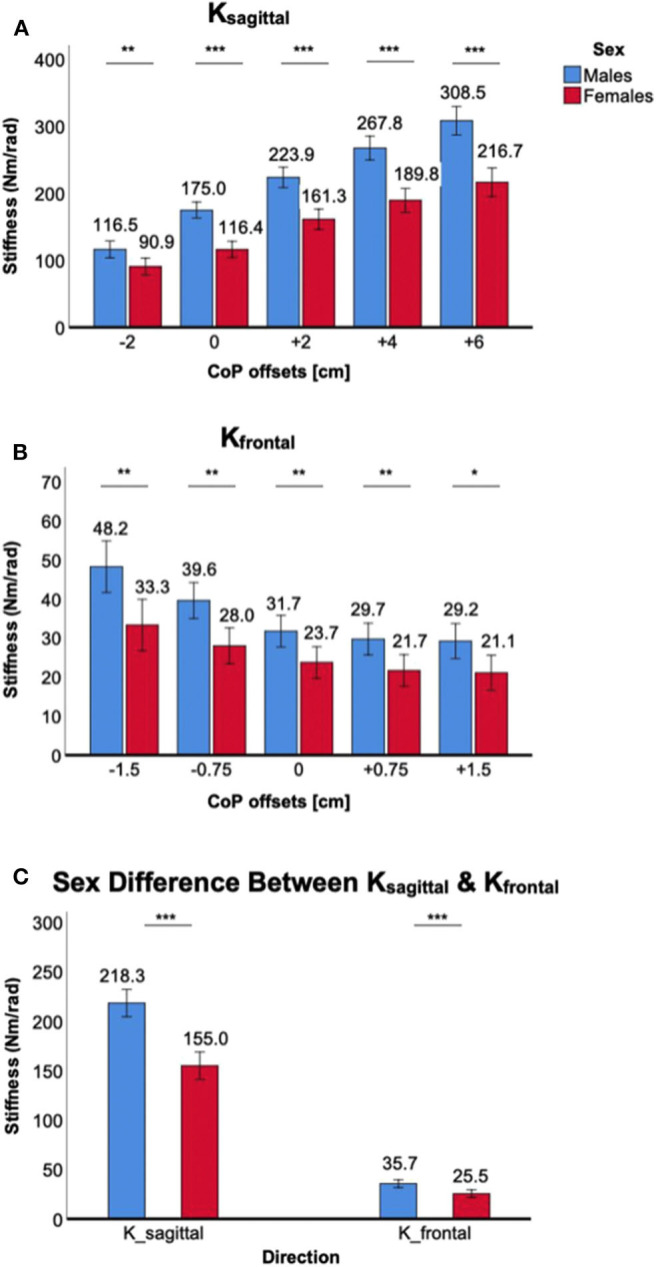
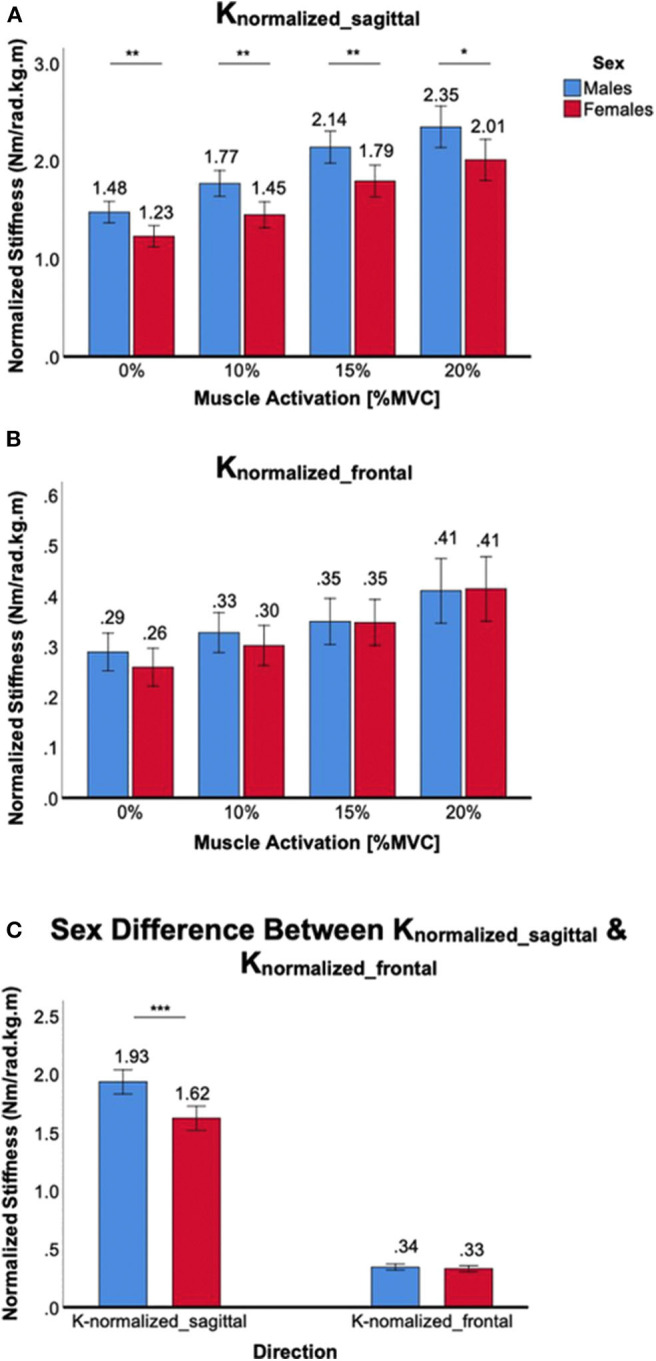
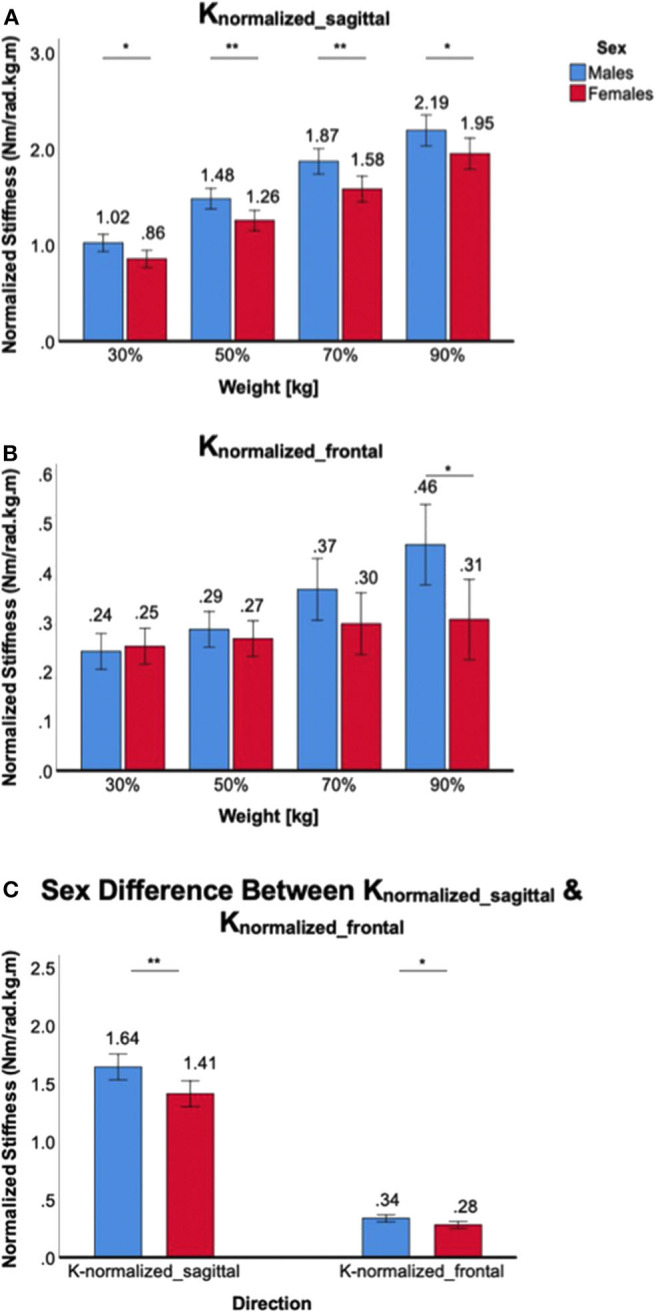
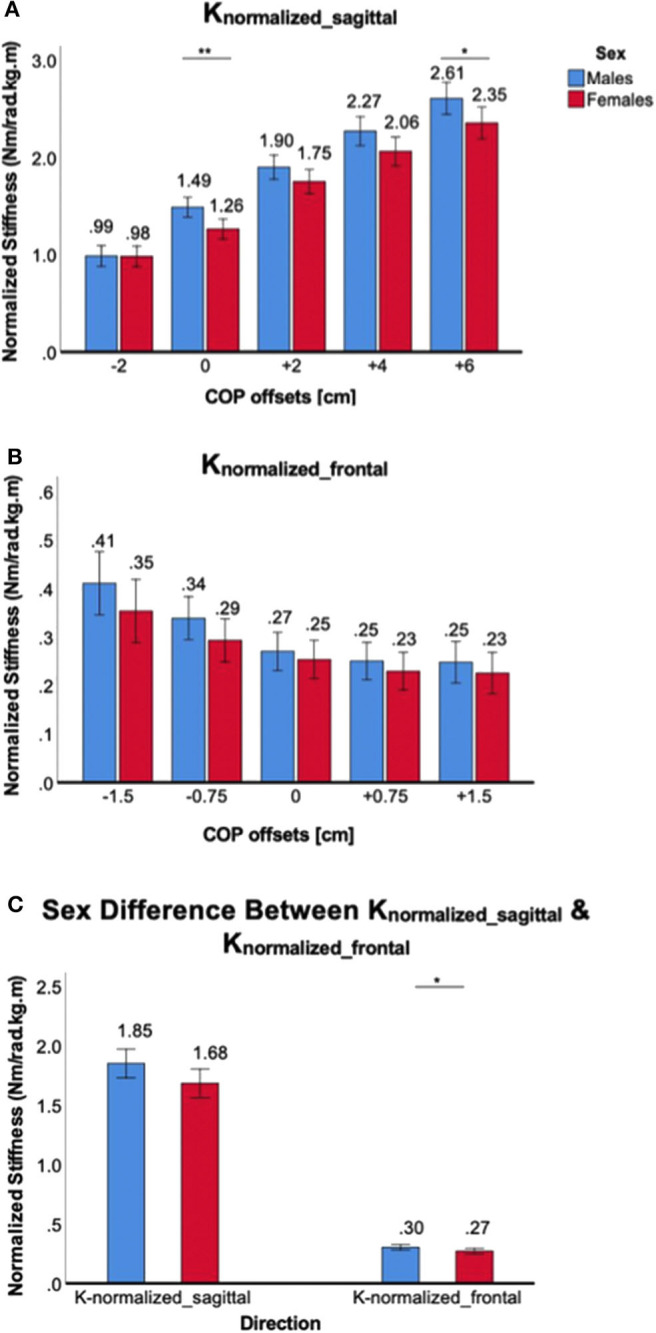
The purpose of this study is to quantify sex differences in 2-dimensional (2D) ankle stiffness during upright standing balance and investigate the mechanisms for the differences. A dual-axis robotic platform, capable of perturbing the ankle and measuring the corresponding ankle torques in both the sagittal and frontal planes, was used to reliably quantify the 2D ankle stiffness while healthy young human subjects perform a range of standing balance tasks, specifically, ankle muscle co-contraction tasks, weight-bearing tasks, and ankle torque generation tasks. In all task conditions and in both planes of ankle motion, ankle stiffness in males was consistently greater than that in females. Among all 26 experimental conditions, all but 2 conditions in the frontal plane showed statistically significant sex differences. Further investigation on the normalized ankle stiffness, scaled by weight times height, suggests that while sex differences in ankle stiffness in the sagittal plane could be explained by sex differences in anthropometric factors as well as neuromuscular factors, the differences in the frontal plane are mostly explained by anthropometric factors. This study also demonstrates that the sex differences in the sagittal plane were significantly higher as compared to those in the frontal plane. The results in this study will provide a foundation for not only characterizing sex differences in ankle stiffness during locomotion, but also investigating sex differences in lower body stability and risk of ankle injury.

Keywords: ankle impedance; ankle injury; ankle stiffness; gender differences; human ankle; sex differences; standing balance.


Figures

Figure 1
Figure 1
Experimental setup. (A) Standing balance setup, (B) visual feedback showing the target, current levels, and acceptable limits of 3 parameters to be controlled during standing balance tasks.
Figure 2
Figure 2
A representative quantification of ankle stiffness by linear regression. (Top) The position perturbation profile. (Bottom) The torque responses. Red, green, and blue denote the torque contribution by ankle stiffness, damping, and inertia. Measured torque (black) matched well with the estimated torque (magenta) by summing the torque contributions of three ankle parameters. (A) Male example, (B) female example.
Figure 3
Figure 3
Sex differences in 2D ankle stiffness for the muscle co-contraction tasks. (A) Ksagittal, (B) Kfrontal, (C) sex difference in ankle stiffness in the sagittal plane vs. frontal plane.
Figure 4
Figure 4
Sex differences in 2D ankle stiffness for the weight-bearing tasks. (A) Ksagittal, (B) Kfrontal, (C) sex difference in ankle stiffness in the sagittal plane vs. frontal plane.
Figure 5
Figure 5
Sex differences in 2D ankle stiffness for the ankle torque generation (CoP) tasks. (A) Ksagittal, (B) Kfrontal, (C) sex difference in ankle stiffness in the sagittal plane vs. frontal plane.
Figure 6
Figure 6
Sex differences in normalized 2D ankle stiffness for the muscle co-contraction tasks. (A) Knormalized_sagittal, (B) Knormalized_frontal, (C) sex difference in normalized ankle stiffness in the sagittal plane vs. frontal plane.
Figure 7
Figure 7
Sex differences in normalized 2D ankle stiffness for the weight-bearing tasks. (A) Knormalized_sagittal, (B) Knormalized_frontal, (C) sex difference in normalized ankle stiffness in the sagittal plane vs. frontal plane.
Figure 8
Figure 8
Sex differences in normalized 2D ankle stiffness for the ankle torque generation tasks. (A) Knormalized_sagittal, (B) Knormalized_frontal, (C) sex difference in normalized ankle stiffness in the sagittal plane vs. frontal plane.

References

    1. Beynnon B. D., Renstrom P. A., Alosa D. M., Baumhauer J. F., Vacek P. M. (2001). Ankle ligament injury risk factors: a prospective study of college athletes. J. Orthop. Res. 19, 213–220. 10.1016/S0736-0266(00)90004-4 - DOI - PubMed
    1. Brockett C. L., Chapman G. J. (2016). Biomechanics of the ankle. Orthop. Trauma 30, 232–238. 10.1016/j.mporth.2016.04.015 - DOI - PMC - PubMed
    1. Elias S. R. (2001). 10-year trend in USA cup soccer injuries: 1988-1997. Med. Sci. Sports Exerc. 33, 359–367. 10.1097/00005768-200103000-00004 - DOI - PubMed
    1. Ficanha E. M., Ribeiro G., Rastgaar M. A. (2016). Design and Evaluation of a 2-DOF instrumented platform for estimation of the ankle mechanical impedance in the sagittal and frontal planes. IEEE/ASME Trans. Mechatronics 21, 2531–2542. 10.1109/TMECH.2016.2552406 - DOI
    1. Glenmark B., Nilsson M., Gao H., Gustafsson J. A., Dahlman-Wright K., Westerblad H. (2004). Difference in skeletal muscle function in males vs. females: role of estrogen receptor-beta. Am. J. Physiol. Endocrinol. Metab. 287, E1125–E1131. 10.1152/ajpendo.00098.2004 - DOI - PubMed

LinkOut - more resources