. 2021 Mar 31;31(5):2523-2533.
doi: 10.1093/cercor/bhaa371.

Transdiagnostic, Connectome-Based Prediction of Memory Constructs Across Psychiatric Disorders

Affiliations

Transdiagnostic, Connectome-Based Prediction of Memory Constructs Across Psychiatric Disorders

Daniel S Barron et al. Cereb Cortex. .

Abstract

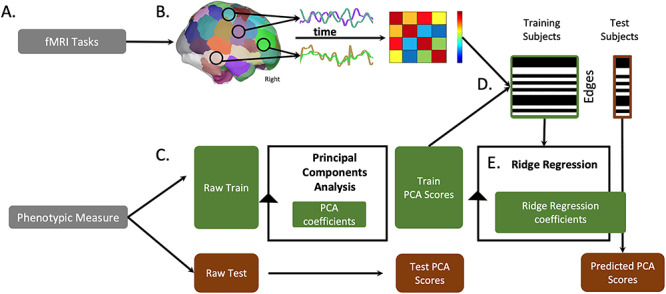
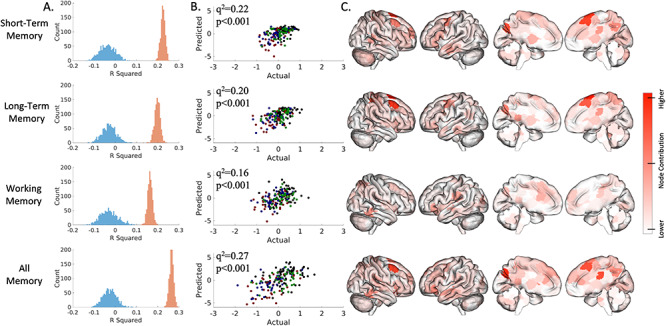
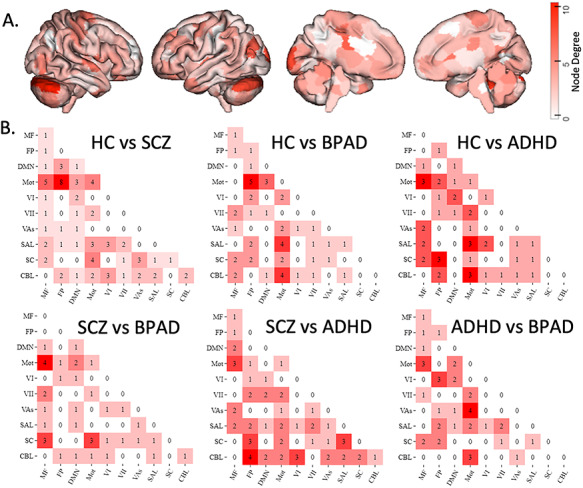
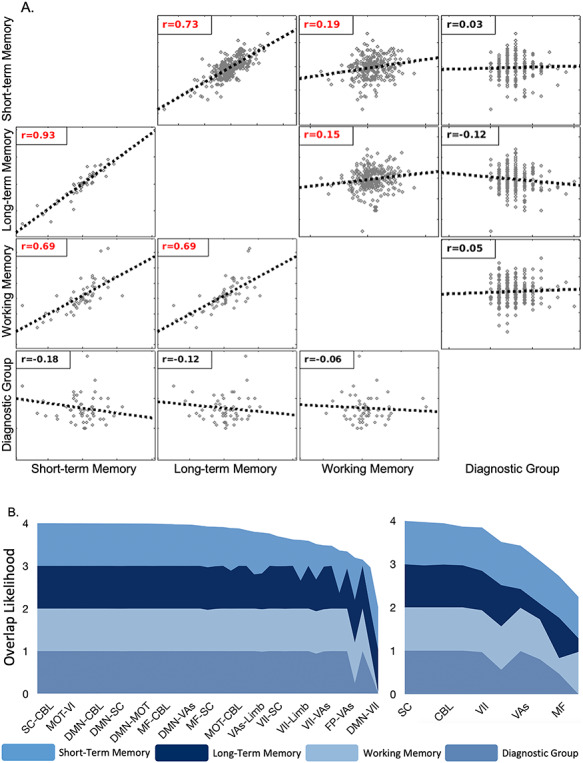
Memory deficits are observed in a range of psychiatric disorders, but it is unclear whether memory deficits arise from a shared brain correlate across disorders or from various dysfunctions unique to each disorder. Connectome-based predictive modeling is a computational method that captures individual differences in functional connectomes associated with behavioral phenotypes such as memory. We used publicly available task-based functional MRI data from patients with schizophrenia (n = 33), bipolar disorder (n = 34), attention deficit hyper-activity disorder (n = 32), and healthy controls (n = 73) to model the macroscale brain networks associated with working, short- and long-term memory. First, we use 10-fold and leave-group-out analyses to demonstrate that the same macroscale brain networks subserve memory across diagnostic groups and that individual differences in memory performance are related to individual differences within networks distributed throughout the brain, including the subcortex, default mode network, limbic network, and cerebellum. Next, we show that diagnostic groups are associated with significant differences in whole-brain functional connectivity that are distinct from the predictive models of memory. Finally, we show that models trained on the transdiagnostic sample generalize to novel, healthy participants (n = 515) from the Human Connectome Project. These results suggest that despite significant differences in whole-brain patterns of functional connectivity between diagnostic groups, the core macroscale brain networks that subserve memory are shared.

Keywords: (<5): prediction; functional connectivity; machine learning; psychiatry; transdiagnostic.


Figures

Figure 1
Figure 1
Overview of processing pipeline. (A) We use six fMRI tasks and five categories of phenotypic measures from the Neuropsychiatric Phenomics Consortium dataset (see Methods and Supplementary Materials). (B) We preprocess and divide fMRI volumes using the Shen 268 node atlas. We then create a cross-correlation matrix of internode connectivity, hereafter described as edges. (C) We separate behavior and (D) fMRI data into train and test groups. We perform a principal component analysis to summarize one behavioral construct score per subject; we use the training data’s PCA coefficients to transform the behavioral test data into component space. (D) Across training subjects, we correlate each edge to the phenotypic scores and restrict subsequent analyses to edges with a correlation strength above P < 0.01 (see Supplementary Materials for different statistical thresholds). (E) We use a ridge regression algorithm to train a predictive model wherein edges from all 6 fMRI tasks predict a phenotypic score. We apply this model to the selected edges to predict phenotypic scores for each individual in the test group. Model performance measures are described in Methods.
Figure 2
Figure 2
Connectome-based predictive model performance for transdiagnostic 10-fold cross-validation. The left column (A) shows a histogram of the model performance across 1000 iterations of the actual (red) and randomly permuted (blue) data. The middle column (B) shows how actual and predicted values compare for the median-performing model (green, SCZ; blue, BPAD; red, ADHD). The right columns (C) show surface plots of each node’s degree, which is defined as the number of edges per node that were weighted in 95% of iterations (the short-term memory model includes 289 consistently weighted edges; long-term, 276 edges; working, 174; all, 362). Leave-one-group-out analyses are presented in the Supplementary Materials.
Figure 3
Figure 3
Mass multivariate analysis of disease group differences in brain network structure across all tasks. (A) Surface illustration of nodes where edges (network connections) significantly differ across all clinical groups, as measured with Hotelling’s T2. (B) illustrates significant network-to-network edges. (Circle plots showing nonsummarized edges can be referenced in the Supplementary Materials; Network Labels: MF, medial frontal; FP, frontoparietal; DMN, default mode; Mot, motor cortex; VI, visual A; VII, visual B; VAs, visual association; SAL, salience; SC, subcortical; CBL, cerebellum).
Figure 4
Figure 4
Similarity between the short, long, and working memory 10-fold predictive models and the diagnostic group mass multivariate analyses. (A) Correlation matrices for the node- or network-level contribution to the three predictive models and the node- or network-level F-score of the mass multivariate analyses. The upper triangle shows node-level correlations; the lower triangle shows network-level correlations. Red font indicates significant correlations. Overall, all memory models were correlated with each other but not the MMA results. (B) Layer thickness represents the likelihood that a particular internetwork (Left) or intranetwork (Right) edge is selected by the model, as computed by the hypergeometric distribution. Ridge regression analyses are indicated by short, long, and working memory. MMAis indicated by disease group. Each layered plot shows the cumulative (sum) likelihood (1.0—P value) estimated from the probability of edges being shared between a priori networks and the short-, long-, and working memory models (Fig. 2) and groups differences associated with diagnostic categories (Fig. 3). Networks and internetwork pairs are ordered from greatest to least cumulative likelihood. Only the most overlapping networks are shown for simplicity.

References

    1. Avery EW, Yoo K, Rosenberg MD, Greene AS, Gao S, Na DL, Scheinost D, Constable TR, Chun MM. 2020. Distributed patterns of functional connectivity predict working memory performance in novel healthy and memory-impaired individuals. J Cogn Neurosci. 32:241–255. - PMC - PubMed
    1. Baddeley A. 1988. Cognitive psychology and human memory. Trends Neurosci. 11:176–181. - PubMed
    1. Buckner RL. 2013. The cerebellum and cognitive function: 25 years of insight from anatomy and neuroimaging. Neuron. 80:807–815. - PubMed
    1. Burnham K, Anderson D. 2004. Model selection and multimodel inference. A practical information-theoretic approach. New York: Springer-Verlag.
    1. Bzdok D, Nichols TE, Smith SM. 2019. Towards algorithmic analytics for large-scale datasets. Nature Machine Intelligence. 1:296–306. - PMC - PubMed

Publication types

MeSH terms