

On the properties of the toxicity index and its statistical efficiency
- PMID: 33345351
- PMCID: PMC7953898
- DOI: 10.1002/sim.8858
On the properties of the toxicity index and its statistical efficiency
Abstract
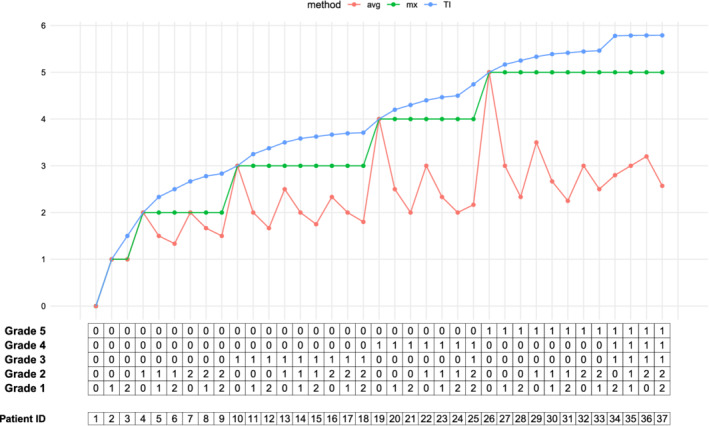
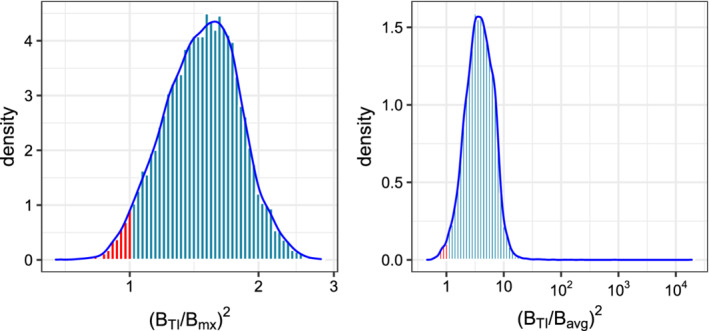
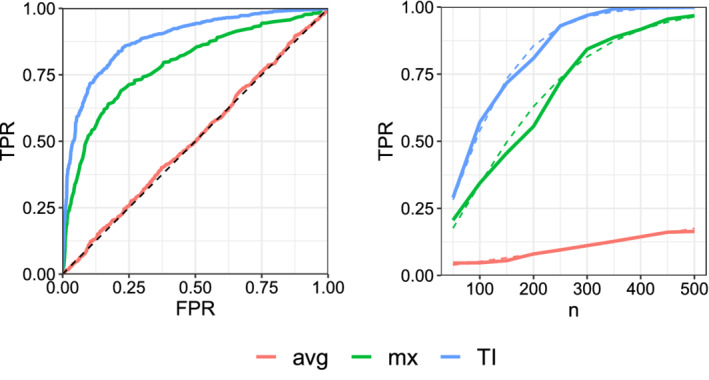
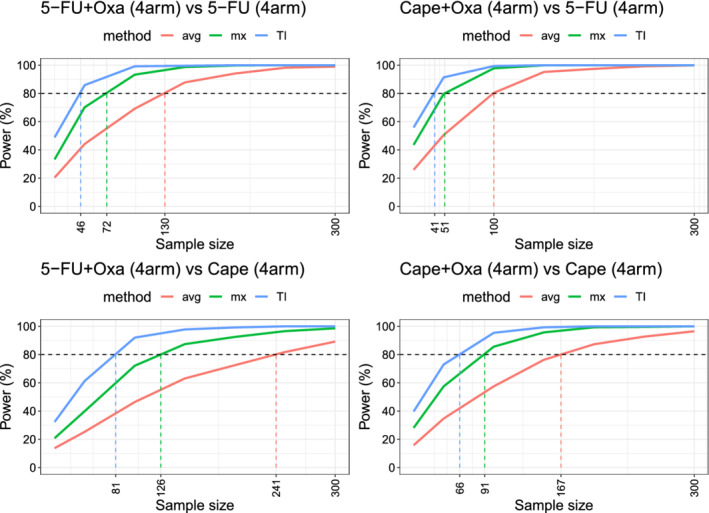
Cancer clinical trials typically generate detailed patient toxicity data. The most common measure used to summarize patient toxicity is the maximum grade among all toxicities and it does not fully represent the toxicity burden experienced by patients. In this article, we study the mathematical and statistical properties of the toxicity index (TI), in an effort to address this deficiency. We introduce a total ordering, (T-rank), that allows us to fully rank the patients according to how frequently they exhibit toxicities, and show that TI is the only measure that preserves the T-rank among its competitors. Moreover, we propose a Poisson-Limit model for sparse toxicity data. Under this model, we develop a general two-sample test, which can be applied to any summary measure for detecting differences among two population of toxicity data. We derive the asymptotic power function of this class as well as the asymptotic relative efficiency (ARE) of the members of the class. We evaluate the ARE formula empirically and show that if the data are drawn from a random Poisson-Limit model, the TI is more efficient, with high probability, than the maximum and the average summary measures. Finally, we evaluate our method on clinical trial toxicity data and show that TI has a higher power in detecting the differences in toxicity profile among treatments. The results of this article can be applied beyond toxicity modeling, to any problem where one observes a sparse array of scores on subjects and a ranking based on extreme scores is desirable.
Keywords: Poisson-Limit model; T-rank preservation; adverse events; toxicity index; two-sample test.
© 2020 John Wiley & Sons, Ltd.
Figures
References
-
- Miller AB, Hoogstraten BFAU, Staquet MFAU, Winkler A. Reporting results of cancer treatment. Cancer. 1981;47(1):207‐214. - PubMed
-
- Trotti A, Colevas AD, Setser A, Basch E. Patient‐reported outcomes and the evolution of adverse event reporting in oncology. J Clin Oncol. 2007;25(32):5121‐5127. - PubMed
-
- CTCAE Common Terminology Criteria for Adverse Events (CTCAE), Version 5.
-
- Trotti A, Colevas AD, Setser A, et al. CTCAE v3.0: development of a comprehensive grading system for the adverse effects of cancer treatment. Seminars in Radiation Oncology. 2003;13(3):176‐181. - PubMed
-
- Thanarajasingam G, Hubbard JM, Sloan JA, Grothey A. The imperative for a new approach to toxicity analysis in oncology clinical trials. J National Cancer Inst. 2015;107(10):djv216. - PubMed
Publication types
MeSH terms
Grants and funding
LinkOut - more resources
Full Text Sources
Medical