. 2021 Feb:44:101144.
doi: 10.1016/j.molmet.2020.101144. Epub 2020 Dec 18.

Epidermal Acyl-CoA-binding protein is indispensable for systemic energy homeostasis

Affiliations

Epidermal Acyl-CoA-binding protein is indispensable for systemic energy homeostasis

Ditte Neess et al. Mol Metab. 2021 Feb.

Abstract

Objectives: The skin is the largest sensory organ of the human body and plays a fundamental role in regulating body temperature. However, adaptive alterations in skin functions and morphology have only vaguely been associated with physiological responses to cold stress or sensation of ambient temperatures. We previously found that loss of acyl-CoA-binding protein (ACBP) in keratinocytes upregulates lipolysis in white adipose tissue and alters hepatic lipid metabolism, suggesting a link between epidermal barrier functions and systemic energy metabolism.

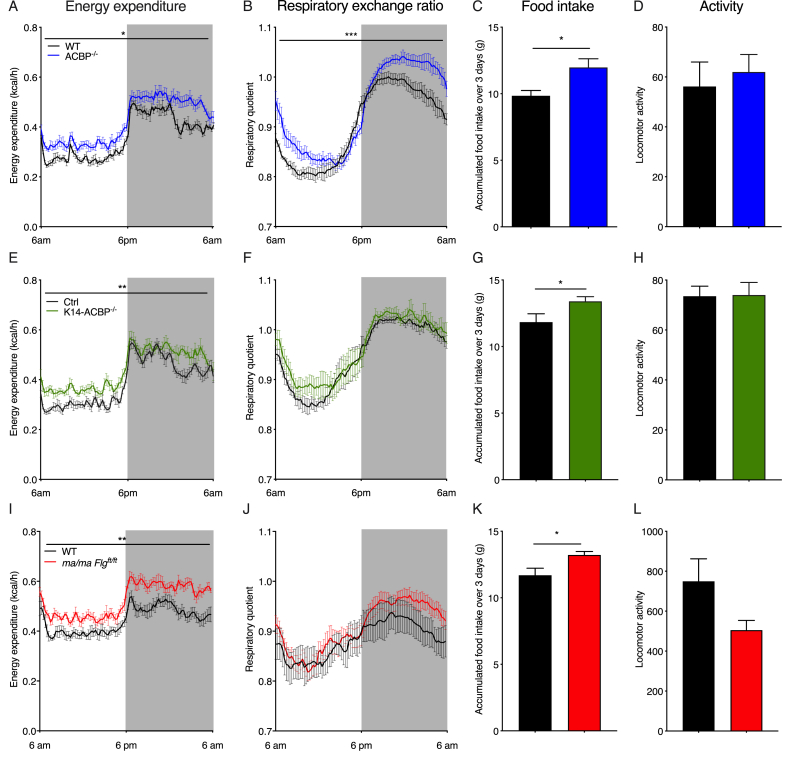
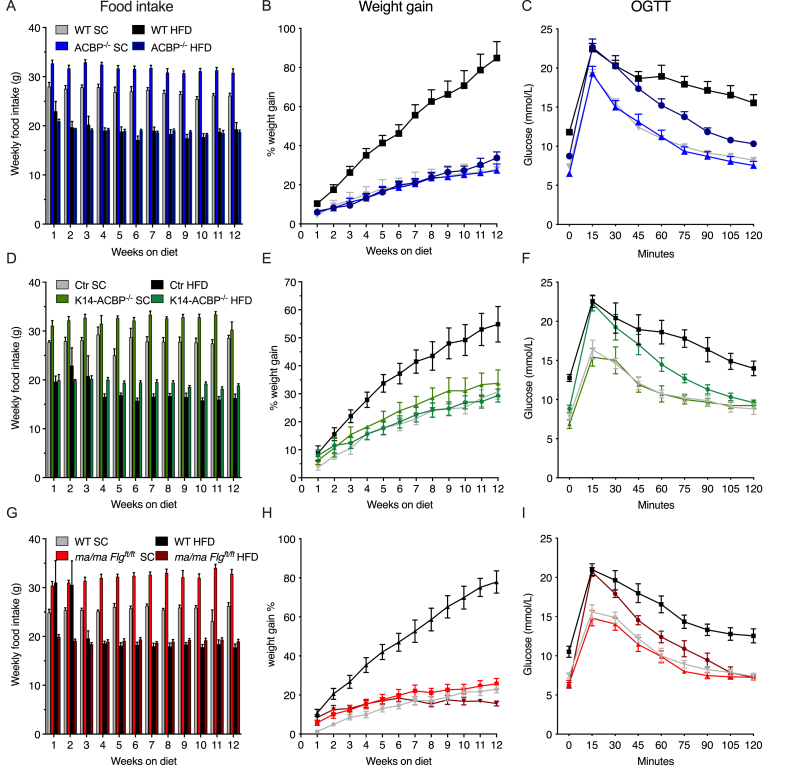
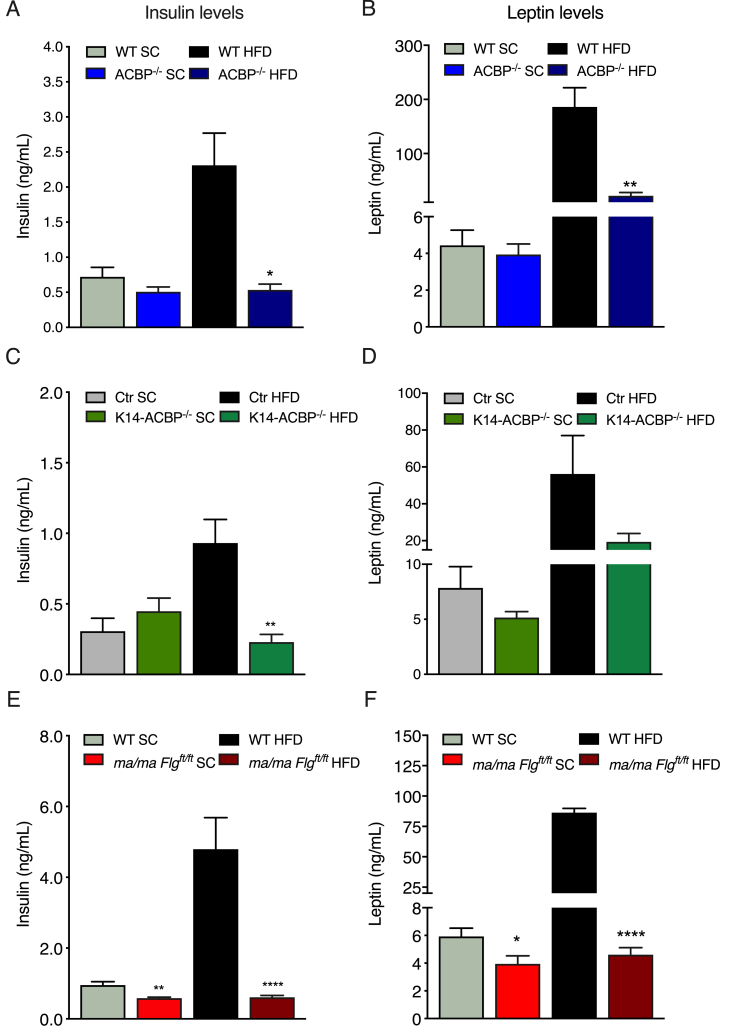
Methods: To assess the physiological responses to loss of ACBP in keratinocytes in detail, we used full-body ACBP-/- and skin-specific ACBP-/- knockout mice to clarify how loss of ACBP affects 1) energy expenditure by indirect calorimetry, 2) response to high-fat feeding and a high oral glucose load, and 3) expression of brown-selective gene programs by quantitative PCR in inguinal WAT (iWAT). To further elucidate the role of the epidermal barrier in systemic energy metabolism, we included mice with defects in skin structural proteins (ma/ma Flgft/ft) in these studies.

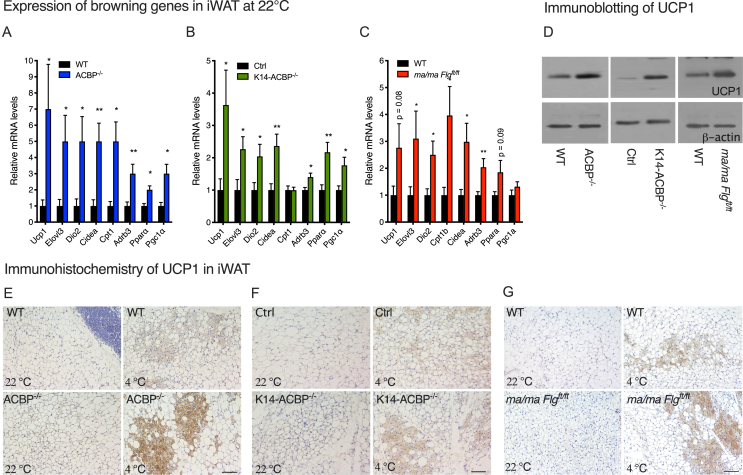
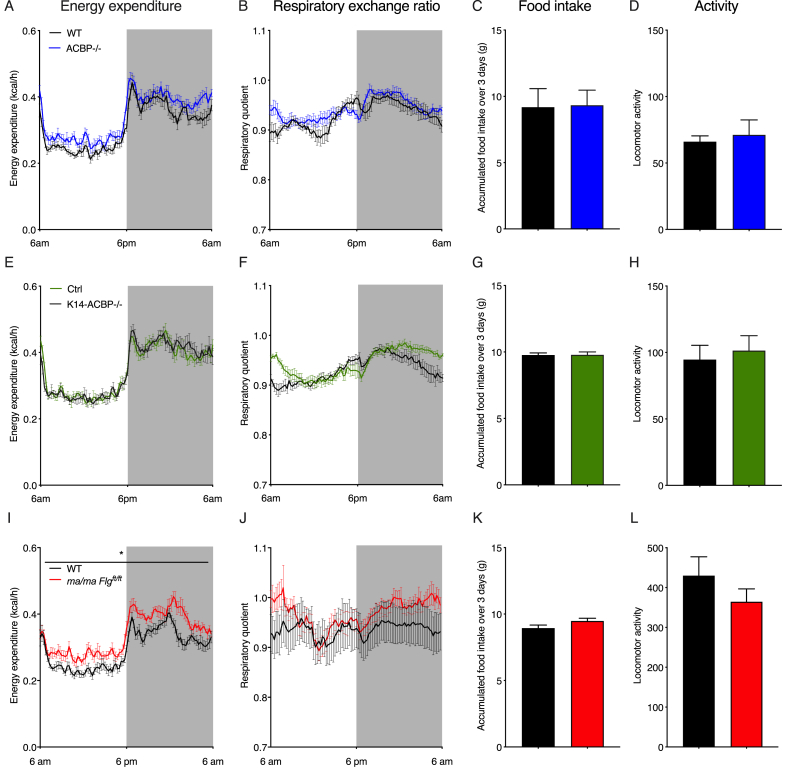
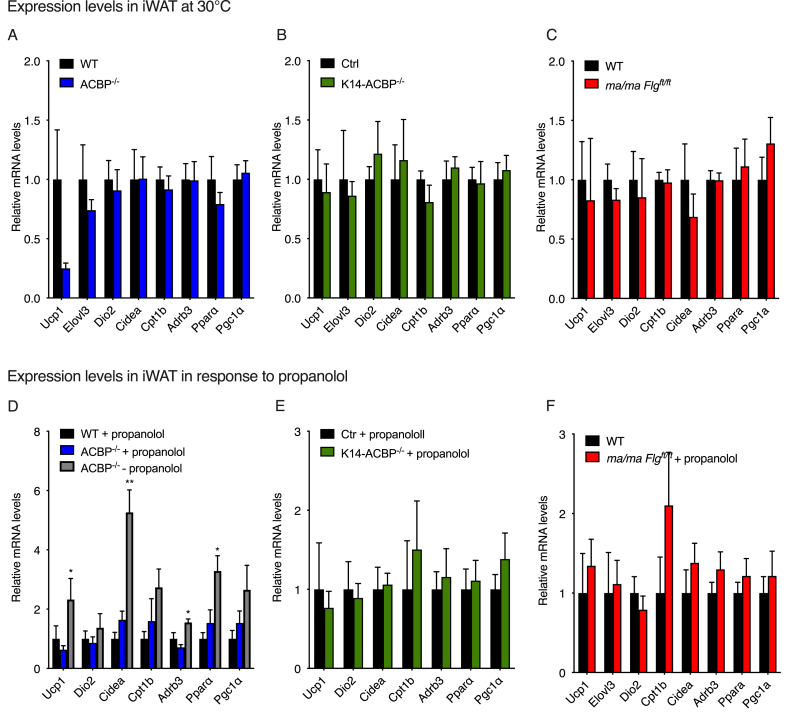
Results: We show that the ACBP-/- mice and skin-specific ACBP-/- knockout mice exhibited increased energy expenditure, increased food intake, browning of the iWAT, and resistance to diet-induced obesity. The metabolic phenotype, including browning of the iWAT, was reversed by housing the mice at thermoneutrality (30 °C) or pharmacological β-adrenergic blocking. Interestingly, these findings were phenocopied in flaky tail mice (ma/ma Flgft/ft). Taken together, we demonstrate that a compromised epidermal barrier induces a β-adrenergic response that increases energy expenditure and browning of the white adipose tissue to maintain a normal body temperature.

Conclusions: Our findings show that the epidermal barrier plays a key role in maintaining systemic metabolic homeostasis. Thus, regulation of epidermal barrier functions warrants further attention to understand the regulation of systemic metabolism in further detail.

Keywords: Acyl-CoA binding protein; Adipose tissue; Browning; Diet induced obesity; Energy expenditure; Epidermal barrier; Filaggrin; β-adrenergic signaling.


Figures

Figure 1
Figure 1
Impaired epidermal barrier leads to an increased metabolic rate at room temperature. (A) Energy expenditure at 22 °C of the wild-type (WT) and ACBP−/− mice housed in metabolic cages (n = 6 per group, average of 3 days, two-way ANOVA). (B) RQ at 22 °C of the WT and ACBP−/− mice housed in metabolic cages (n = 6 per group, average of 3 days, two-way ANOVA). (C) Food intake at 22 °C of the WT and ACBP−/− mice recorded over 3 days in metabolic cages (n = 6 per group, Student's t test). (D) Locomotor activity at 22 °C of the WT and ACBP−/− mice recorded over 3 days in metabolic cages (n = 6 per group, Student's t test). (E) Energy expenditure at 22 °C from the control and K14-ACBP−/− mice housed in metabolic cages (n = 6 per group, average of 3 days, two-way ANOVA). (F) RQ at 22 °C of the control and K14-ACBP−/− mice housed in metabolic cages (n = 6 per group, average of 3 days, two-way ANOVA). (G) Food intake at 22 °C of the control and K14-ACBP−/− mice recorded over 3 days in metabolic cages (n = 6 per group, Student's t test). (H) Locomotor activity at 22 °C of the WT and K14-ACBP−/− mice recorded over 3 days in metabolic cages (n = 6 per group, Student's t test). (I) Energy expenditure at 22 °C of the WT and ma/ma Flgft/ft mice housed in metabolic cages (n = 8 per group, average of 3 days, two-way ANOVA). (J) RQ at 22 °C of the WT and ma/ma Flgft/ft mice housed in metabolic cages (n = 8 per group, average of 3 days, two-way ANOVA). (K) Food intake at 22 °C of the WT and ma/ma Flgft/ft mice recorded over 3 days in metabolic cages (n = 8 per group, Student's t test). (L) Locomotor activity at 22 °C of the WT and ma/ma Flgft/ft mice recorded over 3 days in metabolic cages (n = 8 per group, Student's t test). Data are presented as the mean of individuals in each group ±SEM. ∗p < 0.05, ∗∗p < 0.01, and ∗∗∗p < 0.001.
Figure 2
Figure 2
Disruption of ACBP in the skin induces browning of white adipose tissue. (A) mRNA levels of Ucp1, Elovl3, Dio2, Cidea, Cpt1, Adrb3, Ppara, and Pgc1a in iWAT of the WT and ACBP−/− mice housed at 22 °C (n = 12 per group, Student's t test). Data are presented as the mean of individuals in each group ±SEM. ∗p < 0.05 and ∗∗p < 0 .01. (B) mRNA levels of Ucp1, Elovl3, Dio2, Cidea, Cpt1, Adrb3, Ppara, and Pgc1a in iWAT of the control and K14-ACBP−/− mice housed at 22 °C (n = 12 per group, Student's t test). Data are presented as the mean of individuals in each group ±SEM. ∗p < 0.05 and ∗∗p < 0.01. (C) mRNA levels of Ucp1, Elovl3, Dio2, Cidea, Cpt1, Adrb3, Ppara, and Pgc1a in iWAT of the wild-type and ma/ma Flgft/ft mice housed at 22 °C (n = 12 per group, Student's t test). Data are presented as the mean of individuals in each group ±SEM. ∗p < 0.05 and ∗∗p < 0.01. (D) UCP1 expression determined by Western blotting of iWAT from the wild-type, ACBP−/−, K14-ACBP−/−, and ma/ma Flgft/ft mice housed at 4 °C for 3 days. Extracts from iWAT from four individual mice were pooled, analyzed by Western blotting, and probed for UCP1 (upper panel) and β-actin (lower panel). (E) Representative UCP1 immunostaining of iWAT from the control (upper) and ACBP−/− mice (lower) housed at 22 °C or 4 °C for 3 days at 10x magnification. Scale bars are 100 μm and each image represents 3 individuals. (F) Representative UCP1 immunostaining of iWAT from the control (upper) and K14-ACBP−/− mice (lower) housed at 22 °C or 4 °C for 3 days at 10x magnification. Scale bars are 100 μm and each image represents 3 individuals. (G) Representative UCP1 immunostaining of iWAT from the control (upper) and ma/ma Flgft/ft mice (lower) housed at 22 °C or 4 °C for 3 days at 10x magnification. Scale bars are 100 μm and each image represents 3 individuals.
Figure 3
Figure 3
Thermoneutrality rescues energy homeostasis in mice with compromised epidermal barriers. (A) Energy expenditure at 30 °C of the WT and ACBP−/− mice housed in metabolic cages (n = 6 per group, average of 3 days, two-way ANOVA). (B) RQ at 30 °C of the WT and ACBP−/− mice housed in metabolic cages (n = 6 per group, average of 3 days, two-way ANOVA). (C) Food intake at 30 °C of the WT and ACBP−/− mice recorded over 3 days in metabolic cages (n = 6 per group, Student's t test). (D) Locomotor activity at 30 °C of the WT and ACBP−/− mice recorded over 3 days in metabolic cages (n = 6 per group, Student's t test). (E) Energy expenditure at 30 °C of the control and K14-ACBP−/− mice housed in metabolic cages (n = 6 per group, average of 3 days, two-way ANOVA). (F) RQ at 30 °C of the control and K14-ACBP−/− mice housed in metabolic cages (n = 6 per group, average of 3 days, two-way ANOVA). (G) Food intake at 30 °C of the control and K14-ACBP−/− mice recorded over 3 days in metabolic cages (n = 6 per group, Student's t test). (H) Locomotor activity at 30 °C of the WT and K14-ACBP−/− mice recorded over 3 days in metabolic cages (n = 6 per group, Student's t test). (I) Energy expenditure at 30 °C of the WT and ma/ma Flgft/ft mice housed in metabolic cages (n = 8 per group, average of 3 days, two-way ANOVA). (J) RQ at 30 °C of the WT and ma/ma Flgft/ft mice housed in metabolic cages (n = 8 per group, average of 3 days, two-way ANOVA). (K) Food intake at 30 °C of the WT and ma/ma Flgft/ft mice recorded over 3 days in metabolic cages (n = 8 per group, Student's t test). (L) Locomotor activity at 30 °C of the WT and ma/ma Flgft/ft mice recorded over 3 days in metabolic cages (n = 8 per group, Student's t test). Data are presented as the mean of individuals in each group ±SEM. ∗p < 0.05, ∗∗p < 0.01, and ∗∗∗p < 0.001.
Figure 4
Figure 4
Blocking β-adrenergic signaling prevents browning of inguinal white adipose tissue in ACBP knockout mice. (A) mRNA levels of Ucp1, Elovl3, Dio2, Cidea, Cpt1, Adrb3, Ppara, and Pgc1a in iWAT of the WT and ACBP−/− mice housed at 30 °C (n = 7–8 per group, Student's t test). Data are presented as the mean of individuals in each group ± SEM. (B) mRNA levels of Ucp1, Elovl3, Dio2, Cidea, Cpt1, Adrb3, Ppara, and Pgc1a in iWAT of the WT and K14-ACBP−/− mice housed at 30 °C (n = 7–8 per group, Student's t test). Data are presented as the mean of individuals in each group ± SEM. (C) mRNA levels of Ucp1, Elovl3, Dio2, Cidea, Cpt1, Adrb3, Ppara, and Pgc1a in iWAT of the WT and ma/ma Flgft/ft mice housed at 30 °C (n = 7–8 per group, Student's t test). Data are presented as the mean of individuals in each group ± SEM. (D) mRNA levels of Ucp1, Dio2, Cidea, Cpt1, Adrb3, Ppara, and Pgc1a in iWAT of the control or propranolol-injected WT and ACBP−/− mice housed at 22 °C (n = 5–9 per group, Student's t test). Data are presented as the mean of individuals in each group ±SEM. ∗p < 0.05 and ∗∗p < 0 .01 between the ACBP−/− mice ± propranolol. (E) mRNA levels of Ucp1, Dio2, Cidea, Cpt1, Adrb3, Ppara, and Pgc1a in iWAT of the control or propranolol-injected control and K14-ACBP−/− mice housed at 22 °C (n = 5–9 per group, Student's t test). Data are presented as the mean of individuals in each group ± SEM. (F) mRNA levels of Ucp1, Dio2, Cidea, Cpt1, Adrb3, Ppara, and Pgc1a in iWAT of the control or propranolol-injected wild-type and ma/ma Flgft/ft mice housed at 22 °C (n = 5–9 per group, Student's t test). Data are presented as the mean of individuals in each group ± SEM.
Figure 5
Figure 5
Impaired epidermal barriers protect mice against diet-induced obesity and glucose intolerance. (A) The WT and ACBP−/− mice were fed SC or HFD for 12 weeks. Food intake was determined every week for 12 weeks. (B) The WT and ACBP−/− mice were fed SC or HFD for 12 weeks. The mice were weighed every week and the percentage weight gain was plotted. Two-way ANOVA with multiple comparisons was applied. (C) The WT and ACBP−/− mice were fed SC or HFD for 12 weeks. Fasting blood glucose was determined prior to administration of 1.5 g/kg of glucose to each mouse by oral gavage and blood glucose was determined every 15 min for a period of 2 h. (D) The control and K14-ACBP−/− mice were fed SC or HFD for 12 weeks. Food intake was determined every week for 12 weeks. (E) The control and K14-ACBP−/− mice were fed SC or HFD for 12 weeks. The mice were weighed every week and the percentage weight gain was plotted. Two-way ANOVA with multiple comparisons was applied. (F) The control and K14-ACBP−/− mice were fed SC or HFD for 12 weeks. Fasting blood glucose was determined prior to administration of 1.5 g/kg of glucose to each mouse by oral gavage and blood glucose was determined every 15 min for a period of 2 h. (G) The WT and ma/ma Flgft/ft mice were fed SC or HFD for 12 weeks. Food intake was determined every week for 12 weeks. (H) The WT and ma/ma Flgft/ft mice were fed SC or HFD for 12 weeks. The mice were weighed every week and the percentage weight gain was plotted. Two-way ANOVA with multiple comparisons was applied. (I) The WT and ma/ma Flgft/ft mice were fed SC or HFD for 12 weeks. Fasting blood glucose was determined prior to administration of 1.5 g/kg of glucose to each mouse by oral gavage and blood glucose was determined every 15 min for a period of 2 h. All of the data are presented as the mean of individuals in each group (n = 8) ± SEM. ∗p < 0.05, ∗∗p < 0.01, and ∗∗∗p < 0.001.
Figure 6
Figure 6
Impaired epidermal barrier protects mice against diet-induced hyperinsulinemia. (A) Plasma insulin levels in the WT and ACBP−/− mice fed either SC or HFD for 12 weeks. (B) Plasma leptin levels in the WT and ACBP−/− mice fed either SC or HFD for 12 weeks. (C) Plasma insulin levels in the control and K14-ACBP−/− mice fed either SC or HFD for 12 weeks. (D) Plasma leptin levels in the control and K14-ACBP−/− mice fed either SC or HFD for 12 weeks. (E) Plasma insulin levels in the WT and ma/ma Flgft/ft mice fed either SC or HFD for 12 weeks. (F) Plasma leptin levels in the WT and ma/ma Flgft/ft mice fed either SC or HFD for 12 weeks. All of the data are presented as the mean of individuals in each group (n = 8) ± SEM. ∗p < 0.05, ∗∗p < 0.01, and ∗∗∗p < 0.001.

Similar articles

Cited by

References

    1. Feingold K.R., Denda M. Regulation of permeability barrier homeostasis. Clinical Dermatology. 2012;30(3):263–268. - PubMed
    1. Kruse V., Neess D., Faergeman N.J. The significance of epidermal lipid metabolism in whole-body physiology. Trends in Endocrinology and Metabolism. 2017;28(9):669–683. - PubMed
    1. Natsuga K. Epidermal barriers. Cold Spring Harbor PErspectives in Medicine. 2014;4(4) - PMC - PubMed
    1. Sampath H., Flowers M.T., Liu X., Paton C.M., Sullivan R., Chu K. Skin-specific deletion of steaCold Spring Harbor Perspectives in Medicineroyl-CoA desaturase-1 alters skin lipid composition and protects mice from high fat diet-induced obesity. Journal of Biological Chemistry. 2009;284(30):19961–19973. - PMC - PubMed
    1. Westerberg R., Tvrdik P., Unden A.B., Mansson J.E., Norlen L., Jakobsson A. Role for ELOVL3 and fatty acid chain length in development of hair and skin function. Journal of Biological Chemistry. 2004;279(7):5621–5629. - PubMed

Publication types