. 2021 Mar;23(3):310-322.
doi: 10.1016/j.jmoldx.2020.11.009. Epub 2020 Dec 18.

Rapid EGFR Mutation Detection Using the Idylla Platform: Single-Institution Experience of 1200 Cases Analyzed by an In-House Developed Pipeline and Comparison with Concurrent Next-Generation Sequencing Results

Affiliations

Rapid EGFR Mutation Detection Using the Idylla Platform: Single-Institution Experience of 1200 Cases Analyzed by an In-House Developed Pipeline and Comparison with Concurrent Next-Generation Sequencing Results

Amir Momeni-Boroujeni et al. J Mol Diagn. 2021 Mar.

Abstract

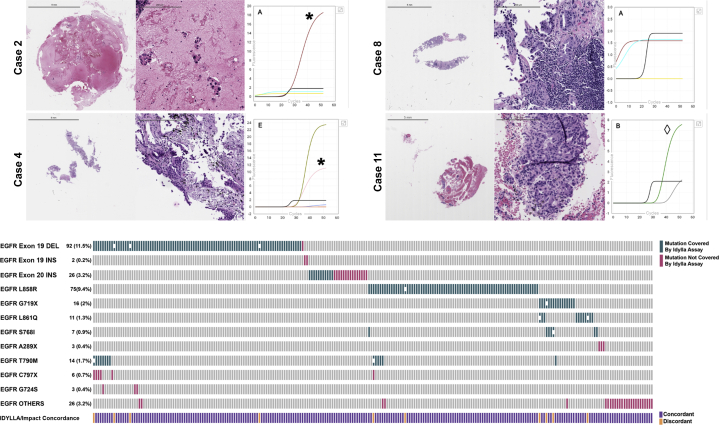
Mutations in the epidermal growth factor receptor (EGFR) are the most common targetable alterations in lung adenocarcinoma. To facilitate rapid testing, the Idylla EGFR assay was incorporated as a screening method before next-generation sequencing (NGS). Validation and experience using an in-house developed analysis pipeline, enhanced with a manual review algorithm is described. Results are compared with corresponding NGS results. In all, 1249 samples were studied. Validation demonstrated 98.57% (69/70) concordance with the reference methods. The limit of detection varied from 2% to 5% variant allele frequency for total EGFR quantitation cycle between 20 and 23. Of the 1179 clinical cases, 23.41% were EGFR-positive by Idylla. Concurrent NGS was successfully performed on 94.9% (799/842) requests. Concordance of Idylla with NGS was 98.62% (788/799) and 98.50% (787/799) using our in-house and Idylla analysis pipelines, respectively. Discordances involved missed mutations by both assays associated with low tumor/low input. Incorporating a manual review algorithm to supplement automated calls improved accuracy from 98.62% to 99.37% and sensitivity from 94.68% to 97.58%. Overall reporting time, from receipt of material to official clinical report, ranged from 1 to 3 days. Therefore, Idylla EGFR testing enables rapid and sensitive screening without compromising subsequent comprehensive NGS, when required. Automated calling, enhanced with a manual review algorithm, reduces false-negative calls associated with low tumor/low input samples.


Figures

Figure 1
Figure 1
A: Quantitative real-time PCR (qPCR) amplification curve illustrates the variables extracted by the in-house analysis pipeline through analysis of raw data from the Idylla Biocartis console. Time-series analysis tools are used to determine five parameters: quantification cycle (CQ) values for epidermal growth factor receptor (EGFR) total (internal control) and EGFR variant (mutation), ΔCQ (difference between CQs), senslope (slope of phase 2 of the qPCR curve), Δμ (total shift in fluorescence from baseline to highest signal), and plateauCV (CV in plateau phase). B: The Idylla assay has significant variability in the shape of the qPCR curves, depending on the specific mutation across different chambers. Various combinations of the curve characteristics are utilized for variant calling. The chart depicts the variables that contribute to variant calls based on mutation. C: Representative heat map, showing hierarchical clustering results for the EGFR L858R mutation analysis. The values used are normalized and centered to allow cross-parameter comparisons. The heat map is used to show that the variables used in the in-house pipeline truly contribute to the distinction between mutated and unmutated samples; the heat map shows that the main contributors to L858R mutated samples are the senslope, Δμ, and breakscore of chamber D, detection channel 2. All mutated L858R samples have low plateauCV, indicating that almost all of the mutated samples have amplification curves that plateau, as expected.
Figure 2
Figure 2
A: Results of the minimum input study to assess the detection of various mutations at 5% variant allele frequency (VAF; Horizon control HD777). DNA input shown on the y axis; corresponding epidermal growth factor receptor (EGFR) total quantification cycle (CQ) shown on the x axis. As expected, the EGFR total CQ increases with decreasing DNA input and shows a reverse exponential correlation (R2 = 0.97). The assay shows differential sensitivity, depending on the mutation and chamber. When total EGFR CQ is <23 (correlating with >50-ng input; low-quality sample), all mutations can be detected. Detection capability is sequentially lost as total EGFR CQ increases to >23 (lower input). The highest sensitivity is seen for exon 19 15-bp deletion, which is consistently detected with total EGFR CQ >27 (10-ng input). The control sample used in this experiment is a cell-free DNA-like sample (construct of a highly fragmented DNA, where 50-ng input corresponds to a total CQ of 23; however, if genomic or nonfragmented DNA is used, 50-ng DNA load corresponds to total CQ of 20 to 21). B: Interinstrument reproducibility: Results of a double-mutant sample run across eight different instruments are shown (raw nonnormalized data). Changes in fluorescence (y axis) and amplification cycle (x axis) for mutation G719S, exon 19 deletion, and internal control of EGFR are depicted. Although larger variations of overall fluorescence (Δμ) are observed, the total EGFR CQ and ΔCQs for the mutations remain constant, with less than one cycle difference across different instruments. With a fixed total input of 50 ng, total EGFR CQ was on average 21.95 (SD, 0.15). As proportion of tumor decreases, ΔCQ for each mutation increases, but the mutation can be called down to the 3% dilution with both L858R and EGFR exon 19 15-bp mutations present approximatively 1.5% variant allele frequency (VAF). The T790M mutation is not detectable at the 3% dilution (2% VAF) and below. C and D: Limit-of-detection study: Dilution series of a triple-positive control sample diluted with wild-type DNA, performed using 50-ng total input. With 400-ng input, the total EGFR CQ was on average 18.79 (SD, 0.07), and limit of detection for T790M improves to a VAF of approximately 1.5% and to 0.5% for the other mutations (C). Green circles show mutations that were called by the Idylla-Biocartis pipeline, and red circles show mutations that were missed. Asterisks denote mutations that were detected by the in-house pipeline but was missed by Idylla-Biocartis pipeline.
Figure 3
Figure 3
A: Sunburst plot showing the distribution of the 298 epidermal growth factor receptor (EGFR) mutation calls in the 276 samples with mutated EGFR. The numbers in parenthesis indicate the total number of cases for each category. B: Three-dimensional scattergram, showing the corresponding in-house pipeline Δ quantification cycle (ΔCQ) and EGFR total CQ calls versus variant allele frequency of EGFR mutations for all EGFR mutations detected by the next-generation sequencing panel. The dark red dots depict mutations not called by either pipeline, yellow dots mark mutations called by in-house pipeline and not called by Idylla Explore, and gray dots show mutations called by both pipelines. C: Venn diagram comparing the EGFR mutation calls by NGS platform, Idylla pipeline, and in-house pipeline. The number of samples for each category is shown, with the number of mutations in each category shown in parenthesis.
Figure 4
Figure 4
Top panels: The histology and Idylla amplification curves corresponding to four representative discordant cases between Idylla and next-generation sequencing (NGS). In the panels with amplification curves, the letters at the top left corner refer to the cartridge chamber. Amplification curves, marked by asterisks, represent suspicious curves that prompted confirmatory testing, and the curves marked by diamonds represent curves called by the in-house pipeline and missed by Idylla pipeline. Case 8 shows a case with adequate tissue input and a false-negative result due to marked inflammatory infiltrate. Further details of all discordant cases are provided in Supplemental Table S6 and Supplemental Figure S2. Bottom panel: The oncoplot corresponding to epidermal growth factor receptor (EGFR) mutations identified by NGS in the 799 samples that were subjected to both Idylla and NGS assays. The mutations covered by Idylla are in green, and discordances are marked by small white squares. Details of mutations detected by NGS and not covered by Idylla are summarized in Supplemental Table S5. Scale bars: 5 mm (top left panels); 200 μm (top right panels).
Figure 5
Figure 5
Workflow for evaluation of lung adenocarcinoma samples using the Idylla epidermal growth factor receptor (EGFR) assay. ∗For guidelines regarding suspicious/equivocal curves, review Table 2. CQ, quantification cycle; FFPE, formalin fixed, paraffin embedded.
Supplemental Figures S1
AG: Representative heat maps based on hierarchical clustering results for the epidermal growth factor receptor (EGFR) target mutations based for the training and test set. The values used are normalized and centered to allow cross-parameter comparisons. The heat maps are used to show that the variables used in the in-house pipeline truly contribute to the distinction between mutated and unmutated samples. A: Heat map of EGFR exon 19 deletions shows that the main contributors to del 18-bp mutated samples are the senslope, Δμ, and breakscore of the chamber C, detection channel 1. This heat map also shows that presence of an exon 19 deletion leads to amplification curves in other exon 19 deletion targets and, as a result, reporting of the Idylla EGFR exon 19 deletion is best done as a general exon 19 deletion without mentioning specific mutation or, alternatively, the target with the smallest ΔCQ can be reported. B: Heat map of EGFR L858R mutation shows that the main contributors for mutation calling are senslope, Δμ, and breakscore of the chamber D detection channel 2. In addition, all mutated L858R samples have low plateauCV, indicating that almost all of the mutated samples have amplification curves that plateau as expected. C: Heat map of EGFR exon 20 insertions shows the main contributors are the senslope and Δμ of the chamber a, detection channel 4. D: Heat map of EGFR T790M mutation shows main contributors to be senslope, Δμ, and breakscore of the chamber C, detection channel 3. Although most EGFR T790M mutated samples have typical amplification curves, a subset shows low amplitude and senslope and the amplification curve does not plateau (lowest row of the heat map); these samples usually have low variant allele frequency T790M mutations and lead to false-negative results by the Idylla assay. E: Heat map of EGFR L861Q mutation shows that the main contributors to L861Q mutated samples are the senslope, Δμ, and breakscore of the chamber a, detection channel 2. F: Heat map of EGFR G719A/C/S mutation. Main contributors to G719S samples are the senslope, Δμ, and breakscore of the chamber a, detection channel 3. The presence of any of the G719A/C/S mutations may lead to amplification curves in other G719A/C/S targets and, as a result, reporting of these mutations is best done as a general category of mutations involving codon G719 without specification of the change. Alternatively, the target with the smallest ΔCQ can be reported. G: Heat map of EGFR S768I mutation. The main contributors to mutation calling of the S768I mutated samples are the senslope and Δμ of the chamber E, detection channel 2. The breakscore of EGFR S768I mutated samples is relatively low, which is related to our observation that in the Idylla EGFR assay, the amplification curve for EGFR S768I sample may not conform to a sigmoidal pattern and may cause confusion in manual review of the amplification curves or lead to false-negative calls.
Supplemental Figure S2
The histology and Idylla amplification curves corresponding to seven of the discordant cases between Idylla and next-generation sequencing are shown. In the panels with amplification curves, the letters at the top left corner refer to the cartridge chamber. Amplification curves, marked by asterisks, represent suspicious curves that prompted confirmatory testing, and the curves marked by diamonds represent curves called by the in-house pipeline and missed by Idylla pipeline. For case 5, Idylla assay was performed on pleural fluid and no corresponding histology was available. The details of these cases are provided in Supplemental Table S6. Scale bars: 2 mm (left panels, Cases 3, 6, and 9); 2.5 mm (left panel, Case 10); 5 mm (left panels, Cases 1 and 7); 200 μm (right panels, Cases 1, 3, 6, 7, 9, and 10).
Supplemental Figure S3
Correlation of variant allele frequency (VAF) with deltaCQ for EGFR L858R mutation (top row) and exon 19 deletions (bottom row). Regression charts are shown in the left column. Charts in the right column show differences in VAF based on a binarized deltaCQ (cutoff for high deltaCQ for L858R: 3; and for exon 19 del: 5). Red line and red cross represent the median and mean, respectively. P values are significant at level α = 0.05. Conf., confidence; Obs, observed.

References

    1. Jordan E.J., Kim H.R., Arcila M.E., Barron D., Chakravarty D., Gao J., Chang M.T., Ni A., Kundra R., Jonsson P. Prospective comprehensive molecular characterization of lung adenocarcinomas for efficient patient matching to approved and emerging therapies. Cancer Discov. 2017;7:596–609. - PMC - PubMed
    1. Lohinai Z., Hoda M.A., Fabian K., Ostoros G., Raso E., Barbai T., Timar J., Kovalszky I., Cserepes M., Rozsas A., Laszlo V., Grusch M., Berger W., Klepetko W., Moldvay J., Dome B., Hegedus B. Distinct epidemiology and clinical consequence of classic versus rare EGFR mutations in lung adenocarcinoma. J Thorac Oncol. 2015;10:738–746. - PubMed
    1. Dogan S., Shen R., Ang D.C., Johnson M.L., D'Angelo S.P., Paik P.K., Brzostowski E.B., Riely G.J., Kris M.G., Zakowski M.F., Ladanyi M. Molecular epidemiology of EGFR and KRAS mutations in 3,026 lung adenocarcinomas: higher susceptibility of women to smoking-related KRAS-mutant cancers. Clin Cancer Res. 2012;18:6169–6177. - PMC - PubMed
    1. Shi Y., Au J.S., Thongprasert S., Srinivasan S., Tsai C.M., Khoa M.T., Heeroma K., Itoh Y., Cornelio G., Yang P.C. A prospective, molecular epidemiology study of EGFR mutations in Asian patients with advanced non-small-cell lung cancer of adenocarcinoma histology (PIONEER) J Thorac Oncol. 2014;9:154–162. - PMC - PubMed
    1. Lindeman N.I., Cagle P.T., Aisner D.L., Arcila M.E., Beasley M.B., Bernicker E.H., Colasacco C., Dacic S., Hirsch F.R., Kerr K., Kwiatkowski D.J., Ladanyi M., Nowak J.A., Sholl L., Temple-Smolkin R., Solomon B., Souter L.H., Thunnissen E., Tsao M.S., Ventura C.B., Wynes M.W., Yatabe Y. Updated molecular testing guideline for the selection of lung cancer patients for treatment with targeted tyrosine kinase inhibitors: guideline from the College of American Pathologists, the International Association for the Study of Lung Cancer, and the Association for Molecular Pathology. J Mol Diagn. 2018;20:129–159. - PubMed

Publication types

MeSH terms