Might changes in diagnostic practice explain increasing incidence of brain and central nervous system tumors? A population-based study in Wales (United Kingdom) and the United States
- PMID: 33346342
- PMCID: PMC8168824
- DOI: 10.1093/neuonc/noaa282
Might changes in diagnostic practice explain increasing incidence of brain and central nervous system tumors? A population-based study in Wales (United Kingdom) and the United States
Abstract
Background: Increasing incidence of central nervous system (CNS) tumors has been noted in some populations. However, the influence of changing surgical and imaging practices has not been consistently accounted for.
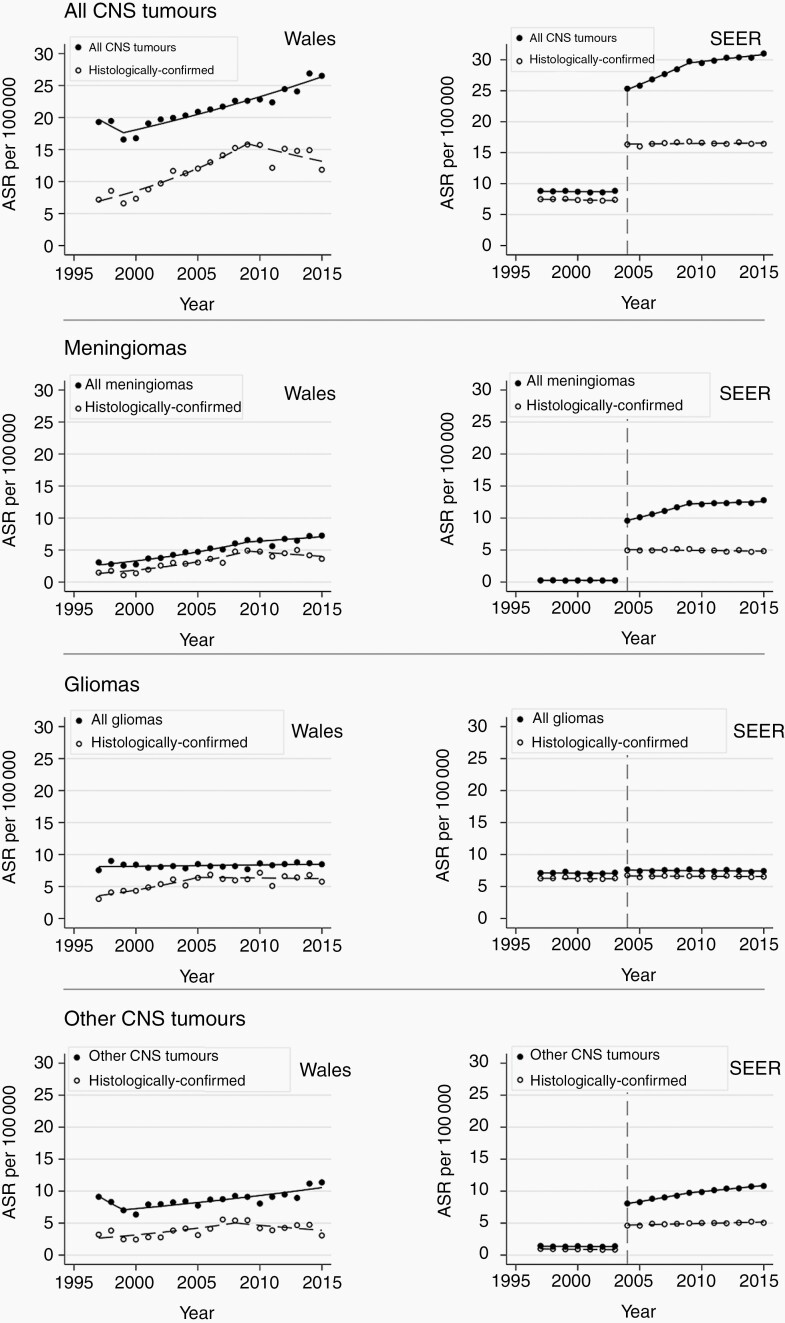
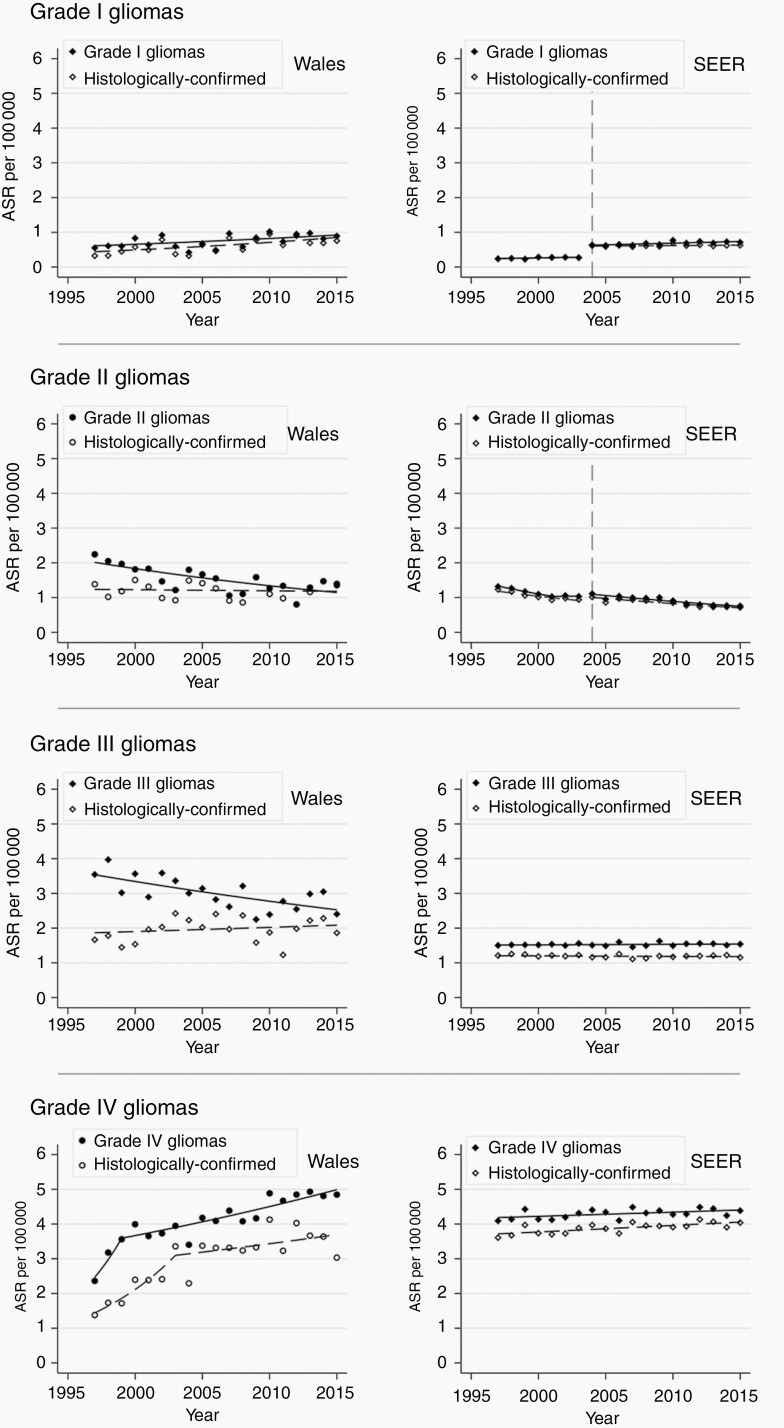
Methods: We evaluated average annual percentage change (AAPC) in age- and gender-stratified incidence of CNS tumors by tumor subtypes and histological confirmation in Wales, United Kingdom (1997-2015) and the United States (2004-2015) using joinpoint regression.
Findings: In Wales, the incidence of histologically confirmed CNS tumors increased more than all CNS tumors (AAPC 3.62% vs 1.63%), indicating an increasing proportion undergoing surgery. Grade II and III glioma incidence declined significantly (AAPC -3.09% and -1.85%, respectively) but remained stable for those with histological confirmation. Grade IV glioma incidence increased overall (AAPC 3.99%), more markedly for those with histological confirmation (AAPC 5.36%), suggesting reduced glioma subtype misclassification due to increased surgery. In the United States, the incidence of CNS tumors increased overall but was stable for histologically confirmed tumors (AAPC 1.86% vs 0.09%) indicating an increase in patients diagnosed without surgery. An increase in grade IV gliomas (AAPC 0.28%) and a decline in grade II gliomas (AAPC -3.41%) were accompanied by similar changes in those with histological confirmation, indicating the overall trends in glioma subtypes were unlikely to be caused by changing diagnostic and clinical management.
Conclusions: Changes in clinical practice have influenced the incidence of CNS tumors in the United Kingdom and the United States. These should be considered when evaluating trends and in epidemiological studies of putative risk factors for CNS tumors.
Keywords: cancer registry; epidemiology; incidence; population-based; trends.
© The Author(s) 2020. Published by Oxford University Press on behalf of the Society for Neuro-Oncology. All rights reserved. For permissions, please e-mail: journals.permissions@oup.com.
Figures