. 2021 Jun 11;7(6):1389-1408.
doi: 10.1021/acsinfecdis.0c00349. Epub 2020 Dec 21.

The SARS-CoV-2 Cytopathic Effect Is Blocked by Lysosome Alkalizing Small Molecules

Affiliations

The SARS-CoV-2 Cytopathic Effect Is Blocked by Lysosome Alkalizing Small Molecules

Kirill Gorshkov et al. ACS Infect Dis. .

Abstract

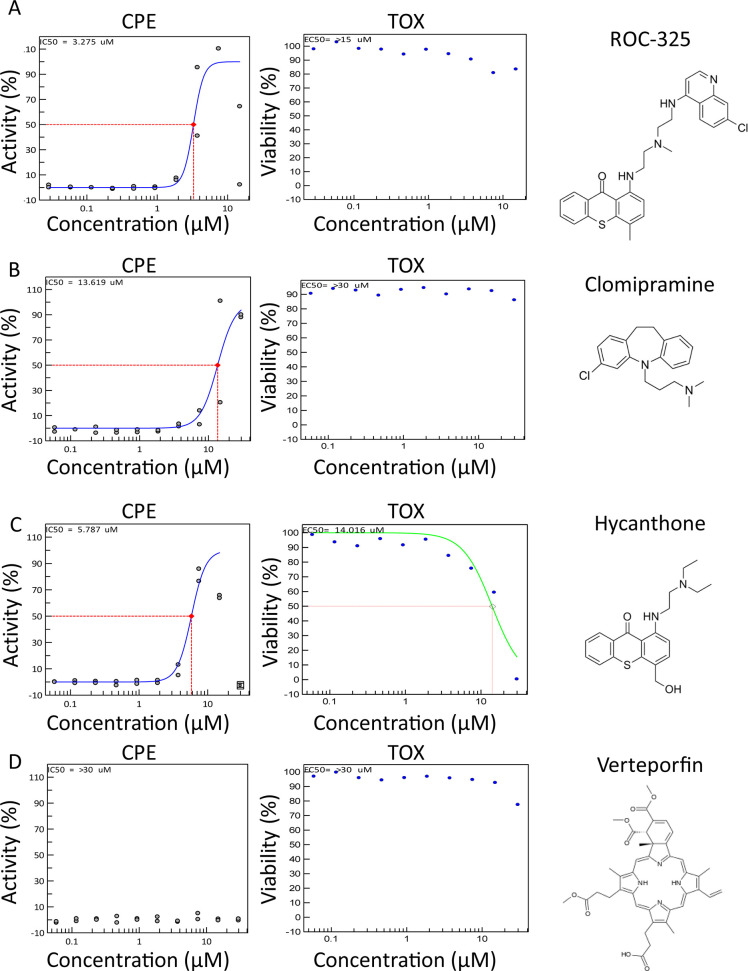
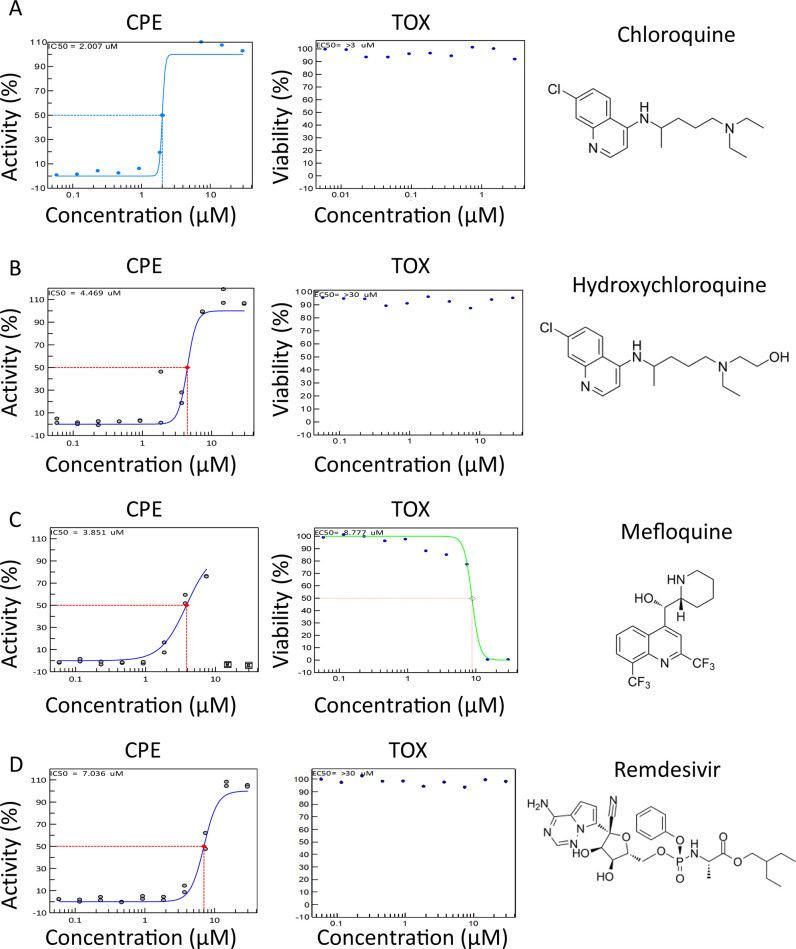
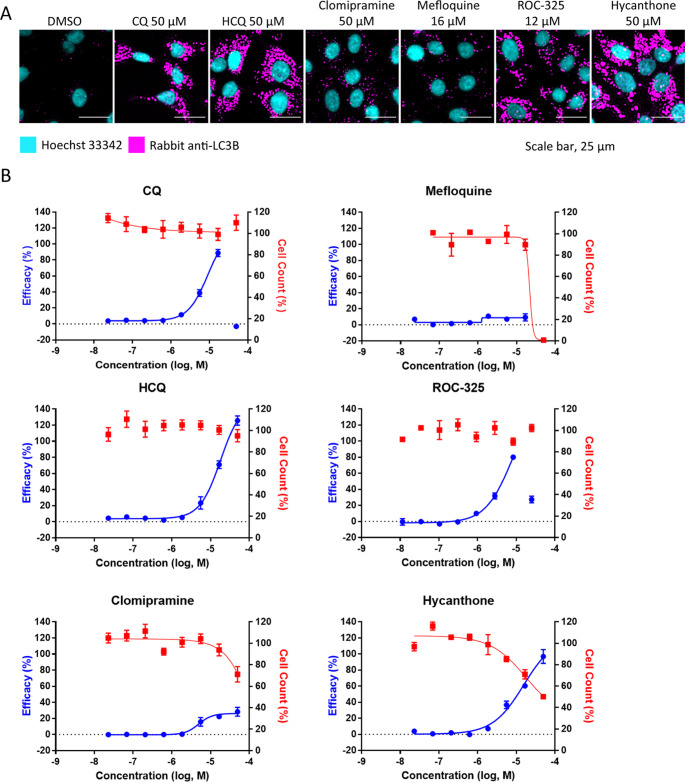
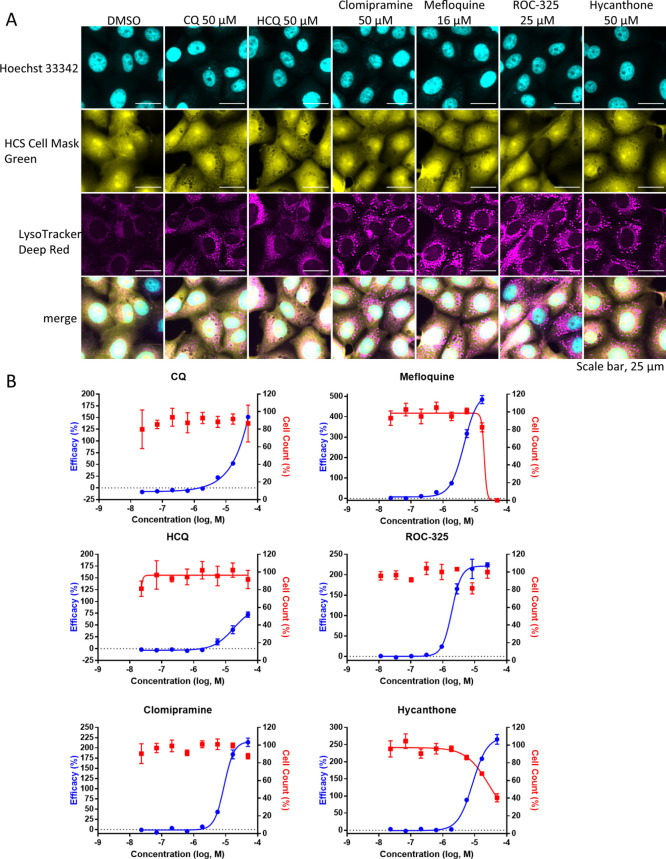
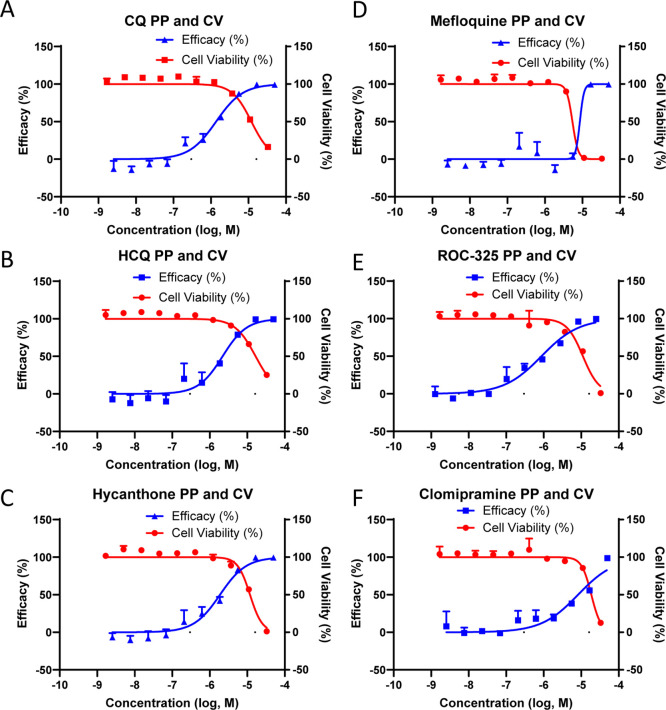
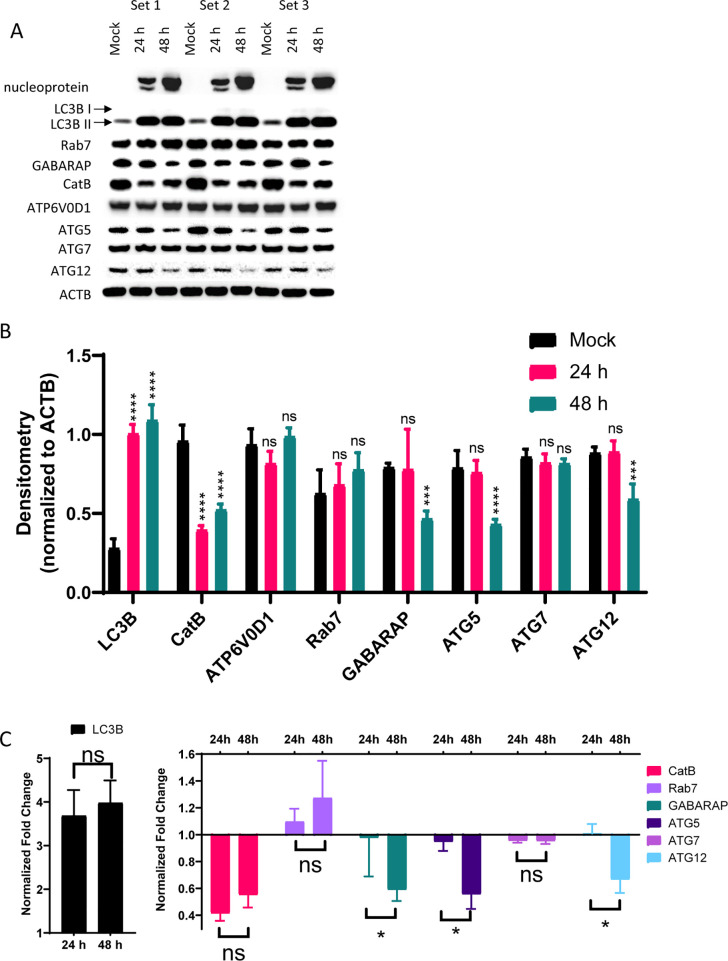
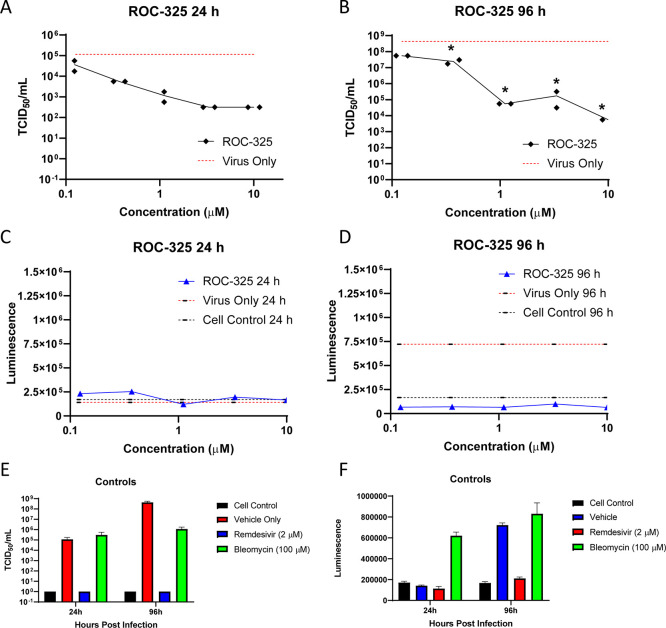
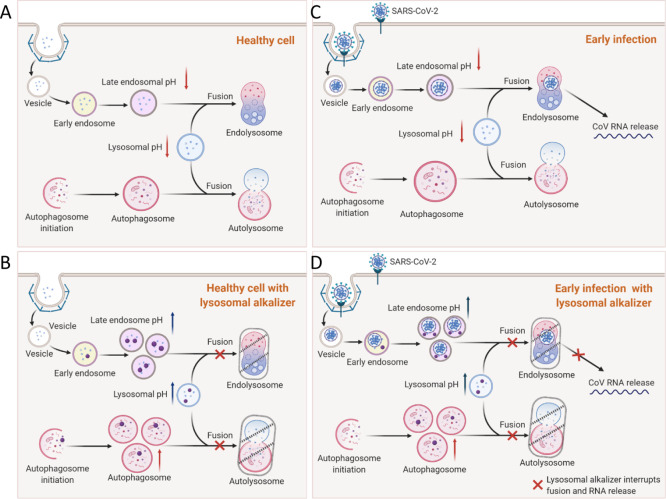
Understanding the SARS-CoV-2 virus' pathways of infection, virus-host-protein interactions, and mechanisms of virus-induced cytopathic effects will greatly aid in the discovery and design of new therapeutics to treat COVID-19. Chloroquine and hydroxychloroquine, extensively explored as clinical agents for COVID-19, have multiple cellular effects including alkalizing lysosomes and blocking autophagy as well as exhibiting dose-limiting toxicities in patients. Therefore, we evaluated additional lysosomotropic compounds to identify an alternative lysosome-based drug repurposing opportunity. We found that six of these compounds blocked the cytopathic effect of SARS-CoV-2 in Vero E6 cells with half-maximal effective concentration (EC50) values ranging from 2.0 to 13 μM and selectivity indices (SIs; SI = CC50/EC50) ranging from 1.5- to >10-fold. The compounds (1) blocked lysosome functioning and autophagy, (2) prevented pseudotyped particle entry, (3) increased lysosomal pH, and (4) reduced (ROC-325) viral titers in the EpiAirway 3D tissue model. Consistent with these findings, the siRNA knockdown of ATP6V0D1 blocked the HCoV-NL63 cytopathic effect in LLC-MK2 cells. Moreover, an analysis of SARS-CoV-2 infected Vero E6 cell lysate revealed significant dysregulation of autophagy and lysosomal function, suggesting a contribution of the lysosome to the life cycle of SARS-CoV-2. Our findings suggest the lysosome as a potential host cell target to combat SARS-CoV-2 infections and inhibitors of lysosomal function could become an important component of drug combination therapies aimed at improving treatment and outcomes for COVID-19.

Keywords: SARS-CoV-2; autophagy; coronavirus; cytopathic effect; small molecule inhibitors.


Conflict of interest statement

The authors declare no competing financial interest.

Figures

Figure 1
Figure 1
CPE activity and toxicity for ROC-325, clomipramine, hycanthone, and verteporfin. (A) ROC-325, (B) clomipramine, (C) hycanthone, and (D) verteporfin CPE activity (blue curve, left graph) and toxicity (green curve, right graph) in 10 point, 1:2 dilution concentration–response curves starting at 30.0 μM down to 2.29 nM, along with their structures. ROC-325 started at 15 μM down to 1.14 nM. The red dashed line indicates EC50 or CC50 for CPE and toxicity assays, respectively. Duplicate values are shown for each concentration. Curves were generated using nonlinear regression.
Figure 2
Figure 2
CPE activity and toxicity for CQ, HCQ, mefloquine, and remdesivir. (A) CQ, (B) HCQ, (C) mefloquine, and (D) remdesivir CPE activity (blue curve, left graph) and toxicity (green curve, right graph) in 10 point, 1:2 dilution concentration–response curves starting at 30.0 μM down to 2.29 nM, along with their structures. The dashed line indicates EC50 or CC50 for CPE and toxicity assays, respectively. Duplicate values are shown for each concentration. Curves were generated using nonlinear regression.
Figure 3
Figure 3
Autophagy inhibition assay using LC3B immunostaining in Vero E6 cells. (A) Image montage of DMSO, CQ, HCQ, clomipramine, mefloquine, ROC-325, and hycanthone stained with Hoechst 33342 (cyan) and LC3B (magenta). CQ and HCQ images were taken from wells in positive control column 2. Scale bar, 25 μm. (B) 8 point, 1:3 dilution concentration–response curves starting at 50 μM down to 0.023 μM for compounds in (A). The blue curve indicates the efficacy in LC3B accumulation (increase in spot count), and the red curve indicates cell counts. The efficacy data was normalized to DMSO (0%) and CQ (100%). Cell count data was normalized to DMSO (100%) and 0 (no cells 0%). Error bars indicate SD. N = 3 intraplate replicates. Curves were generated using nonlinear regression.
Figure 4
Figure 4
LysoTracker Deep Red staining in Vero E6 cells. (A) Image montage of DMSO, CQ, HCQ, clomipramine, mefloquine, ROC-325, and hycanthone stained with Hoechst 33342 (cyan), HCS Cell Mask Green (yellow), and LysoTracker Deep Red (magenta). CQ and HCQ images were taken from wells in positive control column 2. Scale bar, 25 μm. (B) 8 point, 1:3 dilution concentration–response curves starting at 50 μM down to 0.023 μM for the compounds in (A). The blue curve indicates efficacy, and the red curve indicates cell counts. Efficacy data are normalized to DMSO (0%) and CQ (100%). Cell count data are normalized to DMSO (100%) and 0 (no cells 0%). Error bars indicate SD. N = 3 intraplate replicates. Curves were generated using nonlinear regression.
Figure 5
Figure 5
Compounds inhibit SARS-CoV-2 PP transduction of luciferase in ACE2-GFP HEK293T cells. Activity and cytotoxicity curves for (A) CQ, (B) HCQ, (C) hycanthone, (D) mefloquine, (E) ROC-325, and (F) clomipramine treated cells for 24 h followed by 48 h of transduction with PP. Curves were generated using nonlinear regression. Data are normalized to delEnv particles lacking the SARS-CoV-2 envelope protein (no transduction, 100%) and DMSO treated cells (0%). Error bars indicate SD. N = 3 triplicate wells in a 384-well plate.
Figure 6
Figure 6
SARS-CoV-2 blocks autophagic flux and reduces lysosomal protein expression. (A) Western blot densitometry for blots normalized to ACTB. (B) Densitometry normalized to the ACTB loading control for each blot (single blot shown). (C) Fold-change of samples normalized to mock infected samples. N = triplicate samples from separate wells per condition. ns, not significant; *, p < 0.05; **, p < 0.01; ***, p < 0.005; ****, p < 0.0001 according to two-way ANOVA with Dunnett’s (for B) or Tukey’s (for C) multiple comparison tests.
Figure 7
Figure 7
ROC-325 reduces viral load after 24 or 96 h of SARS-CoV-2 infection in the EpiAirway 3D lung tissue model. TCID50/mL measurements in a viral titer reduction assay for ROC-325 after (A) 24 h or (B) 96 h of SARS-CoV-2 infection. LDH luminescence values as a measure of cell viability for ROC-325 at (C) 24 h or (D) 96 h of SARS-CoV-2 infection. (E) TCID50/mL measurements in a viral titer reduction assay for the cell control (no virus), vehicle only, remdesivir, or bleomycin. (F) LDH luminescence values as a measure of cell viability for the cell control, vehicle, remdesivir, and bleomycin. ns, not significant; *, p < 0.05 according to a two-way ANOVA with Sidak’s multiple comparison test.
Figure 8
Figure 8
Illustration of lysosomotropic compounds and their blockade of endocytosis-dependent viral infection. (A) Healthy cells have normal autophagic flux, and the endocytic pathway is functional. (B) Lysosomal alkalizer treatments in healthy cells increase vesicular pH, causing a blockade of normal vesicle fusion and a buildup of endosomes and autophagosomes. (C) In the early stages of viral infection, endocytosis leads to the release of viral RNA after endosome lysosome fusion. (D) Lysosomal alkalizer compounds can block (red Xs) the fusion of endosomes with the lysosome to prevent the release of viral RNA and subsequent cell death.

Update of

References

    1. Yang X.; Yu Y.; Xu J.; Shu H.; Liu H.; Wu Y.; Zhang L.; Yu Z.; Fang M.; Yu T. (2020) Clinical course and outcomes of critically ill patients with SARS-CoV-2 pneumonia in Wuhan, China: a single-centered, retrospective, observational study. Lancet Respir. Med. 8, 475.10.1016/S2213-2600(20)30079-5. - DOI - PMC - PubMed
    1. Dong E.; Du H.; Gardner L. (2020) An interactive web-based dashboard to track COVID-19 in real time. Lancet Infect. Dis. 20, 533.10.1016/S1473-3099(20)30120-1. - DOI - PMC - PubMed
    1. Sanche S.; Lin Y. T.; Xu C.; Romero-Severson E.; Hengartner N.; Ke R. (2020) High Contagiousness and Rapid Spread of Severe Acute Respiratory Syndrome Coronavirus 2. Emerg. Infect. Dis. 26, 1470.10.3201/eid2607.200282. - DOI - PMC - PubMed
    1. Callaway E.; Cyranoski D.; Mallapaty S.; Stoye E.; Tollefson J. (2020) The coronavirus pandemic in five powerful charts. Nature 579 (7800), 482–483. 10.1038/d41586-020-00758-2. - DOI - PubMed
    1. Rothan H. A.; Byrareddy S. N. (2020) The epidemiology and pathogenesis of coronavirus disease (COVID-19) outbreak. J. Autoimmun. 109, 102433.10.1016/j.jaut.2020.102433. - DOI - PMC - PubMed

Publication types

Substances