A stress-induced tyrosine-tRNA depletion response mediates codon-based translational repression and growth suppression
- PMID: 33346941
- PMCID: PMC7809793
- DOI: 10.15252/embj.2020106696
A stress-induced tyrosine-tRNA depletion response mediates codon-based translational repression and growth suppression
Abstract
Eukaryotic transfer RNAs can become selectively fragmented upon various stresses, generating tRNA-derived small RNA fragments. Such fragmentation has been reported to impact a small fraction of the tRNA pool and thus presumed to not directly impact translation. We report that oxidative stress can rapidly generate tyrosine-tRNAGUA fragments in human cells-causing significant depletion of the precursor tRNA. Tyrosine-tRNAGUA depletion impaired translation of growth and metabolic genes enriched in cognate tyrosine codons. Depletion of tyrosine tRNAGUA or its translationally regulated targets USP3 and SCD repressed proliferation-revealing a dedicated tRNA-regulated growth-suppressive pathway for oxidative stress response. Tyrosine fragments are generated in a DIS3L2 exoribonuclease-dependent manner and inhibit hnRNPA1-mediated transcript destabilization. Moreover, tyrosine fragmentation is conserved in C. elegans. Thus, tRNA fragmentation can coordinately generate trans-acting small RNAs and functionally deplete a tRNA. Our findings reveal the existence of an underlying adaptive codon-based regulatory response inherent to the genetic code.
Keywords: hnRNPA1; oxidative stress; tRNA; tRNA fragments; translation.
© 2020 The Authors.
Conflict of interest statement
The authors declare that they have no conflict of interest.
Figures

Heatmap of tRNA profiling of MCF10A cells at 8 and 24 h post‐exposure to oxidative stress (200 μM H2O2). Biological triplicate data is depicted at each time point relative to control cells.
MCF10A cells were exposed to oxidative stress (200 μM H2O2) and processed for small RNA‐sequencing. The log2‐fold induction levels for tRFs derived from distinct tRNAs are plotted.
Schematic depicts the overlap of tRNAs in (A) that decreased over time with tRFs from (B) that were induced.

MCF10A cell viability 1 h after H2O2 treatment (200 μM) was tested by a trypan blue exclusion assay (n = 6). Horizontal bars represent the mean. A two‐tailed Mann–Whitney test was used to test for statistical significance.
The log2 fold induction of tRFs for all isoacceptors in the overlapping set of tRNAs found in Fig 1C.

Northern blot for tRFTyr GUA and tRFLeu HAG in MCF10A cells at 1 h post‐oxidative stress (200 μM H2O2) exposure.
Northern blot for tRFTyr GUA in C. elegans cells at 15 min post‐oxidative stress (200 μM H2O2) exposure.
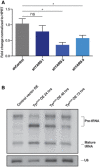
A Northern blot depicting a time course experiment ranging from 5 min to 24 h for HBEC30 cells in response to oxidative stress (200 μM H2O2). As before, a single probe complementary to pre‐tRNATyr GUA, mature tRNATyr GUA, and tRFTyr GUA was 32P‐labeled and used for detection in (C) and (D).
A Northern blot depicting two time points, 1 and 24 h, after exposure to oxidative stress (200 μM H2O2) in MCF10A cells.
Quantification of tRNATyr GUA, tRNAHis GUG, and tRNAGlu YUC by Northern blot analysis from two independent experiments 24 h (normalized to U6 levels) after exposure to oxidative stress (200 μM H2O2) are shown (n = 4).
Northern blot after MCF10A cells were treated with a pharmacological agent used to induce oxidative stress (menadione).
Quantification of tRNATyr GUA by Northern blot analysis from two independent experiments 24 h (normalized to U6 levels) after exposure to menadione are shown (n = 4).

A Northern blot depicting a time course experiment ranging from 5 min to 24 h of MCF10A cells in response to oxidative stress. A single probe complementary to pre‐tRNATyr GUA, mature tRNATyr GUA, and tRFTyr GUA expression was 32P‐labeled and used for detection.
Quantification of pre‐tRNATyr GUA (left) and mature tRNATyr GUA levels (right) by Northern blot analysis from multiple independent experiments (normalized to U6 levels) are shown (n = 6).
MCF10A cells were exposed to oxidative stress (200 μM H2O2) once daily for five continuous days.
Quantification of mature tRNATyr GUA bands by Northern blot after cells were treated once daily for five continuous days (normalized to U6) from multiple independent experiments (n = 12).
Quantification of Northern blot analysis for pre‐tRNATyr GUA (left) and tRNATyr GUA (right) after 1 and 24 h, respectively, in HBEC30 cells upon exposure to oxidative stress (200 μM H2O2) as in (A) (n = 6).

Growth curves of MCF10A cells exposed to oxidative stress (200 μM H2O2) relative to control cells (n = 3). Two‐way ANOVA was used to test for significance.
Northern blot of MCF10A cells expressing a control short‐hairpin RNA or a hairpin targeting tRNATyr GUA.
Western blot of MCF10A expressing a control short‐hairpin RNA or a hairpin targeting the tyrosine‐tRNA synthetase, YARS (red arrow). HSC70 was used as a loading control.
Growth curves of MCF10A cells expressing RNAi targeting mature tRNATyr GUA or YARS relative to cells expressing a control hairpin (n = 3). Two‐way ANOVA was used to test for significance.
Cell growth of MCF10A cells transiently transfected with a tRNATyr GUA overexpression vector relative to an empty control vector (n = 3). A one‐tailed Mann–Whitney test was used to test for significance at day 3.

Total mRNA from MCF10A cells stably expressing a short‐hairpin targeting YARS was analyzed by qRT–PCR. The two hairpins with the best knockdown were used for subsequent experiments. A one‐tailed Mann–Whitney test (*P < 0.05) was used to test for statistical significance.
Northern blot of MCF10A cells transiently transfected with a tRNATyr GUA overexpression vector or an empty control vector. TRNATyr GUA overexpression is shown at 24, 48, and 72 h post‐transfection.

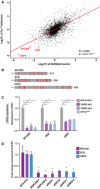
A plot showing the correlation between protein abundance changes with tRNATyr GUA depletion or YARS depletion (shYARS‐2) relative to control cells. A Pearson’s two‐sided test was used to assess the statistical significance of the correlation between tRNATyr GUA and YARS depletion effects.
Schematic showing locations of all tyrosine residues in the coding sequence of EPCAM, SCD, and USP3.
Levels of mRNA expression for target genes in cells depleted of either tRNATyr GUA or YARS as measured by qRT–PCR (n = 4). A one‐tailed Mann–Whitney test was used to test for statistical significance.
MCF10A cells transfected with two independent siRNA targeting EPCAM, SCD, or USP3 were analyzed by qRT–PCR at the end of each growth assay. A one‐tailed Mann–Whitney test was used to test for statistical significance (n = 3 except for siSCD‐2 has n = 2).

Cells depleted of tRNATyr GUA or YARS were processed for label free quantitation by mass spectrometry to identify proteins that were reduced by a log2‐fold change of 0.5 or more. This set was overlapped with proteins containing a higher than median abundance of Tyr codon content to identify candidate mediators of the pleiotropic effects of tRNATyr GUA depletion.
GO functional analysis of the 109 candidate gene‐set from (A).
Quantitative Western blot validation depicting abundances of protein targets (EPCAM, SCD, and USP3) identified from (A). HSC70 was used as a loading control and is not modulated upon molecular perturbation of tRNATyr GUA.
Quantification of Western blot analysis in (C) (n = 4). A one‐tailed Mann–Whitney test was used to test for statistical significance.
Growth curves for MCF10A cells were transfected with either control siRNA or two independent siRNA targeting EPCAM, SCD, or USP3. Note that the control cell growth curve is the same in all graphs and were plotted separately for clarity and does not represent independent experiments. Two‐way ANOVA was used to test for significance (n = 3).

Quantitative Western blot EPCAM, SCD, and USP3 in MCF10A cells 24 h after treatment with H2O2 (200 μM). HSC70 was used as a loading control.
Quantification of Western results in (A) (n = 9). A one‐tailed Mann–Whitney test was used to test for statistical significance.
A schematic of the codon‐based USP3 reporter. A Myc‐tagged WT or mutant reporter with 5 Tyr codons mutated to Ala codons were cloned upstream of a Luciferase used for transfection normalization.
Quantitative Western blot for the Myc‐tag and Luciferase (top) with normalized fluorescent intensities (bottom) are shown (n = 3).
Ribosome occupancy of 20‐22nt RPFs in tRNATyr GUA‐depleted cells compared to control cells reveal greater occupancy at both tyrosine codons in tRNATyr GUA‐depleted cells using a Wilcoxon test.
Genes were sorted based on their changes in GC‐corrected translation efficiency (TE) values, with reduced TE in tRNATyr GUA‐depleted cells shown in left and enhanced TE shown on right. The red bars over each column depict the range of values in that bin. Distribution of genes with high tyrosine codon content across these three bins were assessed using mutual information calculation and testing (see Materials and Methods for details). For visualization, we used the hypergeometric distribution to assign P‐values to the overlap between tyrosine‐rich genes and each bin. We then defined an enrichment score as –log of p‐value, if there was a significant enrichment. If the overlap is significantly fewer than expected by chance, log of p‐value is used instead (depletion). The resulting enrichment score is then shown as a heatmap with gold depicting positive enrichment.

MRNA expression levels for target genes 24 h after treatment with H2O2 (200 μM) as measured by qRT–PCR (n = 9). A one‐tailed Mann–Whitney test was used to test for statistical significance.
Examples of the mapped position of the 5′‐end of reads near the start (top) or stop (bottom) codons are shown, revealing the characteristic 3‐nucleotide periodicity previously described by (Ingolia et al, 2009).
Histogram of the read length distribution of RPFs observed upon ribosome profiling sequence analysis.
Codon usage scatter plots of the ribosomal A‐site of shTyr vs shControl from replicate ribosomal profiling experiments. The five most affected codons are labeled with UAC (Tyr) being the most affected (red arrow). Gray outline illustrates the 95% confidence interval around the regression line.

- A, B
Quantification of tRFTyr GUA induction in response to oxidative stress as a function of time in MCF10A (A) (n = 4) and in HBEC30 (B) (n = 6) with mean ± SEM shown for each cell line.
- C
Volcano plot of mass spectrometry results from a synthetic 5′‐biotinylated tRFTyr GUA co‐precipitation experiment with cell lysate. Log2 fold enrichment values of proteins identified from tRFTyr GUA relative to scrambled tRF control samples.
- D
Western blot validation of mass spectrometry results for three of the top hits in (A), showing co‐precipitation of endogenous proteins with transfected tRFTyr GUA relative to a scrambled control sequence (Scr).

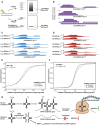
Schematic depicting the expected visualization of a crosslinked immunoprecipitation by autoradiogram. Bands corresponding to smRNA‐RBP interactions (no RNase digestion) or a smear representing mRNA‐RBP interactions (low RNase digestion) by autoradiogram were processed for HITS‐CLIP.
IGV plots from an hnRNPA1 HITS‐CLIP (Huelga et al, 2012) reveals interactions with tRFTyr GUA.
IGV plots representing SSB interacting with the tRFTyr GUA in samples that were treated with low levels of RNase digestion. SSB bound tRFTyr GUA reads mapped to multiple loci encoding tRNATyr GUA.
Similar to the IGV plots shown in (C), but depicting SSB interactions with tRFTyr GUA loci in samples without RNase digestion.
A cumulative distribution in control and hnRNPA1 depleted cells of the stability levels for mRNA transcripts with 3′ UTR hnRNPA1 CLIP binding (Huelga et al, 2012). Transfection of tRFTyr GUA led to a significant right‐shift in the expression levels of 3′ UTR bound hnRNPA1 transcripts. Statistical significance was measured using the Kolmogorov–Smirnov test.
Cumulative distribution as in (E). Transfection of locked nucleic acid against tRFTyr GUA and treatment with 200 µM H2O2 led to a significant left‐shift in mRNA stability of 3′UTR bound hnRNPA1 transcripts. Statistical significance was assessed using the Kolmogorov–Smirnov test.
Model of tRNATyr GUA‐dependent gene regulatory response to oxidative stress.
Comment in
-
Stressin' and slicin': stress-induced tRNA fragmentation codon-adapts translation to repress cell growth.EMBO J. 2021 Jan 15;40(2):e107097. doi: 10.15252/embj.2020107097. Epub 2020 Dec 21. EMBO J. 2021. PMID: 33346912 Free PMC article.
References
-
- Biamonti G, Bassi MT, Cartegni L, Mechta F, Buvoli M, Cobianchi F, Riva S (1993) Human hnRNP protein A1 gene expression. Structural and functional characterization of the promoter. J Mol Biol 230: 77–89 - PubMed
Publication types
MeSH terms
Substances
Grants and funding
LinkOut - more resources
Full Text Sources
Research Materials

