

College Campuses and COVID-19 Mitigation: Clinical and Economic Value
- PMID: 33347322
- PMCID: PMC7755069
- DOI: 10.7326/M20-6558
College Campuses and COVID-19 Mitigation: Clinical and Economic Value
Abstract
Background: Colleges in the United States are determining how to operate safely amid the coronavirus disease 2019 (COVID-19) pandemic.
Objective: To examine the clinical outcomes, cost, and cost-effectiveness of COVID-19 mitigation strategies on college campuses.
Design: The Clinical and Economic Analysis of COVID-19 interventions (CEACOV) model, a dynamic microsimulation model, was used to examine alternative mitigation strategies. The CEACOV model tracks infections accrued by students and faculty, accounting for community transmissions.
Data sources: Data from published literature were used to obtain parameters related to COVID-19 and contact-hours.
Target population: Undergraduate students and faculty at U.S. colleges.
Time horizon: One semester (105 days).
Perspective: Modified societal.
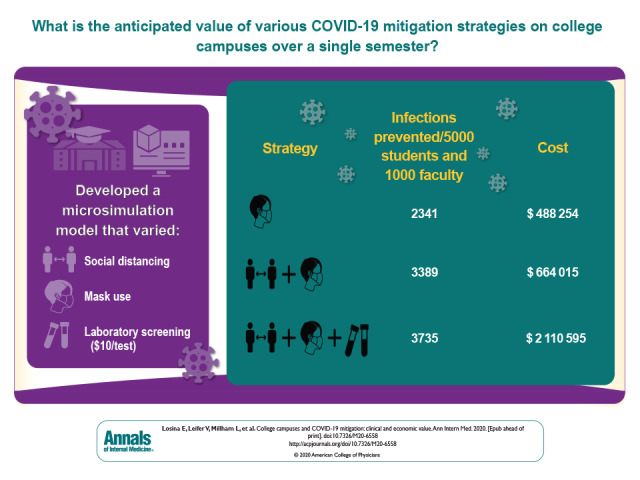
Intervention: COVID-19 mitigation strategies, including social distancing, masks, and routine laboratory screening.
Outcome measures: Infections among students and faculty per 5000 students and per 1000 faculty, isolation days, tests, costs, cost per infection prevented, and cost per quality-adjusted life-year (QALY).
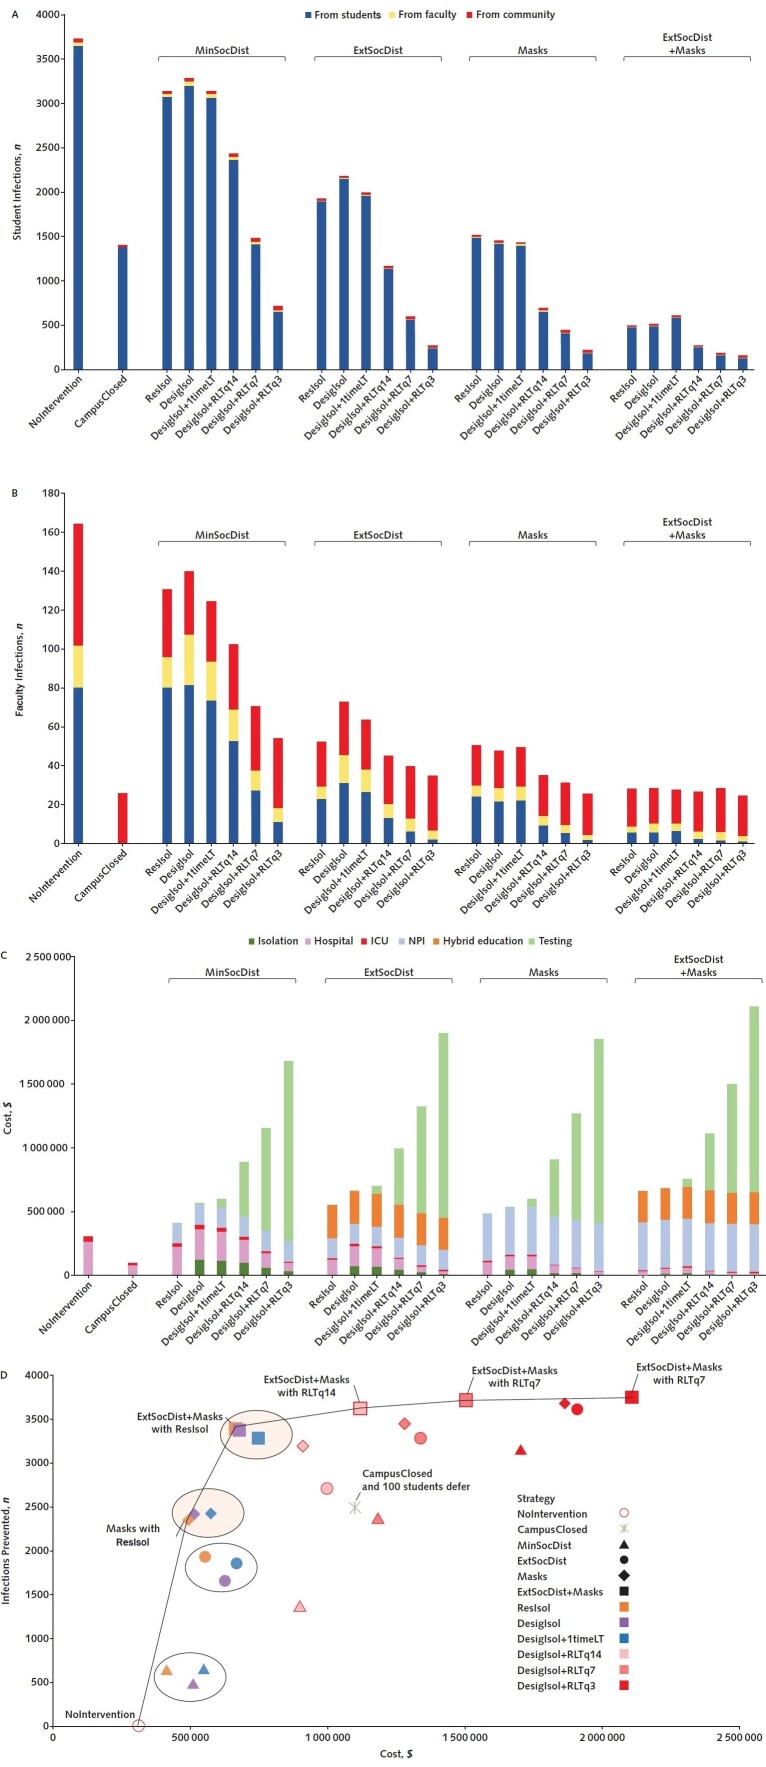
Results of base-case analysis: Among students, mitigation strategies reduced COVID-19 cases from 3746 with no mitigation to 493 with extensive social distancing and masks, and further to 151 when laboratory testing was added among asymptomatic persons every 3 days. Among faculty, these values were 164, 28, and 25 cases, respectively. Costs ranged from about $0.4 million for minimal social distancing to about $0.9 million to $2.1 million for strategies involving laboratory testing ($10 per test), depending on testing frequency. Extensive social distancing with masks cost $170 per infection prevented ($49 200 per QALY) compared with masks alone. Adding routine laboratory testing increased cost per infection prevented to between $2010 and $17 210 (cost per QALY gained, $811 400 to $2 804 600).
Results of sensitivity analysis: Results were most sensitive to test costs.
Limitation: Data are from multiple sources.
Conclusion: Extensive social distancing with a mandatory mask-wearing policy can prevent most COVID-19 cases on college campuses and is very cost-effective. Routine laboratory testing would prevent 96% of infections and require low-cost tests to be economically attractive.
Primary funding source: National Institutes of Health.
Conflict of interest statement
Figures
Update of
-
College campuses and COVID-19 mitigation: clinical and economic value.medRxiv [Preprint]. 2020 Sep 5:2020.09.03.20187062. doi: 10.1101/2020.09.03.20187062. medRxiv. 2020. Update in: Ann Intern Med. 2021 Apr;174(4):472-483. doi: 10.7326/M20-6558. PMID: 32908989 Free PMC article. Updated. Preprint.
References
-
- UnivStats. Total number of employees at U.S. colleges by occupation. 2020. Accessed at www.univstats.com/staffs on 2 December 2020.
-
- National Center for Education Statistics. College Navigator. Accessed at https://nces.ed.gov/collegenavigator on 2 December 2020.
-
- The New York Times. Tracking the coronavirus at U.S. colleges and universities. Updated 19 November 2020. Accessed at www.nytimes.com/interactive/2020/us/covid-college-cases-tracker.html on 2 December 2020.
-
- McChesney J, Bichsel J. The aging of tenure-track faculty in higher education: implications for succession and diversity. College and University Professional Association for Human Resources. 2020. Accessed at www.cupahr.org/wp-content/uploads/CUPA-HR-Brief-Aging-Faculty.pdf on 2 December 2020.
-
- Clark A , Jit M , Warren-Gash C , et al; Centre for the Mathematical Modelling of Infectious Diseases COVID-19 working group. Global, regional, and national estimates of the population at increased risk of severe COVID-19 due to underlying health conditions in 2020: a modelling study. Lancet Glob Health. 2020;8:e1003-e1017. [PMID: ] doi: 10.1016/S2214-109X(20)30264-3 - DOI - PMC - PubMed
Publication types
MeSH terms
Grants and funding
LinkOut - more resources
Full Text Sources
Medical
Research Materials