Review
. 2021 Apr 19;17(2):170-185.
doi: 10.1039/d0mo00041h.

Multi-omics data integration considerations and study design for biological systems and disease

Affiliations
Review

Multi-omics data integration considerations and study design for biological systems and disease

Stefan Graw et al. Mol Omics. .

Abstract

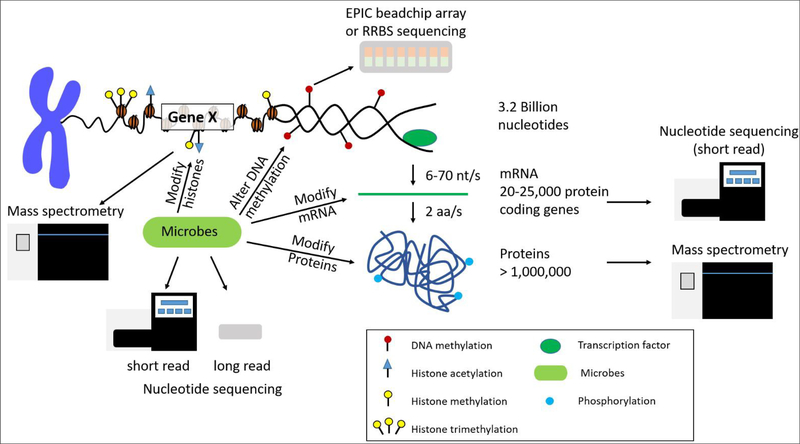
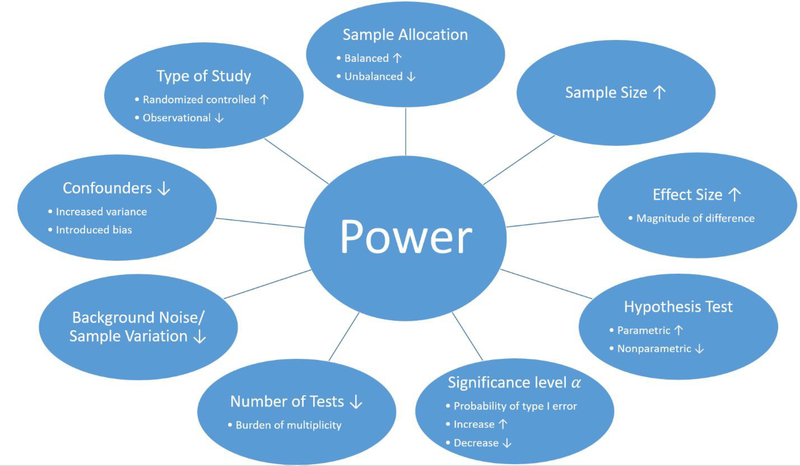
With the advancement of next-generation sequencing and mass spectrometry, there is a growing need for the ability to merge biological features in order to study a system as a whole. Features such as the transcriptome, methylome, proteome, histone post-translational modifications and the microbiome all influence the host response to various diseases and cancers. Each of these platforms have technological limitations due to sample preparation steps, amount of material needed for sequencing, and sequencing depth requirements. These features provide a snapshot of one level of regulation in a system. The obvious next step is to integrate this information and learn how genes, proteins, and/or epigenetic factors influence the phenotype of a disease in context of the system. In recent years, there has been a push for the development of data integration methods. Each method specifically integrates a subset of omics data using approaches such as conceptual integration, statistical integration, model-based integration, networks, and pathway data integration. In this review, we discuss considerations of the study design for each data feature, the limitations in gene and protein abundance and their rate of expression, the current data integration methods, and microbiome influences on gene and protein expression. The considerations discussed in this review should be regarded when developing new algorithms for integrating multi-omics data.


Conflict of interest statement

Conflicts of interest

No potential conflict of interest was reported by the authors.

Figures

Figure 1.
Figure 1.. Overview of chromatin structure and gene/protein regulation.
DNA access is regulated by DNA methylation and histone post-translational modifications (PTMs). There are approximately 3.2 billion nucleotides in the human genome transcribed to approximately 20,000–25,000 protein coding genes, which are translated to over 1 million proteins due to alternative splicing events. Each layer of regulation can also be modified by microbes that are present in the environment and host organism. Each level of biological regulation can be sequenced by using various nucleotide and protein/peptide sequencing technologies.
Figure 2.
Figure 2.. Factors that influence the statistical power in multi-omics studies.
The statistical power of a multi-omics study can be effected by several factors including and must be considered at the beginning of the study. Such factors include, but are not limited to (the effect of the following factors on power are under the assumption that the remaining factors remain constant): (1) The type of the study. While randomized controlled studies are generally more powerful than observational studies due to controlling unwanted effects, limitations can prohibit this application of a randomized controlled study. (2) The sample allocation. In general, a balanced study, where samples are equally distributed among group, is more powerful unbalanced study. (3) Sample size. As the number of samples in a study increases the statistical power improves. (4) Effect size. The greater the true differences between groups, the greater the statistical power of a study. (5) Hypothesis test. While parametric tests are in general more powerful than nonparametric test, parametric tests are not applicable if there assumptions are not met. (6) Significance level α. The significant level represents the probability of type I errors, the probability of rejecting the null hypothesis given that the null hypothesis is true. As the numerical value of α increases, the probability of type I errors increases as well as the statistical power (probability of rejecting the null hypothesis given that the null hypothesis is true). (7) Number of tests. Testing multiple hypotheses requires a correction and reduces the statistical power. (8) Background noise and sample variation increase the variance and complicate the detection of a true signal and therefore decrease the statistical power. (9) Confounders can increase variance and/or introduce a bias, which decreases the statistical power.

References

    1. Zaman A, Wu W, and Bivona TG, Targeting Oncogenic BRAF: Past, Present, and Future. Cancers, 2019. 11(8): p. 1197. - PMC - PubMed
    1. Alvarez-Arenas A, et al., Interplay of Darwinian Selection, Lamarckian Induction and Microvesicle Transfer on Drug Resistance in Cancer. Scientific reports, 2019. 9(1): p. 9332–9332. - PMC - PubMed
    1. Yu K, et al., An integrated meta-omics approach reveals substrates involved in synergistic interactions in a bisphenol A (BPA)-degrading microbial community. Microbiome, 2019. 7(1): p. 16. - PMC - PubMed
    1. Poore GD, et al., Microbiome analyses of blood and tissues suggest cancer diagnostic approach. Nature, 2020. 579(7800): p. 567–574. - PMC - PubMed
    1. Gonzalez A, et al., Characterizing microbial communities through space and time. Current Opinion in Biotechnology, 2012. 23(3): p. 431–436. - PMC - PubMed

Publication types

LinkOut - more resources