. 2020 Dec 21;9(12):giaa147.
doi: 10.1093/gigascience/giaa147.

Toward a scalable framework for reproducible processing of volumetric, nanoscale neuroimaging datasets

Affiliations

Toward a scalable framework for reproducible processing of volumetric, nanoscale neuroimaging datasets

Erik C Johnson et al. Gigascience. .

Abstract

Background: Emerging neuroimaging datasets (collected with imaging techniques such as electron microscopy, optical microscopy, or X-ray microtomography) describe the location and properties of neurons and their connections at unprecedented scale, promising new ways of understanding the brain. These modern imaging techniques used to interrogate the brain can quickly accumulate gigabytes to petabytes of structural brain imaging data. Unfortunately, many neuroscience laboratories lack the computational resources to work with datasets of this size: computer vision tools are often not portable or scalable, and there is considerable difficulty in reproducing results or extending methods.

Results: We developed an ecosystem of neuroimaging data analysis pipelines that use open-source algorithms to create standardized modules and end-to-end optimized approaches. As exemplars we apply our tools to estimate synapse-level connectomes from electron microscopy data and cell distributions from X-ray microtomography data. To facilitate scientific discovery, we propose a generalized processing framework, which connects and extends existing open-source projects to provide large-scale data storage, reproducible algorithms, and workflow execution engines.

Conclusions: Our accessible methods and pipelines demonstrate that approaches across multiple neuroimaging experiments can be standardized and applied to diverse datasets. The techniques developed are demonstrated on neuroimaging datasets but may be applied to similar problems in other domains.

Keywords: computational neuroscience; containers; electron microscopy; microtomography; optimization; reproducible science; workflows.


Conflict of interest statement

The authors declare that they have no competing interests.

Figures

Figure 1:
Figure 1:
Workflow for processing XRM data to produce cell and vessel location estimates. Raw pixels are used to predict probabilities of boundaries, followed by detection of cell bodies and blood vessels. Finally, cell density estimates are created. A, reconstruction pipeline; B, reconstruction of the detected cells and blood vessels in the test volume. Cells are shown as spheres and blood vessels as red lines.
Figure 2:
Figure 2:
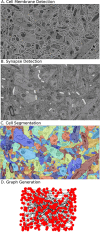
Canonical workflow for graph estimation in EM data volumes. This workflow provides the ability to reconstruct a nanoscale map of brain circuitry at the single-synapse level. The procedure of mapping raw image stacks to graphs representing synapse-level connectomes consists of synapse and membrane detection, segmentation of neurons, assignment of synapses, merging, and graph estimation. A, reconstruction pipeline; B, example segmentation of a neuron from a block of data.
Figure 3:
Figure 3:
Use case of optimizing a pipeline for light microscopy data, comparing grid search, random search, and the random resampling approach described in the text. We demonstrate these tools on a light microscopy dataset, leveraging methods originally developed for XRM—showcasing the potential for applying tools across diverse datasets. The framework allows a user to easily compare the trade-offs of different approaches for a particular dataset. The maximum f1 score for each approach is marked with a red cross. Automating this process using SABER allows for rapid deployment and optimization.
Figure 4:
Figure 4:
Example deployment of pipeline over spatial dataset, in this case cell detection in XRM data. An example slice of raw data can be seen in A. The pipeline in Fig. 1 was used to classify pixels (B) and detect cells. From the cells, a 3D scatter plot of the positions of the cell centers was generated (C).
Figure 5:
Figure 5:
Example deployment of EM segmentation pipeline to extract graphical models of connectivity from raw images. The processing pipeline (Fig. 1) consists of neural network tools to perform (A) membrane detection and (B) synapse detection. This is followed by a segmentation tool (C). Finally, segmentation and synapses are associated to create a graphical model. Visualizations of segmentations are done with Neuroglancer [44], a tool compatible with SABER and integrated with the bossDB [20] system.
Figure 6:
Figure 6:
The architecture and components of SABER. Tools, workflows, and parameters for individual use cases (optimization, deployment) are captured in a file structure using standardized CWL specifications and configuration files. The core of the framework (called CONDUIT) is run locally in a Docker container. CONDUIT consists of scripts to orchestrate deployment and optimization, a custom CWL parser, Apache Airflow for workflow execution, and tools to collect and visualize results. Containerized tools are executed locally or using AWS Batch for a scalable solution. The bossDB provides a solution for scalable storage of imaging data, and a local database is used for storing parameters and derived information. JSON: JavaScript Object Notation.

References

    1. Lichtman JW, Pfister H, Shavit N. The big data challenges of connectomics. Nat Neurosci. 2014;17(11):1448. - PMC - PubMed
    1. Micheva KD, O’Rourke N, Busse B, et al. Array tomography: High-resolution three-dimensional immunofluorescence. Cold Spring Harb Protoc. 2010;5(11):1214–9. - PubMed
    1. Chung K, Deisseroth K. CLARITY for mapping the nervous system. Nat Methods. 2013;10(6):508–13. - PubMed
    1. Allen Institute for Brain Science. Allen Brain Atlas. http://brain-map.org/api/index.html. Accessed on June 6, 2018.
    1. Dyer EL, Gray Roncal W, Prasad JA, et al. Quantifying mesoscale neuroanatomy using X-ray microtomography. eNeuro. 2017;4(5), doi:10.1523/ENEURO.0195-17.2017. - DOI - PMC - PubMed

Publication types