. 2021 Jan 25;49(2):891-901.
doi: 10.1093/nar/gkaa1219.

Variable interplay of UV-induced DNA damage and repair at transcription factor binding sites

Affiliations

Variable interplay of UV-induced DNA damage and repair at transcription factor binding sites

Joan Frigola et al. Nucleic Acids Res. .

Abstract

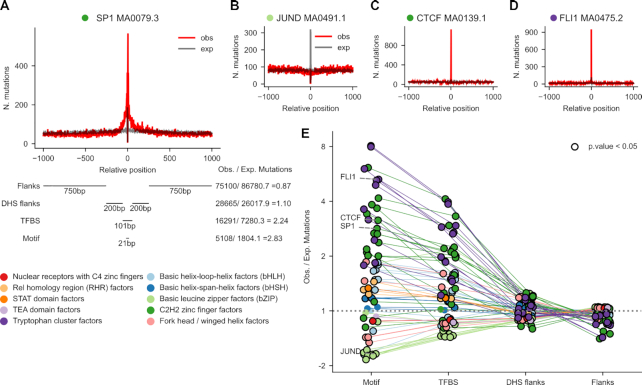
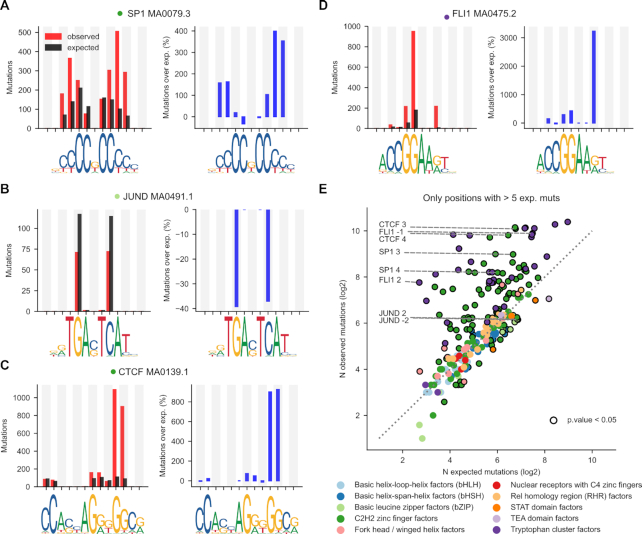
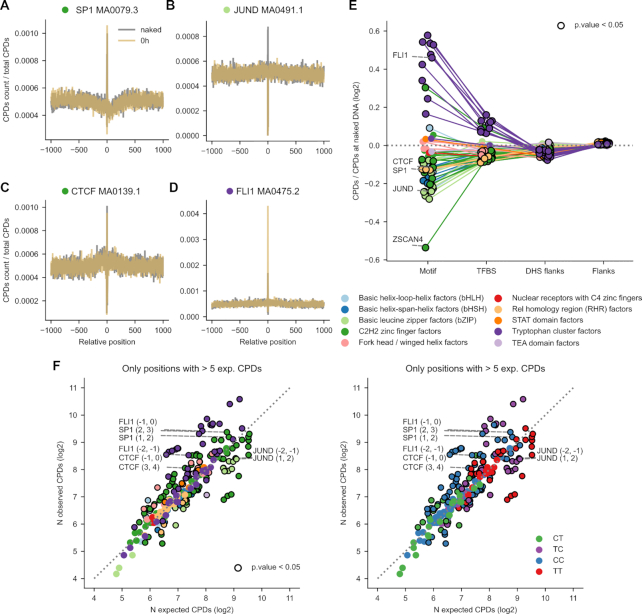
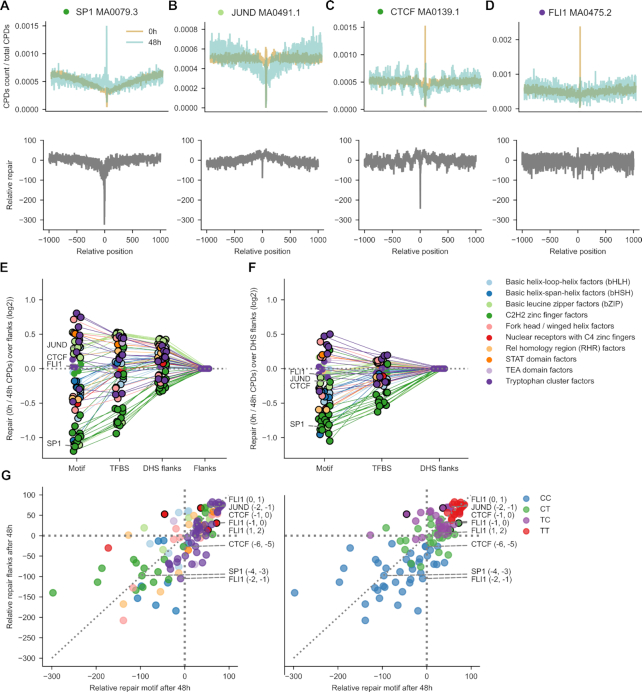
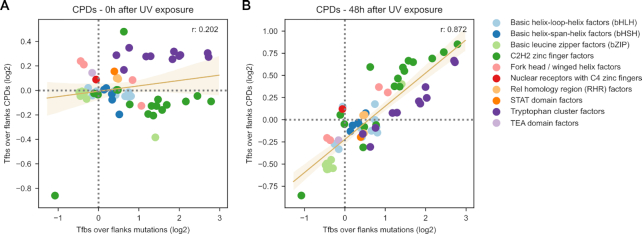
An abnormally high rate of UV-light related mutations appears at transcription factor binding sites (TFBS) across melanomas. The binding of transcription factors (TFs) to the DNA impairs the repair of UV-induced lesions and certain TFs have been shown to increase the rate of generation of these lesions at their binding sites. However, the precise contribution of these two elements to the increase in mutation rate at TFBS in these malignant cells is not understood. Here, exploiting nucleotide-resolution data, we computed the rate of formation and repair of UV-lesions within the binding sites of TFs of different families. We observed, at certain dipyrimidine positions within the binding site of TFs in the Tryptophan Cluster family, an increased rate of formation of UV-induced lesions, corroborating previous studies. Nevertheless, across most families of TFs, the observed increased mutation rate within the entire DNA region covered by the protein results from the decreased repair efficiency. While the rate of mutations across all TFBS does not agree with the amount of UV-induced lesions observed immediately after UV exposure, it strongly agrees with that observed after 48 h. This corroborates the determinant role of the impaired repair in the observed increase of mutation rate.


Figures

Figure 1.
Figure 1.
Mutation rate at TFBS in melanomas. (A) 2001-nucleotide sequences centered at the middle point of active TFBS are extracted from the genomic sequence. Within each sequence four areas are delimited: (from the center to the periphery) motif (21 bp), TFBS (101 bp that contain the motif), DHS flanks (400 bp), and flanks (1500 bp). The somatic mutations identified in a cohort of 136 melanomas are mapped to these sequences. Then, all 2001-nucleotide sequences containing the same type of binding motif of a TF are stacked. Mutations at each position of the stack are summed across the sequences, and the expected distribution of mutations across the 2001-nucleotide stack is computed from the profile of tri-nucleotide whole-genome substitution frequencies observed across the cohort. (A–D) The observed (red) and expected (gray) distributions of mutations in the stack of 2001-nucleotide sequences centered around the MA1107.1 binding motif of KLF9 (A), the MA0491.1 binding motif of JUND (B), the MA0139.1 binding motif of CTCF (C), and the MA 0475.2 binding motif of FLI1 (D). (E) Ratio of observed to expected mutations (in log2 scale) within the four regions defined across the stacks of 2001-nucleotide sequences centered across 64 types of TF binding motifs with >5000 sequences and a median number of mutations across all positions >2. Positive values correspond to higher-than-expected mutation rates at each region, whereas lower-than-expected mutation rates possess negative values. Points that correspond to instances of significant deviation from the expectation (G-test P-value<0.05) are encircled in black. The thin straight lines join the values computed for the regions of a given type of motif. The circles corresponding to each type of motif are colored according to the family of the corresponding TF, following the legend presented next to the panel.
Figure 2.
Figure 2.
Mutation rate at specific positions within the TF binding motif. (A–D) The left graph in each panel presents the observed (red bar) and expected (black bar) number of mutations at each mutated dipyrimidine position of the four binding motifs shown in Figures 1A–D. To compute the expected mutations at each dipyrimidine position the tetramer containing the dipyrimidine was sampled from the flanks of the same 2001-nucleotides sequence, and their observed number of mutations averaged. The right graph presents the corresponding percentage of increase of the rate of mutations over that expected (blue bar) at each mutated dipyrimidine position. Positive values thus correspond to increased mutation rate, while negative values occur at positions with decreased mutation rate. (E) Scatterplot representing the relationship between the number of observed and expected mutations (in log2 scale) at all dipyrimidine positions within all binding motifs included in the study. Each dot, hence corresponds to an individual dipyrimidine position in a binding motif colored following the family of the corresponding TF, according to the legend below the panel. Dipyrimidine positions with significant increased or decreased number of mutations with respect to the expectation (G-test P-value < 0.05) are encircled in black.
Figure 3.
Figure 3.
CPD formation rate at TFBS. (A–D) Distribution of the observed (amber) or expected (dark gray) rate of CPDs formed upon UV irradiation within 2001-nucleotides sequences centered at the middle position of the TFBS shown in Figures 1 and 2. (E) Ratio of observed to expected CPDs formation rates (in log2 scale) within the four regions studied. Positive values correspond to higher-than-expected CPD formation rates at each region, whereas lower-than-expected CPD formation rates possess negative values. Points representing instances with significant deviations from the expectation (G-test P-value < 0.05) are encircled in black. Thin straight lines join the values computed for the regions of a given type of motif. (F) Scatterplots representing the relationship between the number (log2) of observed and expected CPDs formed at specific dipyrimidine positions within each type of motif. In the left plot, the dots representing the motifs are colored following TF families, while in the right plot, their colors correspond to the type of dipyrimidine where they occur.
Figure 4.
Figure 4.
Relative repair of CPDs at TFBS. (A–D) Relative activity of repair of CPDs in the four TF binding motifs presented in previous Figures. Top panels represent the rate of CPDs experimentally generated immediately after irradiation (0h, ambar) and the rate of CPDs persisting 48 h (blue) after irradiation. (Both CPD rates are computed relative to the number of CPDs across the entire TFBS.) The subtraction of the latter from the former, nucleotide-by-nucleotide yields the relative rate of repair across each type of binding motif. (E) Ratio of the relative repair rates of CPDs at motifs, TFBS or DHS flanks with respect to flanks (in log2 scale). Positive values correspond to relative CPD repair rates that are larger at a given region than at the flanks, whereas lower-than-flanks mutation ratios possess negative values. Points encircled in black represent instances of significant deviation from the expectation (G-test P-value < 0.05). Thin straight lines join the values computed for the regions of a given type of motif. The points representing the ratios computed for each region of each type of motif are colored according to the family of the corresponding TF, following the legend presented next to the panel. (F) Ratio of the relative repair rates of CPDs at motifs or TFBS with respect to DHS flanks (in log2 scale). Notation as in panel (E). (G) Scatterplots representing the relationship between the percent of repaired CPDs at specific dipyrimidine positions within individual motifs (after 48 h) and the average repair rate for the same type of dipyrimidine in the same context (tetranucleotide) within the flanks. Each dot corresponds to an individual dipyrimidine. Dots above the diagonal represent dipyrimidines repaired at a higher rate than dipyrimidines in the same context in the flanks. On the other hand, dots below the diagonal correspond to dipyrimidines at positions that experience lower relative repair rate.
Figure 5.
Figure 5.
The UV mutational process in TFBS. (A) Relationship between the ratio (log2) of TFBS-to-flanks CPDs (y-axis) computed immediately after irradiation and the ratio (log2) of TFBS-to-flanks mutations (x-axis). (B) Relationship between the ratio (log2) of TFBS-to-flanks CPDs (y-axis) computed 48 h after irradiation and the ratio (log2) of TFBS-to-flanks mutations (x-axis). Dots represent specific motifs. The trendline and the Pearson's correlation coefficients computed for both relationships are presented in the graph.

References

    1. Bergamini C.M., Gambetti S., Dondi A., Cervellati C.. Oxygen, reactive oxygen species and tissue damage. Curr. Pharm. Des. 2004; 10:1611–1626. - PubMed
    1. De Bont R., van Larebeke N.. Endogenous DNA damage in humans: a review of quantitative data. Mutagenesis. 2004; 19:169–185. - PubMed
    1. Rastogi R., Ashok Kumar R., Tyagi M., Sinha R.. Molecular mechanisms of ultraviolet radiation-induced DNA damage and repair. J. Nucleic Acids. 2010; 2010:592980. - PMC - PubMed
    1. Grollman A.P., Moriya M.. Mutagenesis by 8-oxoguanine: an enemy within. Trends Genet. 1993; 9:246–249. - PubMed
    1. Xie Z., Braithwaite E., Guo D., Zhao B., Geacintov N.E., Wang Z.. Mutagenesis of benzo[a]pyrene diol epoxide in yeast: requirement for DNA polymerase zeta and involvement of DNA polymerase eta. Biochemistry. 2003; 42:11253–11262. - PubMed

Publication types