. 2021 Feb;599(3):981-1001.
doi: 10.1113/JP280899. Epub 2021 Jan 4.

Abnormal skeletal muscle blood flow, contractile mechanics and fibre morphology in a rat model of obese-HFpEF

Affiliations

Abnormal skeletal muscle blood flow, contractile mechanics and fibre morphology in a rat model of obese-HFpEF

Ever Espino-Gonzalez et al. J Physiol. 2021 Feb.

Abstract

Key points: Heart failure is characterised by limb and respiratory muscle impairments that limit functional capacity and quality of life. However, compared with heart failure with reduced ejection fraction (HFrEF), skeletal muscle alterations induced by heart failure with preserved ejection fraction (HFpEF) remain poorly explored. Here we report that obese-HFpEF induces multiple skeletal muscle alterations in the rat hindlimb, including impaired muscle mechanics related to shortening velocity, fibre atrophy, capillary loss, and an impaired blood flow response to contractions that implies a perfusive oxygen delivery limitation. We also demonstrate that obese-HFpEF is characterised by diaphragmatic alterations similar to those caused by denervation - atrophy in Type IIb/IIx (fast/glycolytic) fibres and hypertrophy in Type I (slow/oxidative) fibres. These findings extend current knowledge in HFpEF skeletal muscle physiology, potentially underlying exercise intolerance, which may facilitate future therapeutic approaches.

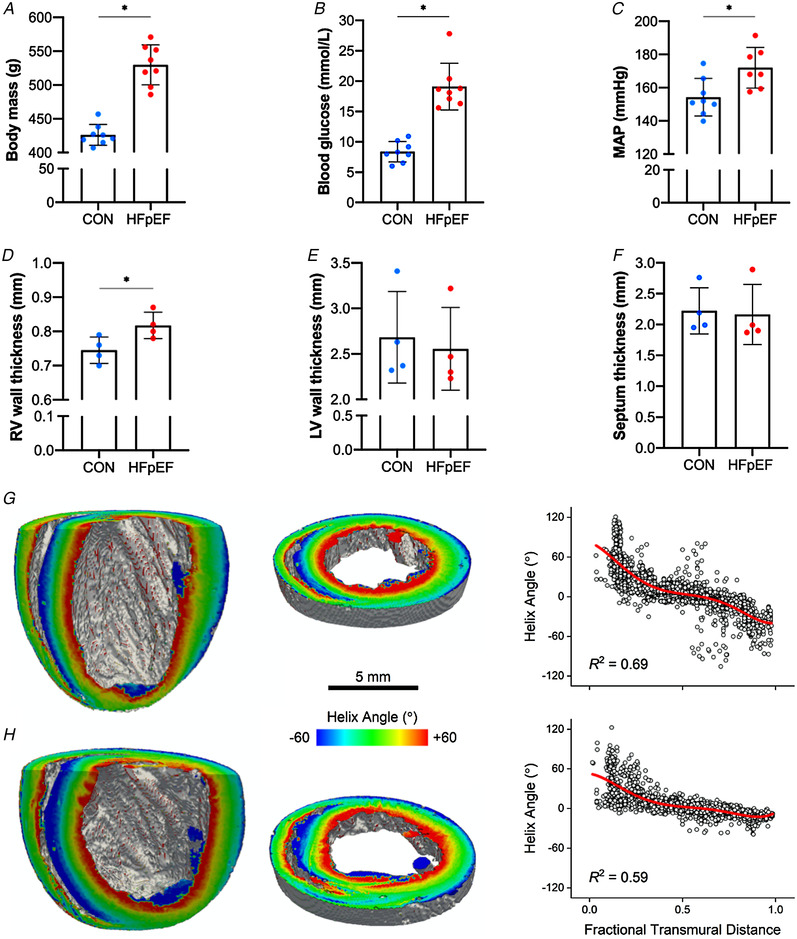
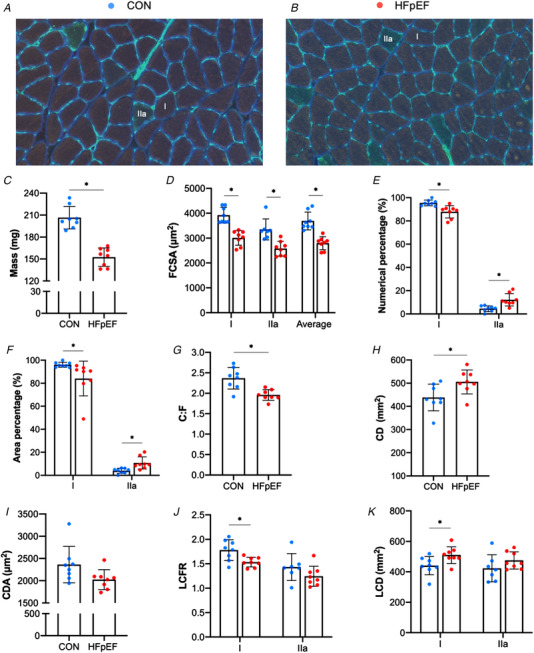
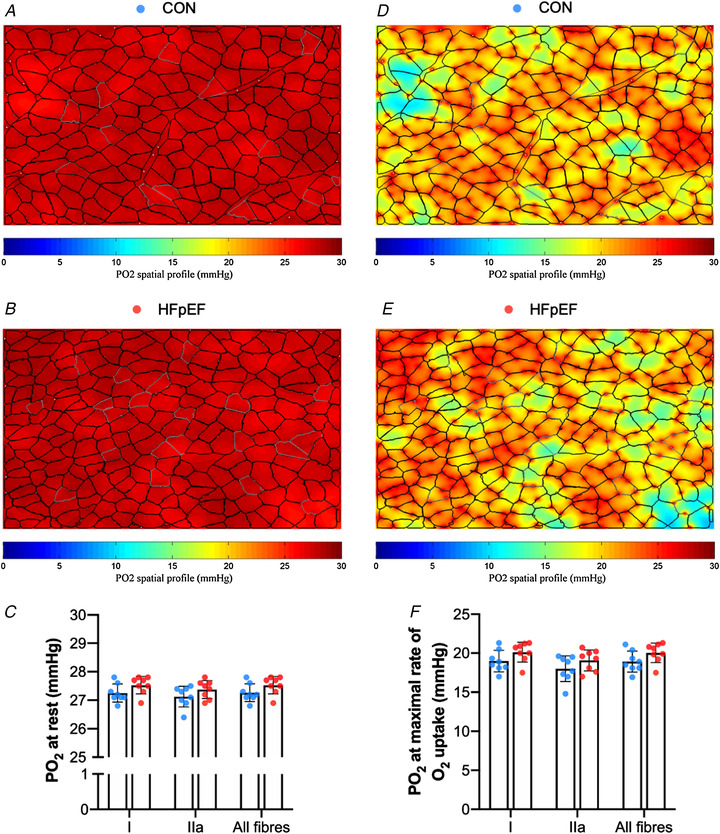
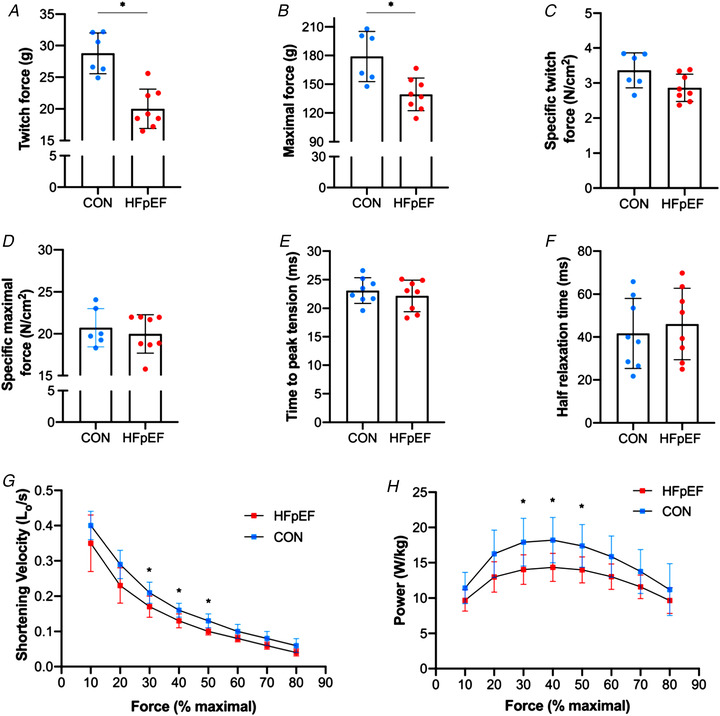
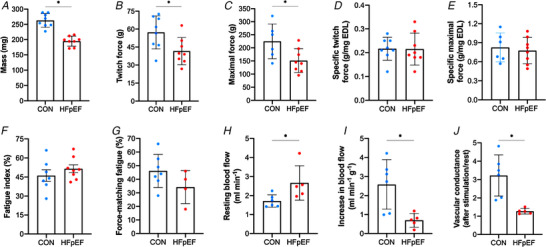
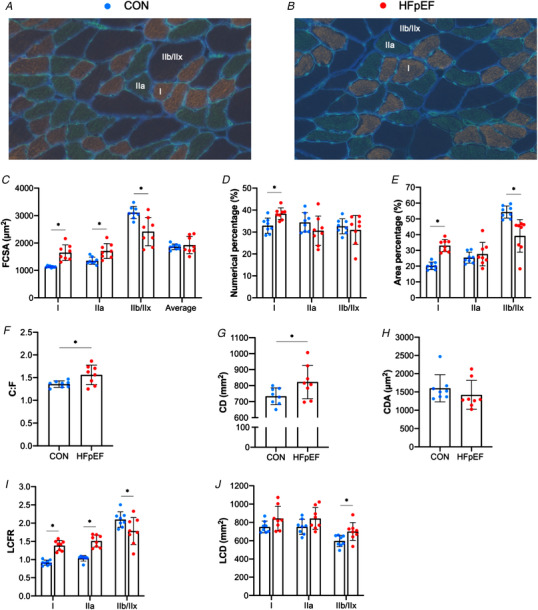
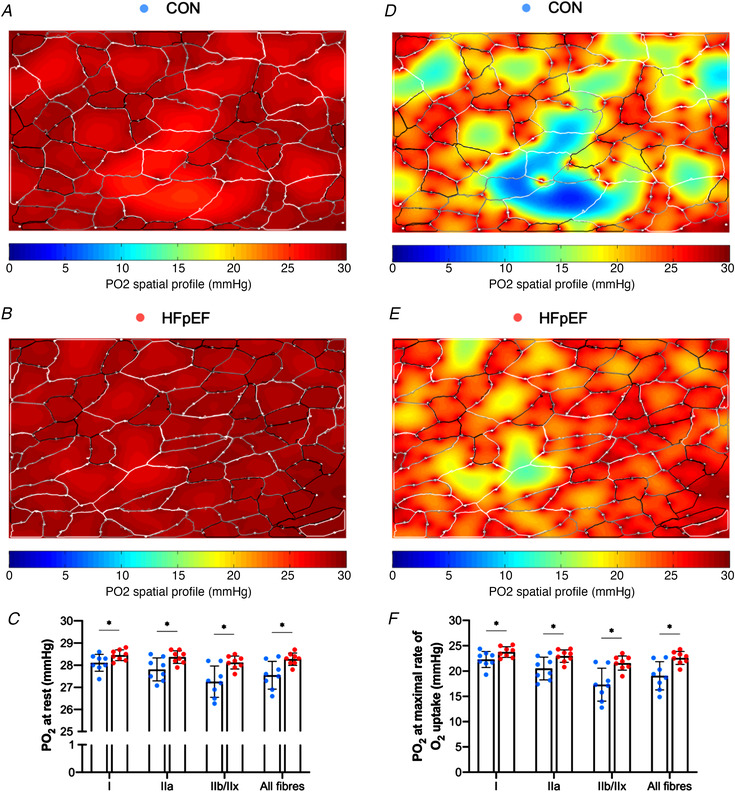
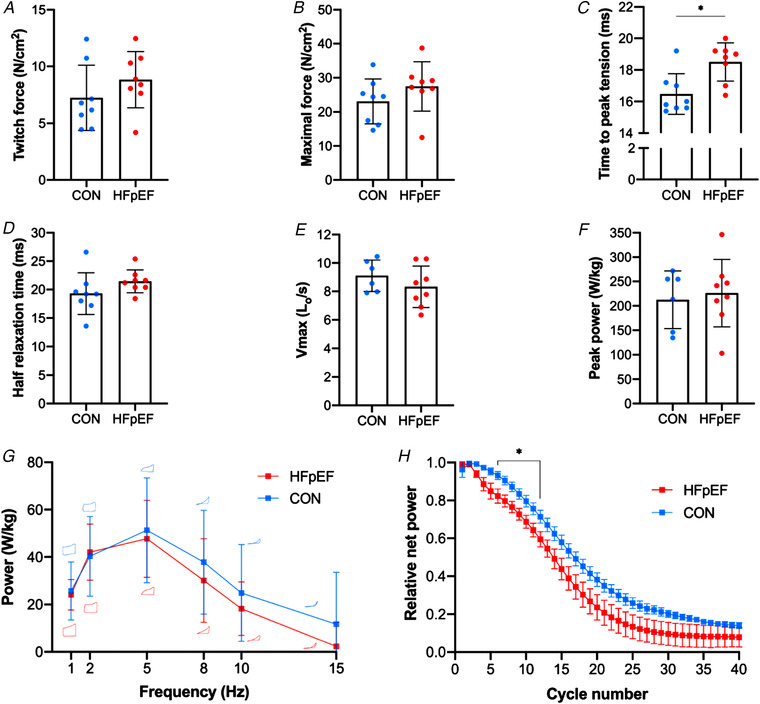
Abstract: Peripheral skeletal muscle and vascular alterations induced by heart failure with preserved ejection fraction (HFpEF) remain poorly identified, with limited therapeutic targets. This study used a cardiometabolic obese-HFpEF rat model to comprehensively phenotype skeletal muscle mechanics, blood flow, microvasculature and fibre atrophy. Lean (n = 8) and obese-HFpEF (n = 8) ZSF1 rats were compared. Skeletal muscles (soleus and diaphragm) were assessed for in vitro contractility (isometric and isotonic properties) alongside indices of fibre-type cross-sectional area, myosin isoform, and capillarity, and estimated muscle PO2 . In situ extensor digitorum longus (EDL) contractility and femoral blood flow were assessed. HFpEF soleus demonstrated lower absolute maximal force by 22%, fibre atrophy by 24%, a fibre-type shift from I to IIa, and a 17% lower capillary-to-fibre ratio despite increased capillary density (all P < 0.05) with preserved muscle PO2 (P = 0.115) and isometric specific force (P > 0.05). Soleus isotonic properties (shortening velocity and power) were impaired by up to 17 and 22%, respectively (P < 0.05), while the magnitude of the exercise hyperaemia was attenuated by 73% (P = 0.012) in line with higher muscle fatigue by 26% (P = 0.079). Diaphragm alterations (P < 0.05) included Type IIx fibre atrophy despite Type I/IIa fibre hypertrophy, with increased indices of capillarity alongside preserved contractile properties during isometric, isotonic, and cyclical contractions. In conclusion, obese-HFpEF rats demonstrated blunted skeletal muscle blood flow during contractions in parallel to microvascular structural remodelling, fibre atrophy, and isotonic contractile dysfunction in the locomotor muscles. In contrast, diaphragm phenotype remained well preserved. This study identifies numerous muscle-specific impairments that could exacerbate exercise intolerance in obese-HFpEF.

Keywords: HFpEF; blood flow; diaphragm; heart failure; muscle atrophy; muscle contraction; skeletal muscle.


Figures

Figure 1
Figure 1. Cardiometabolic characteristics
At 20 weeks of age, HFpEF rats developed obesity (426.25 ± 15.41 vs. 529.88 ± 29.56 g P < 0.001) (A), hyperglycaemia (8.38 ± 1.69 vs. 19.10 ± 3.83 mmol l−1; P < 0.001) (B) and hypertension (154.26 ± 11.28 vs. 172.03 ± 12.26 mmHg; P = 0.012) (C). Compared with lean controls, obese‐HFpEF rats also showed increased right ventricular (RV) wall thickness (0.74 ± 0.04 vs. 0.82 ± 0.04 mm; P = 0.034) (D); however, left ventricular (LV) wall and the septum thickness were not different between groups (2.68 ± 0.51 vs. 2.55 ± 0.46 mm; P = 0.719 and 2.22 ± 0.38 vs. 2.16 ± 0.49 mm; P = 0.849, respectively) (E–F). Left and middle panels: long axis cuts (left) and short axis slices (middle) of representative lean (G) and obese (H) hearts, with myocyte helix (inclination) angle colour coded on the cut surfaces. Right panel: the helix angle in the RV free wall plotted as a function of fractional transmural distance (0.0, endocardium; 1.0, epicardium) for representative lean (G) and obese (H) hearts. The red continuous line is a 5th order polynomial fit to the data. Myocyte disarray is quantified by the R 2 of this fit. [Color figure can be viewed at wileyonlinelibrary.com]
Figure 2
Figure 2. Histological features of the soleus muscle
Representative soleus sections from control (A) and obese‐HFpEF (B). Obese‐HFpEF showed atrophy in the soleus muscle, with reduced wet muscle mass (206.54 ± 15.48 vs. 152.50 ± 12.55 mg; P < 0.001) (C) and reduced cross‐sectional area (CSA) in both Type I (3921.88 ± 316.51 vs. 3009.75 ± 298.03 μm2; P < 0.001) and Type IIa fibres (3351.43 ± 422.09 vs. 2575.69 ± 296.86 μm2; P = 0.001) (D). HFpEF rats also had a lower numerical and areal composition of Type I fibres (95.49 ± 2.45 vs. 87.84 ± 5.32%, P = 0.002 and 96.06 ± 2.17 vs. 84.06 ± 15.14 %, P = 0.043, respectively), whereas these were higher in Type IIa fibres (4.51 ± 2.45 vs. 12.16 ± 5.32 %, P = 0.002 and 3.94 ± 2.17 vs. 10.74 ± 5.31 %, P = 0.005, respectively) (E‐F). Moreover, compared with lean controls, obese rats had reduced capillary‐to‐fibre (C:F) ratio (2.37 ± 0.26 vs. 1.96 ± 0.13; P = 0.002) (G), whereas capillary density (CD), was increased (438.23 ± 57.66 vs. 505.5 ± 51.53 mm−2; P = 0.027) (H) with no change in capillary domain area (CDA) (2363.28 ± 410.48 vs. 2024.48 ± 223.24 μm2; P = 0.059) (I). Finally, local analyses of capillary distribution showed that HFpEF rats had lower local capillary‐to‐fibre ratio (LCFR) in Type I fibres (1.78 ± 0.22 vs. 1.53 ± 0.10; P = 0.011), although this was unchanged in Type IIa fibres (1.43 ± 0.27 vs. 1.24 ± 0.21; P = 0.154) (J). In contrast, local capillary density (LCD) in Type I fibres was increased in HFpEF rats (440.41 ± 59.71 vs. 510.15 ± 54.9 mm−2; P = 0.029), with no changes in Type IIa fibres (423.20 ± 88.64 vs. 474.73 ± 56.17 mm−2; P = 0.196) (K). [Color figure can be viewed at wileyonlinelibrary.com]
Figure 3
Figure 3. Modelling of soleus muscle oxygen tension
Simulation of muscle PO2 at rest (A–B) and maximal rate of oxygen consumption (D–E) in representative images. There were no significant differences in simulations of muscle PO2 at rest (Type I fibres: 27.26 ± 0.33 vs. 27.54 ± 0.30 mmHg, P = 0.099; Type IIa: 27.12 ± 0.39 vs. 27.37 ± 0.31 mmHg, P = 0.16; all fibres: 27.25 ± 0.33 vs. 27.52 ± 0.29 mmHg, P = 0.102) (C) or at maximal rate of oxygen consumption (Type I: 18.97 ± 1.38 vs. 20.11 ± 1.27 mmHg, P = 0.109; Type IIa: 18.00 ± 1.64 vs. 19.07 ± 1.36 mmHg, P = 0.177; all fibres: 18.92 ± 1.36 vs. 20.02 ± 1.24 mmHg, P = 0.115) (F). Areas of muscle hypoxia (PO2 < 0.5 mmHg) are highlighted in blue. [Color figure can be viewed at wileyonlinelibrary.com]
Figure 4
Figure 4. In vitro skeletal muscle function
The soleus of HFpEF rats showed lower absolute twitch force (28.79 ± 3.23 vs. 20.01 ± 3.10 g; P < 0.001) (A) and absolute maximal tetanic force (178.95 ± 26.18 vs. 139.37 ± 17.05 g; P = 0.005) (B), although mass‐specific twitch and maximal forces were similar between groups (3.36 ± 0.50 vs. 2.86 ± 0.39 N/cm2; P = 0.056 and 20.72 ± 2.28 vs. 19.98 ± 2.29 N/cm2; P = 0.557, respectively) (C–D). Similarly, time‐to‐peak tension and half relaxation time remained unchanged (23.10 ± 2.25 vs. 22.18 ± 2.75 ms; P = 0.474 and 41.68 ± 16.33 vs. 46.08 ± 16.70 ms; P = 0.603, respectively) (E–F). However, HFpEF rats showed impairments in shortening velocity and muscle power when measured across different percentages of their maximal force (30, 40 and 50%) (P < 0.05) (G–H). [Color figure can be viewed at wileyonlinelibrary.com]
Figure 5
Figure 5. In situ EDL contractile function and femoral artery blood flow
Absolute twitch and maximal tetanic forces of the EDL muscle were lower in HFpEF rats than in controls (57.24 ± 13.82 vs. 41.62 ± 11.31 g, P = 0.016 and 224.64 ± 66.36 vs. 151.38 ± 45.45 g, P = 0.030, respectively) (B–C). However, when normalised to muscle mass, which was reduced in HFpEF rats (262.88 ± 22.47 vs. 194.73 ± 15.35 mg; P < 0.001) (A), these were not significantly affected (0.22 ± 0.05 vs. 0.22 ± 0.07 g mg−1 EDL, P < 0.968 and 0.82 ± 0.23 vs. 0.77 ± 0.21 g mg−1 EDL, P = 0.675, respectively) (D–E). The fatigue index was similar between groups (0.46 ± 0.12 vs. 0.51 ± 0.09 %; P = 0.325) (F). However, HFpEF rats tended to be more fatigable during the force‐matched protocol (45.96 ± 11.96 vs. 34.35 ± 12.08; P = 0.079) (G). Resting femoral artery blood flow was augmented in HFpEF rats (1.71 ± 0.33 vs. 2.66 ± 0.90 ml min−1; P = 0.039) (H). In contrast, HFpEF rats showed an impaired increase in muscle‐specific EDL blood flow during stimulation (2.59 ± 1.30 vs. 0.69 ± 0.37 ml min−1 g−1; P = 0.012) (I). Moreover, a reduction in the functional hyperaemic scope was also found in HFpEF (3.22 ± 1.12 vs. 1.27 ± 0.15; P = 0.004) (J). [Color figure can be viewed at wileyonlinelibrary.com]
Figure 6
Figure 6. Histological features of the diaphragm
Representative diaphragm sections from control (A) and obese‐HFpEF (B). Compared with lean controls, HFpEF rats had increased cross‐sectional area (CSA) in Type I (1130.67 ± 30.45 vs. 1647.83 ± 286.52 μm2; P < 0.001) and Type IIa fibres (1352.19 ± 133.46 vs. 1709.33 ± 273.24 μm2; P = 0.005), whereas CSA of Type IIb/IIx fibres was reduced (3109.90 ± 222.49 vs. 2418.50 ± 514.36 μm2; P = 0.004) (C). HFpEF rats also had a higher numerical percentage of Type I fibres (32.93 ± 3.46 vs. 38.38 ± 2.64 %; P = 0.003), although this remained unchanged in Type IIa (34.41 ± 4.39 vs. 30.65 ± 6.67 %; P = 0.203) and IIb/IIx fibres (32.63 ± 3.43 vs. 31.00 ± 6.63 %; P = 0.545) (D). Additionally, HFpEF rats showed a higher area percentage of Type I fibres (20.26 ± 2.37 vs. 33.12 ± 3.85 %; P < 0.001), whereas this was unchanged in Type IIa fibres (25.38 ± 3.50 vs. 27.66 ± 7.47 %; P = 0.449) and reduced in Type IIb/IIx fibres (54.36 ± 3.83 vs. 39.23 ± 10.33; P = 0.002) (E). HFpEF rats also showed general and local alterations in capillary distribution. General changes included increased capillary‐to‐fibre (C:F) ratio (1.96 ± 0.12 vs. 2.26 ± 0.28; P = 0.015) (F) and capillary density (CD) (733.42 ± 51.94 vs. 822.30 ± 104.43 mm2; P = 0.049) (G), although capillary domain area (CDA) remained unchanged (1600.57 ± 371.08 vs. 1420.58 ± 392.25 μm2; P = 0.362) (H). Local changes included increased LCFR in Type I (0.92 ± 0.08 vs. 1.39 ± 0.14; P < 0.001) and Type IIa fibres (1.05 ± 0.04 vs. 1.51 ± 0.16; P < 0.001) and reduced local capillary‐to‐fibre ratio (LCFR) in glycolytic/Type IIb/IIx fibres (2.13 ± 0.21 vs. 1.78 ± 0.37; P = 0.040) (I). In contrast, however, HFpEF rats had increased local capillary density (LCD) in Type IIb/IIx fibres (615.85 ± 45.69 vs. 700.85 ± 97.37 mm2; P = 0.042), with no changes in Type I (765.26 ± 60.76 vs. 843.27 ± 132.38 mm2; P = 0.152) and Type IIa fibres (763.78 ± 68.71 vs. 842.75 ± 119.64 mm2; P = 0.128) (J). [Color figure can be viewed at wileyonlinelibrary.com]
Figure 7
Figure 7. Modelling of diaphragm oxygen tension
Simulation of muscle PO2 at rest (A–B) and maximal rate of oxygen consumption (D–E) in representative images. Compared with lean controls, HFpEF rats showed higher muscle oxygen tension at rest (Type I fibres: 28.09 ± 0.39 vs. 28.45 ± 0.24 mmHg, P = 0.043; Type IIa: 27.80 ± 0.52 vs. 28.35 ± 0.27 mmHg, P = 0.019; Type IIb/IIx: 27.26 ± 0.70 vs. 28.13 ± 0.29 mmHg, P = 0.006; all fibres: 27.55 ± 0.61 vs. 28.28 ± 0.27, P = 0.009) (C) or at maximal rate of oxygen consumption (Type I: 22.29 ± 1.57 vs. 23.76 ± 1.06 mmHg, P = 0.045; Type IIa: 20.52 ± 2.27 vs. 22.95 ± 1.22 mmHg, P = 0.018; Type IIb/IIx: 17.33 ± 3.24 vs. 21.58 ± 1.39 mmHg, P = 0.004; all fibres: 19.07 ± 2.78 vs. 22.58 ± 1.26 mmHg, P = 0.006) (F). [Color figure can be viewed at wileyonlinelibrary.com]
Figure 8
Figure 8. Functional properties of the diaphragm
Isometric twitch and tetanic stress of the diaphragm were not different between groups (7.24 ± 2.87 vs. 8.83 ± 2.47 N/cm2, P = 0.254 and 23.09 ± 6.56 vs. 27.46 ± 7.22 N/cm2, P = 0.225, respectively) (A–B). In contrast, HFpEF rats showed slowed time‐to‐peak tension (16.48 ± 1.29 vs. 18.50 ± 1.21 ms; P = 0.006) (C), although half relaxation time was not significantly affected (19.30 ± 3.68 vs. 21.45 ± 2.02 ms; P = 0.170) (D). There were no differences in maximal shortening velocity (Vmax) (9.10 ± 1.11 vs. 8.32 ± 1.46 Lo/s; P = 0.278) (E) or peak isotonic power (212.56± 59.28 vs. 226.11 ± 69.36 W kg−1; P = 0.701) (F) between groups. During cyclical contractions, while the net power‐cycle frequency relationship remained unaltered between groups (> 0.05; typical work loops are shown at each cycle frequency for each group) (G), relative fatigue was greater in HFpEF (P < 0.001) under cycles 6–12 (H). [Color figure can be viewed at wileyonlinelibrary.com]

Comment in

Similar articles

Cited by

References

    1. Adams V, Linke A & Winzer E (2017). Skeletal muscle alterations in HFrEF vs. HFpEF. Curr Heart Fail Rep 14, 489–497. - PubMed
    1. Al‐Shammari AA, Kissane RWP, Holbek S, Mackey AL, Andersen TR, Gaffney EA, Kjaer M & Egginton S (2019). Integrated method for quantitative morphometry and oxygen transport modeling in striated muscle. J Appl Physiol 126, 544–557. - PubMed
    1. Aravamudan B, Mantilla CB, Zhan WZ & Sieck GC (2006). Denervation effects on myonuclear domain size of rat diaphragm fibers. J Appl Physiol 100, 1617–1622. - PubMed
    1. Bekfani T, Pellicori P, Morris DA, Ebner N, Valentova M, Steinbeck L, Wachter R, Elsner S, Sliziuk V, Schefold JC, Sandek A, Doehner W, Cleland JG, Lainscak M, Anker SD & von Haehling S (2016). Sarcopenia in patients with heart failure with preserved ejection fraction: Impact on muscle strength, exercise capacity and quality of life. Int J Cardiol 222, 41–46. - PubMed
    1. Benson AP, Bernus O, Dierckx H, Gilbert SH, Greenwood JP, Holden AV, Mohee K, Plein S, Radjenovic A, Ries ME, Smith GL, Sourbron S & Walton RD (2011). Construction and validation of anisotropic and orthotropic ventricular geometries for quantitative predictive cardiac electrophysiology. Interface Focus 1, 101–116. - PMC - PubMed

Publication types