. 2021 Feb;12(1):52-69.
doi: 10.1002/jcsm.12661. Epub 2020 Dec 21.

The effect of short-term exercise prehabilitation on skeletal muscle protein synthesis and atrophy during bed rest in older men

Affiliations

The effect of short-term exercise prehabilitation on skeletal muscle protein synthesis and atrophy during bed rest in older men

Benoit Smeuninx et al. J Cachexia Sarcopenia Muscle. 2021 Feb.

Abstract

Background: Poor recovery from periods of disuse accelerates age-related muscle loss, predisposing individuals to the development of secondary adverse health outcomes. Exercise prior to disuse (prehabilitation) may prevent muscle deterioration during subsequent unloading. The present study aimed to investigate the effect of short-term resistance exercise training (RET) prehabilitation on muscle morphology and regulatory mechanisms during 5 days of bed rest in older men.

Methods: Ten healthy older men aged 65-80 years underwent four bouts of high-volume unilateral leg RET over 7 days prior to 5 days of inpatient bed rest. Physical activity and step-count were monitored over the course of RET prehabilitation and bed rest, whilst dietary intake was recorded throughout. Prior to and following bed rest, quadriceps cross-sectional area (CSA), and hormone/lipid profiles were determined. Serial muscle biopsies and dual-stable isotope tracers were used to determine integrated myofibrillar protein synthesis (iMyoPS) over RET prehabilitation and bed rest phases, and acute postabsorptive and postprandial myofibrillar protein synthesis (aMyoPS) rates at the end of bed rest.

Results: During bed rest, daily step-count and light and moderate physical activity time decreased, whilst sedentary time increased when compared with habitual levels (P < 0.001 for all). Dietary protein and fibre intake during bed rest were lower than habitual values (P < 0.01 for both). iMyoPS rates were significantly greater in the exercised leg (EX) compared with the non-exercised control leg (CTL) over prehabilitation (1.76 ± 0.37%/day vs. 1.36 ± 0.18%/day, respectively; P = 0.007). iMyoPS rates decreased similarly in EX and CTL during bed rest (CTL, 1.07 ± 0.22%/day; EX, 1.30 ± 0.38%/day; P = 0.037 and 0.002, respectively). Postprandial aMyoPS rates increased above postabsorptive values in EX only (P = 0.018), with no difference in delta postprandial aMyoPS stimulation between legs. Quadriceps CSA at 40%, 60%, and 80% of muscle length decreased significantly in EX and CTL over bed rest (0.69%, 3.5%, and 2.8%, respectively; P < 0.01 for all), with no differences between legs. No differences in fibre-type CSA were observed between legs or with bed rest. Plasma insulin and serum lipids did not change with bed rest.

Conclusions: Short-term resistance exercise prehabilitation augmented iMyoPS rates in older men but did not offset the relative decline in iMyoPS and muscle mass during bed rest.

Keywords: Bed rest; Muscle; Protein synthesis; Sarcopenia.


Conflict of interest statement

None of the authors have any conflicts of interest to disclose.

Figures

Figure 1
Figure 1
Schematic overview of the longitudinal experimental design (Days 1–13; top) and the acute infusion trial conducted at the end of the bed‐rest period (Day 13; bottom).
Figure 2
Figure 2
Percentage change in quadriceps cross‐sectional area during 5 days of bed rest in healthy older men in a leg that had undergone resistance exercise prehabilitation over the preceding 7 days (EX) or the contralateral non‐exercised control leg (CTL). Magnetic resonance imaging was obtained at 20%, 40%, 60%, and 80% of the length between the top of the patella and the greater trochanter (distal to proximal). Between‐leg differences were analysed using a Student's paired t‐test. Boxes represent the 25th to 75th percentiles, error bars represent SEM, and horizontal lines and crosses within boxes represent median and mean values, respectively (n = 9). Significance was set at P < 0.05. A significant reduction in quadriceps cross‐sectional area (CSA) was noted at 40%, 60%, and 80% of muscle length (*P < 0.01, ** P < 0.001), with no between‐group differences observed at any length.
Figure 3
Figure 3
Plasma leucine concentration (A), phenylalanine concentration (B), and plasma 13C6 phenylalanine enrichment (C) measured in the experimental infusion trial (Day 13) and body water 2H enrichment measured in daily saliva samples over the course of the study (Days 1–13). (A–C) The black arrow indicates the point at which a 15 g bolus of milk protein isolate was consumed. Plasma and saliva data were analysed using a one‐way repeated‐measures ANOVA with time as the within‐subject factor. Values are means ± SEM (n = 10 for all panels). Significance was set at P < 0.05. Plasma leucine and phenylalanine concentrations were significantly increased above basal‐fasted and pre‐drink values at 20–120 and 20–90 min post‐drink, respectively (*P < 0.05 for both). Plasma 13C6 phenylalanine enrichment was significantly increased above basal‐fasted values at pre‐drink and remained elevated for the duration of the experiment (*P < 0.05). Plasma 13C6 phenylalanine enrichment at 180 min post‐drink was significantly >20, 40, 60, and 90 min post‐drink (#P < 0.05).
Figure 4
Figure 4
Integrated myofibrillar protein fractional synthesis rates over the course of 7 days of resistance exercise prehabilitation and 5 days of bed rest in exercised (EX) and non‐exercised (CTL) legs in healthy older men (A). Delta change in integrated myofibrillar protein fractional synthesis rates from prehabilitation to bed rest in EX and CTL (B). Acutely measured myofibrillar protein synthesis rates in the postabsorptive and postprandial state, after ingestion of 15 g of milk protein, in EX and CTL (C). Delta change in acute myofibrillar protein fractional synthesis rates from postabsorptive to postprandial state in EX and CTL (D). Values in (A) and (C) are means ± SEM and individual participant data (n = 10). (B) and (D) The boxes represent the 25th to 75th percentiles, error bars represent SEM, and horizontal lines and crosses within boxes represent median and mean values, respectively (n = 10). Data in (A) and (C) were analysed using a two‐way repeated‐measures ANOVA (condition × time) with condition (CTL vs. EX) and time (prehabilitation vs. post‐bed rest). Data in (B) and (D) were analysed using a Student's t‐test. Bonferroni post‐hoc tests were performed to correct for multiple comparisons when a significant condition × time interaction was identified. Significance was set at P < 0.05. Integrated myofibrillar protein synthesis (iMyoPS) was higher in EX vs. CTL during prehabilitation (#P < 0.01) and was lower during bed rest vs. prehabilitation in EX (**P < 0.01) and CTL (*P < 0.05), with no difference between groups. Acute postabsorptive and postprandial myofibrillar protein synthesis (aMyoPS) was stimulated above postabsorptive values in EX (*P < 0.05), with no differences between groups. † indicates a significant time effect of bed rest vs. prehabilitation (P < 0.05).
Figure 5
Figure 5
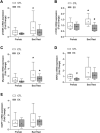
Changes in mRNA expression of p70S6K (A), mTOR (B), myostatin (C), MAFbx (D), and MuRF1 (E) after 7 days of resistance exercise prehabilitation and a subsequent 5 days of bed rest in older men. Data are expressed as the fold change from levels measured in non‐exercised control leg (CTL) after prehabilitation, which was normalized to a value of 1. All targets were measured in muscle biopsy tissue obtained in the postabsorptive state. Boxes represent the 25th to 75th percentiles, error bars represent SEM, and horizontal lines and crosses within boxes represent median and mean values, respectively [n = 9 for all targets except p70S6K (n = 8)]. Significance was set at P < 0.05. There was a significant increase in p70S6K and mTOR expression after bed rest compared with prehabilitation for CTL only (*P < 0.05 for both). There expression of mTOR after bed rest was significantly lower in EX vs. CTL (#P < 0.05). Myostatin expression was greater after bed rest compared with prehabilitation in EX and CTL (*P < 0.05) with no difference between legs. MAFbx expression was greater in CTL vs. EX after prehabilitation (#P < 0.05). There was a significant main effect of time on MAFbx expression from prehabilitation to bed rest (P = 0.016).
Figure 6
Figure 6
Changes in protein expression of AktS473, mTORS2448, 4E‐BP1T37/46 and rpS6S240/244, MuRF1, and MAFbx following 7 days of resistance exercise prehabilitation (EX) and a subsequent 5 days of bed rest in older men. AktS473, mTORS2448, 4E‐BP1T37/46, and rpS6S240/244 are expressed relative to respective total protein expression. MuRF1 and MAFbx are expressed relative to ponceau loading control. (A), (C), (E), (G), (I), and (K) show protein expression in EX and CTL after exercise prehabilitation and after bed rest and are expressed as the fold change from levels measured in control (CTL) after prehabilitation, which was normalized to a value of 1 (all targets were measured in a postabsorptive state). (B), (D), (F), (H), (L), and (L) show protein expression in EX and CTL after bed rest in the postabsorptive (BR‐PA) or 4 h postprandial state after ingestion of 15 g of milk protein (BR‐PP), expressed as the fold change from levels measured in CTL after bed rest, which was normalized to a value of 1. For all panels, boxes represent the 25th to 75th percentiles, error bars represent SEM, and horizontal lines and crosses within boxes represent median and mean values, respectively (n = 9 for all targets except Akt, mTOR, rpS6 (n = 8)). Significance was set at P < 0.05. Following bed rest, there was a significant main effect of time on AktS473 and mTORS2448 expression, which was greater than CTL values after exercise prehabilitation (# P < 0.05 for both, (A)A and (C), respectively), with no difference between legs. Following bed rest, there was a significant main effect of time on 4E‐BP1T37/46 expression, which was significantly lower than CTL values after exercise prehabilitation (# P < 0.05, (E)), with no difference between legs. Following exercise prehabilitation and bed rest, rpS6S240/244 expression was significantly higher in EX vs. CTL (*P < 0.05 for both, (G)). Following bed rest, rpS6S240/244 expression was significantly higher in EX vs. CTL in the postabsorptive and postprandial state (*P < 0.05 for both, (H)). Following bed rest, AktS473 expression was significantly lower than the postabsorptive state in EX only (# P < 0.05, (B)).

References

    1. Veronese N, Demurtas J, Soysal P, Smith L, Torbahn G, Schoene D, et al. Sarcopenia and health‐related outcomes: an umbrella review of observational studies. Euro Geri Med 2019;10:853–862. - PubMed
    1. Lee J, Hong YP, Shin HJ, Lee W. Associations of sarcopenia and sarcopenic obesity with metabolic syndrome considering both muscle mass and muscle strength. Journal of Preventive Medicine and Public Health = Yebang Uihakhoe chi 2016;49:35–44. - PMC - PubMed
    1. Ethgen O, Beaudart C, Buckinx F, Bruyere O, Reginster JY. The future prevalence of sarcopenia in Europe: a claim for public health action. Calcif Tissue Int 2017;100:229–234. - PMC - PubMed
    1. Pinedo‐Villanueva R, Westbury LD, Syddall HE, Sanchez‐Santos MT, Dennison EM, Robinson SM, et al. Health care costs associated with muscle weakness: a UK population‐based estimate. Calcif Tissue Int 2019;104:137–144. - PMC - PubMed
    1. Steffl M, Sima J, Shiells K, Holmerova I. The increase in health care costs associated with muscle weakness in older people without long‐term illnesses in the Czech Republic: results from the Survey of Health, Ageing and Retirement in Europe (SHARE). Clin Interv Aging 2017;12:2003–2007. - PMC - PubMed

Publication types