

Local Anatomic Precursors to New-Onset Geographic Atrophy in Age-Related Macular Degeneration as Defined on OCT
- PMID: 33348086
- PMCID: PMC8362836
- DOI: 10.1016/j.oret.2020.12.010
Local Anatomic Precursors to New-Onset Geographic Atrophy in Age-Related Macular Degeneration as Defined on OCT
Abstract
Purpose: In macula-wide analyses, spectral-domain (SD) optical coherence tomography (OCT) features including drusen volume, hyperreflective foci, and OCT-reflective drusen substructures independently predict geographic atrophy (GA) onset secondary to age-related macular degeneration (AMD). We sought to identify SD OCT features in the location of new GA before its onset.
Design: Retrospective study.
Participants: Age-Related Eye Disease Study 2 Ancillary SD OCT Study participants.
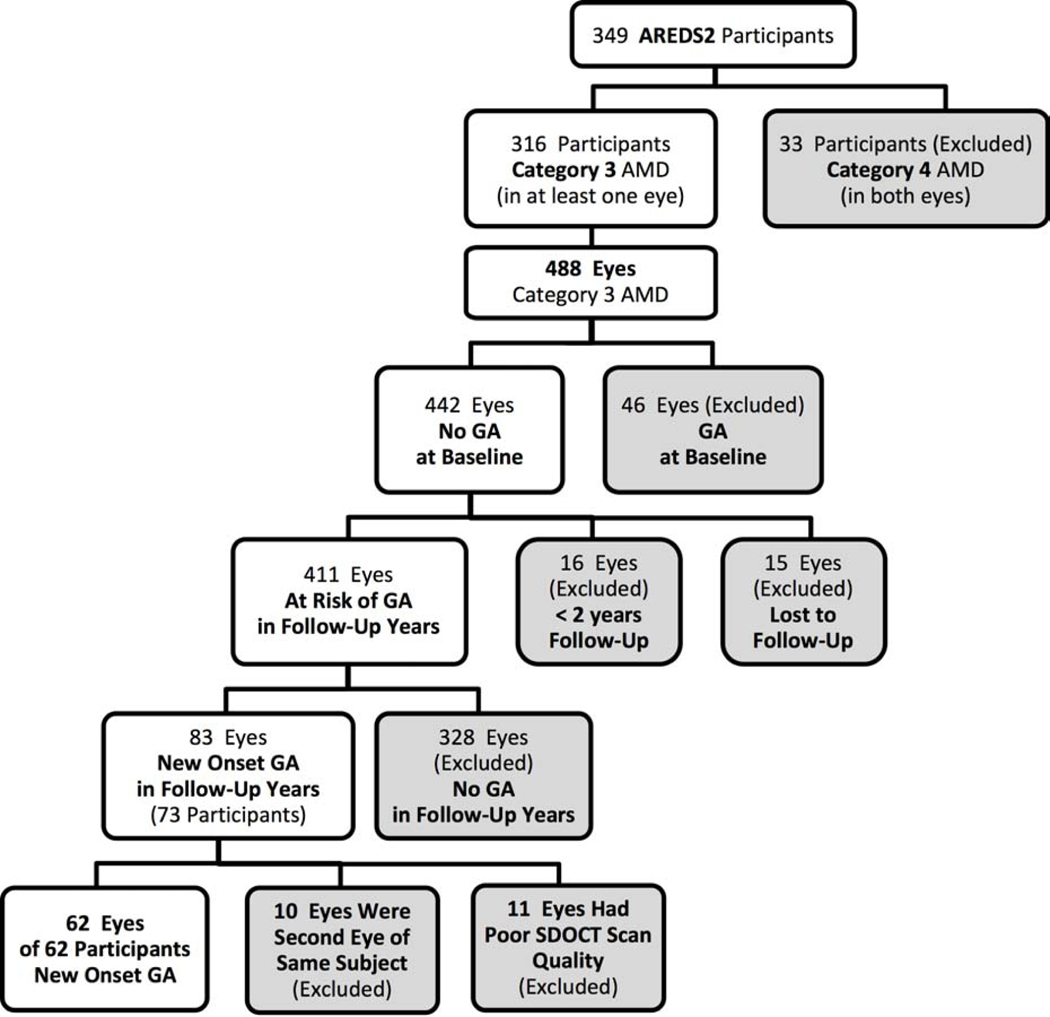
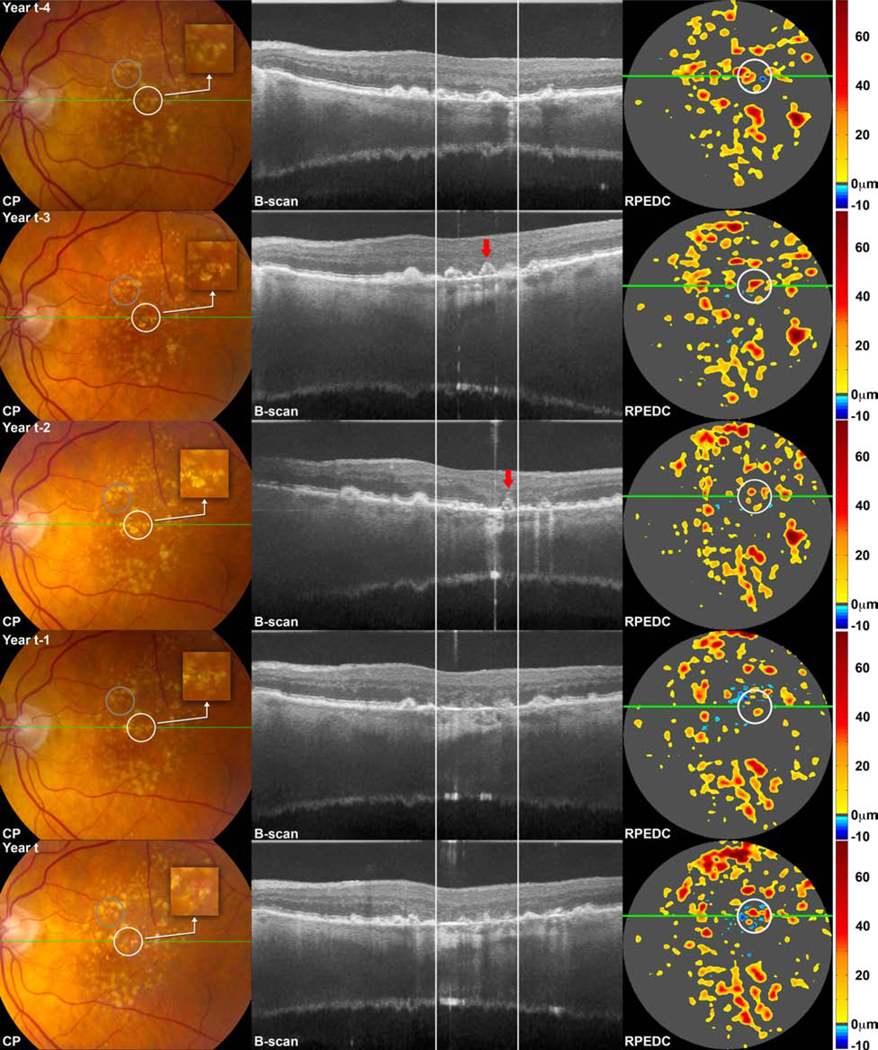
Methods: We analyzed longitudinally captured SD OCT images and color photographs from 488 eyes of 488 participants with intermediate AMD at baseline. Sixty-two eyes with sufficient image quality demonstrated new-onset GA on color photographs during study years 2 through 7. The area of new-onset GA and one size-matched control region in the same eye were segmented separately, and corresponding spatial volumes on registered SD OCT images at the GA incident year and at 2, 3, and 4 years previously were defined. Differences in SD OCT features between paired precursor regions were evaluated through matched-pairs analyses.
Main outcome measures: Localized SD OCT features 2 years before GA onset.
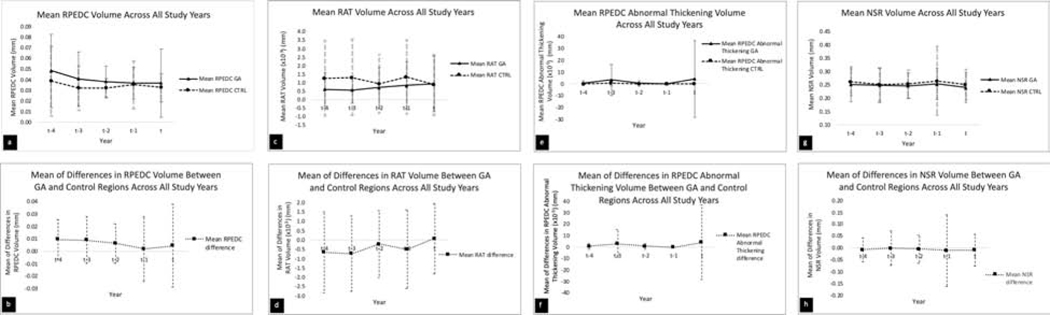
Results: Compared with paired control regions, GA precursor regions at 2, 3, and 4 years before (n = 54, 33, and 25, respectively) showed greater drusen volume (P = 0.01, P = 0.003, and P = 0.003, respectively). At 2 and 3 years before GA onset, they were associated with the presence of hypertransmission (P < 0.001 and P = 0.03, respectively), hyperreflective foci (P < 0.001 and P = 0.045, respectively), OCT-reflective drusen substructures (P = 0.004 and P = 0.03, respectively), and loss or disruption of the photoreceptor zone, ellipsoid zone, and retinal pigment epithelium (RPE, P < 0.001 and P = 0.005-0.045, respectively). At 4 years before GA onset, precursor regions were associated with photoreceptor zone thinning (P = 0.007) and interdigitation zone loss (P = 0.045).
Conclusions: Evolution to GA is heralded by early local photoreceptor changes and drusen accumulation, detectable 4 years before GA onset. These precede other anatomic heralds such as RPE changes and drusen substructure emergence detectable 1 to 2 years before GA. This study thus identified earlier end points for GA as potential therapeutic targets in clinical trials.
Keywords: Age-Related Eye Disease Study 2; Age-related macular degeneration; Geographic atrophy; Localized precursors; Spectral-domain OCT.
Copyright © 2020 American Academy of Ophthalmology. Published by Elsevier Inc. All rights reserved.
Figures
Comment in
-
Age-Related Macular Degeneration: Who Progresses to Vision-Threatening Disease? Learning to See More in the Image.Ophthalmol Retina. 2021 May;5(5):393-395. doi: 10.1016/j.oret.2021.02.010. Ophthalmol Retina. 2021. PMID: 33962757 No abstract available.
References
-
- Tomany SC, Wang JJ, Van Leeuwen R, et al.Risk factors for incident age-related macular degeneration: pooled findings from 3 continents. Ophthalmology. 2004;111(7):1280–1287. - PubMed
-
- Klein R, Klein BE, Knudtson MD, Meuer SM, Swift M, Gangnon RE. Fifteen-year cumulative incidence of age-related macular degeneration: the Beaver Dam Eye Study. Ophthalmology. 2007;114(2):253–262. - PubMed
-
- Loewenstein A. The significance of early detection of age-related macular degeneration: Richard & Hinda Rosenthal Foundation lecture, The Macula Society 29th annual meeting. Retina (Philadelphia, Pa). 2007;27(7):873–878. - PubMed
-
- Klein ML, Ferris FL 3rd, Armstrong J, et al.Retinal precursors and the development of geographic atrophy in age-related macular degeneration. Ophthalmology. 2008;115(6):1026–1031. - PubMed
MeSH terms
Grants and funding
LinkOut - more resources
Full Text Sources
Medical
