. 2020 Dec 17;25(24):5976.
doi: 10.3390/molecules25245976.

Quantification of Trastuzumab-HER2 Engagement In Vitro and In Vivo

Affiliations

Quantification of Trastuzumab-HER2 Engagement In Vitro and In Vivo

Alena Rudkouskaya et al. Molecules. .

Abstract

Human EGF Receptor 2 (HER2) is an important oncogene driving aggressive metastatic growth in up to 20% of breast cancer tumors. At the same time, it presents a target for passive immunotherapy such as trastuzumab (TZM). Although TZM has been widely used clinically since 1998, not all eligible patients benefit from this therapy due to primary and acquired drug resistance as well as potentially lack of drug exposure. Hence, it is critical to directly quantify TZM-HER2 binding dynamics, also known as cellular target engagement, in undisturbed tumor environments in live, intact tumor xenograft models. Herein, we report the direct measurement of TZM-HER2 binding in HER2-positive human breast cancer cells and tumor xenografts using fluorescence lifetime Forster Resonance Energy Transfer (FLI-FRET) via near-infrared (NIR) microscopy (FLIM-FRET) as well as macroscopy (MFLI-FRET) approaches. By sensing the reduction of fluorescence lifetime of donor-labeled TZM in the presence of acceptor-labeled TZM, we successfully quantified the fraction of HER2-bound and internalized TZM immunoconjugate both in cell culture and tumor xenografts in live animals. Ex vivo immunohistological analysis of tumors confirmed the binding and internalization of TZM-HER2 complex in breast cancer cells. Thus, FLI-FRET imaging presents a powerful analytical tool to monitor and quantify cellular target engagement and subsequent intracellular drug delivery in live HER2-positive tumor xenografts.

Keywords: FRET imaging; HER2; fluorescence lifetime; immunoconjugate; target engagement; trastuzumab.


Conflict of interest statement

The authors declare no conflict of interest.

Figures

Figure 1
Figure 1
Confocal microscopy of Human EGF Receptor 2 (HER2) and trastuzumab (TZM)–AF700 distribution in AU565 cells. (A) Immunofluorescence analysis of HER2 (green; arrows), early endosomal antigen 1 (EEA1), or transferrin receptor (TfR) (red; arrows). Middle slices of z-stacks consisting of 6–8 optical slices are shown. (B) AU565 cells were loaded with 5 µg/mL TZM–AF700 (red) and 5 µg/mL Tf–AF568 (magenta) for 24 h and then processed for immunostaining of HER2 (green) and endosomal markers EEA1 or TfR (magenta). Maximum intensity projections of z-stacks consisting of 6–8 optical slices are shown. Nuclei are visualized with DAPI. Scale bar = 20 µm.
Figure 2
Figure 2
Comparison of intracellular uptake of TZM–AF700 into HER2-positive and HER2-negative cell lines. (A) To test the specificity of HER2-mediated TZM–AF700 binding and internalization, competition experiments were performed. AU565 cells were loaded with 5 µg/mL TZM–AF700 (red) and 5 µg/mL Tf-AF568 (green) in the presence of increasing amounts of unlabeled TZM. Single slice confocal microscopy displays TZM–AF700 (red) and Tf–AF568 (green) binding and internalization into AU565 cells in the presence of increasing 0×, 10×, 50×, and 100× unlabeled TZM. (B) HER2-positive AU565 and HER2-negative MDA-MB-231 and MCF10A cells were subjected to 24 h uptake of 20 µg/mL TZM–AF700 (red) and then processed for anti-HER2 immunostaining (green). Nuclei were visualized with DAPI (blue). Maximum intensity projections of z-stacks consisting of 6–8 optical slices are shown. Confocal images were collected using identical settings on an LSM880 confocal microscope. Scale bar = 20 µm.
Figure 3
Figure 3
TZM Forster Resonance Energy Transfer (FLI-FRET) microscopy (FLIM-FRET) analysis in AU565 cancer cells. (A) The representative time-correlated single photon counting (TCSPC) images of fluorescence intensity and mean lifetime map (τm) in cells treated with TZM-AF700 only [Acceptor/Donor (A:D) = 0:1; donor single-labeled] or with TZM–AF700 plus TZM–AF750 (A:D = 2:1; double-labeled); pseudo-color range = 500–1500 ps. Zoomed regions of interest (ROIs) of both single and double-labeled cells show heterogeneity of fluorescence lifetime of TZM–AF700 within the cells. White arrows indicate x, y coordinates used for the curve fitting using SPCImage. Scale bar = 50 µm. (B) Representative fitting curves and IRF, the fluorescent lifetime decay in the single and double-labeled cells was determined by comparing the fitting of the decay data using both single- and double-exponential decay models, respectively. (C) Fluorescent lifetime distribution in AU565 cells treated with TZM–AF700 (A:D = 0:1) or TZM–AF700 and TZM–AF750 (A:D = 2:1). (D) Quantification of FRET donor (FD%) levels in AU565 cells treated with a near-infrared (NIR) TZM–FRET pair at various A:D ratios. Analysis was performed using 10 distinct pixel coordinates (n = 10) from five independent ROIs; error bars represent confidence interval at 95%. (E) Quantification of TZM–FRET efficiency (E) in relation to A:D ratios. Data presented as mean ± confidence interval at 95%, n = 10.
Figure 3
Figure 3
TZM Forster Resonance Energy Transfer (FLI-FRET) microscopy (FLIM-FRET) analysis in AU565 cancer cells. (A) The representative time-correlated single photon counting (TCSPC) images of fluorescence intensity and mean lifetime map (τm) in cells treated with TZM-AF700 only [Acceptor/Donor (A:D) = 0:1; donor single-labeled] or with TZM–AF700 plus TZM–AF750 (A:D = 2:1; double-labeled); pseudo-color range = 500–1500 ps. Zoomed regions of interest (ROIs) of both single and double-labeled cells show heterogeneity of fluorescence lifetime of TZM–AF700 within the cells. White arrows indicate x, y coordinates used for the curve fitting using SPCImage. Scale bar = 50 µm. (B) Representative fitting curves and IRF, the fluorescent lifetime decay in the single and double-labeled cells was determined by comparing the fitting of the decay data using both single- and double-exponential decay models, respectively. (C) Fluorescent lifetime distribution in AU565 cells treated with TZM–AF700 (A:D = 0:1) or TZM–AF700 and TZM–AF750 (A:D = 2:1). (D) Quantification of FRET donor (FD%) levels in AU565 cells treated with a near-infrared (NIR) TZM–FRET pair at various A:D ratios. Analysis was performed using 10 distinct pixel coordinates (n = 10) from five independent ROIs; error bars represent confidence interval at 95%. (E) Quantification of TZM–FRET efficiency (E) in relation to A:D ratios. Data presented as mean ± confidence interval at 95%, n = 10.
Figure 4
Figure 4
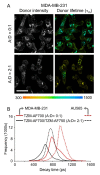
TZM FLIM-FRET analysis in MDA-MB-231 cancer cells. (A) The representative TCSPC images of fluorescence intensity and mean lifetime map (τm) in cells treated with TZM–AF700 (A:D = 0:1) or with TZM–AF700 plus TZM–AF750 (A:D = 2:1) pseudo-color range = 300–1500 ps. Scale bar = 50 µm. (B) Comparison of fluorescent lifetime distribution in MDA-MB-231 (solid lines) and AU565 cells (dashed lines) treated with TZM–AF700 (A:D = 0:1 red), TZM–AF700 plus TZM–AF750 (A:D = 2:1 black).
Figure 5
Figure 5
Schematic representation of live small animal NIR wide-field time-resolved macroscopic fluorescence lifetime FRET imaging (MFLI-FRET) for preclinical studies. (A) AU565 tumor xenograft production; (B) Intravenous tail-vein injection of AF700–TZM and/or AF750–TZM; (C) Live small animal imaging using wide-field time-resolved FLI-FRET macroscopy (MFLI-FRET) imager; (D) Ex vivo validation using immunohistochemical (IHC) and H&E staining. Inset top left: illustration of TZM–AF700 and TZM–AF750 ligands. Inset bottom right: illustration of TZM–HER2 FLI-FRET events upon binding of donor- and acceptor-labeled antibodies to HER2 dimer at the surface of cancer cells. DMD: digital micromirror device; CCD: charge-coupled device.
Figure 6
Figure 6
Whole body quantification of TZM–HER2 engagement via MFLI-FRET in vivo imaging. (A) Mice were injected with 20 µg TZM–AF700 alone (M1) or TZM–AF700 and 40 µg TZM–AF750 and subjected to MFLI-FRET imaging at 48 h p.i. Panels show TZM donor maximum intensity ROIs (both soluble and bound probe) and FRET donor fraction (FD%) map (bound and internalized probe) in the tumors (T), livers (LV), and urinary bladders (UB). (B) Histograms of FD% retrieved for each tumor. Numbers represent mean ±SD. (C) Quantification of FD% in the tumors, bladders and livers. Data presented as box indicating 25–75% pixel values, horizontal and vertical lines indicate mean with ±1.5 SD, respectively.
Figure 6
Figure 6
Whole body quantification of TZM–HER2 engagement via MFLI-FRET in vivo imaging. (A) Mice were injected with 20 µg TZM–AF700 alone (M1) or TZM–AF700 and 40 µg TZM–AF750 and subjected to MFLI-FRET imaging at 48 h p.i. Panels show TZM donor maximum intensity ROIs (both soluble and bound probe) and FRET donor fraction (FD%) map (bound and internalized probe) in the tumors (T), livers (LV), and urinary bladders (UB). (B) Histograms of FD% retrieved for each tumor. Numbers represent mean ±SD. (C) Quantification of FD% in the tumors, bladders and livers. Data presented as box indicating 25–75% pixel values, horizontal and vertical lines indicate mean with ±1.5 SD, respectively.
Figure 7
Figure 7
IHC ex vivo validation confirms TZM accumulation in the cancer cells both positive for HER2 and HER3. Consecutive sections of tumors M1–M3 and tumor from untreated mouse were processed for H&E staining, anti-HER2, anti-HER3, and anti-TZM immunohistochemical staining. NovaRED was used as peroxidase substrate (brown stain), tissue was counterstained with methyl green. Scale bar = 100 µm.

Similar articles

Cited by

References

    1. Yan M., Schwaederle M., Arguello D., Millis S.Z., Gatalica Z., Kurzrock R. HER2 expression status in diverse cancers: Review of results from 37,992 patients. Cancer Metastasis Rev. 2015;34:157–164. doi: 10.1007/s10555-015-9552-6. - DOI - PMC - PubMed
    1. Swain S.M., Baselga J., Kim S.B., Ro J., Semiglazov V., Campone M., Ciruelos E., Ferrero J.M., Schneeweiss A., Heeson S., et al. Pertuzumab, trastuzumab, and docetaxel in HER2-positive metastatic breast cancer. N. Engl. J. Med. 2014;372:724–734. doi: 10.1056/NEJMoa1413513. - DOI - PMC - PubMed
    1. Boku N. HER2-positive gastric cancer. Gastric Cancer. 2014;17:1–12. doi: 10.1007/s10120-013-0252-z. - DOI - PMC - PubMed
    1. Kümler I., Tuxen M.K., Nielsen D.L. A systematic review of dual targeting in HER2-positive breast cancer. Cancer Treat. Rev. 2014;40:259–270. doi: 10.1016/j.ctrv.2013.09.002. - DOI - PubMed
    1. Vu T., Claret F.X. Trastuzumab: Updated mechanisms of action and resistance in breast cancer. Front. Oncol. 2012;2:62. doi: 10.3389/fonc.2012.00062. - DOI - PMC - PubMed