Randomized Controlled Trial
. 2020 Dec 17;12(12):3858.
doi: 10.3390/nu12123858.

Effects of Daily Raspberry Consumption on Immune-Metabolic Health in Subjects at Risk of Metabolic Syndrome: A Randomized Controlled Trial

Affiliations
Randomized Controlled Trial

Effects of Daily Raspberry Consumption on Immune-Metabolic Health in Subjects at Risk of Metabolic Syndrome: A Randomized Controlled Trial

Maximilien Franck et al. Nutrients. .

Abstract

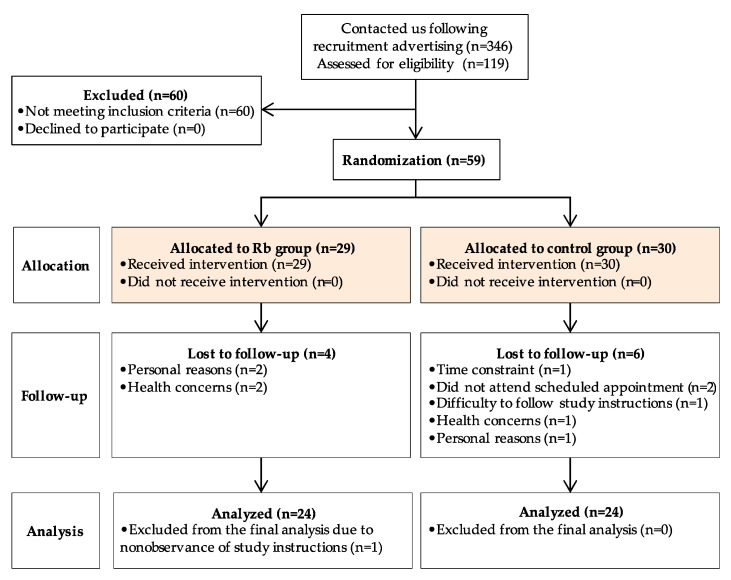
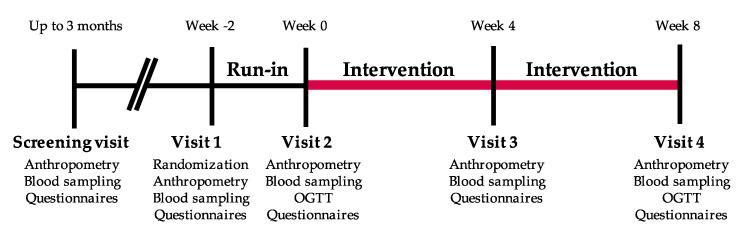
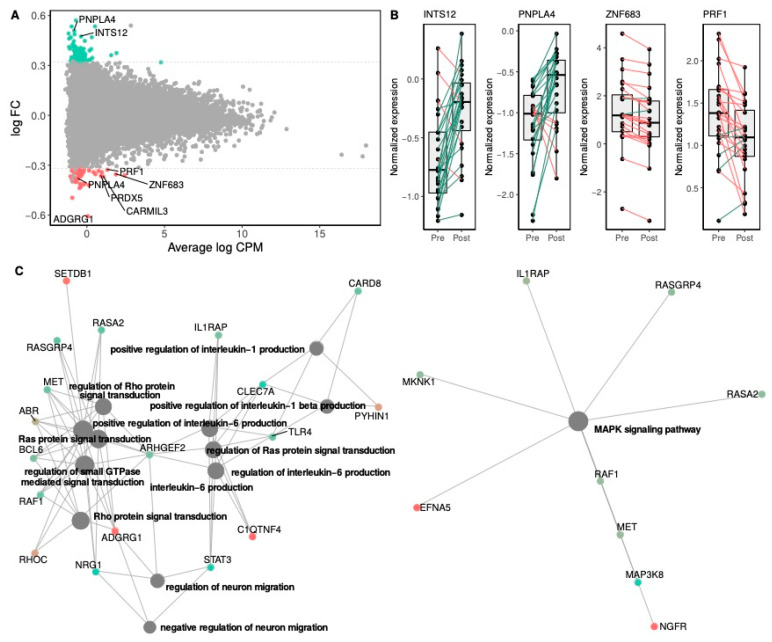
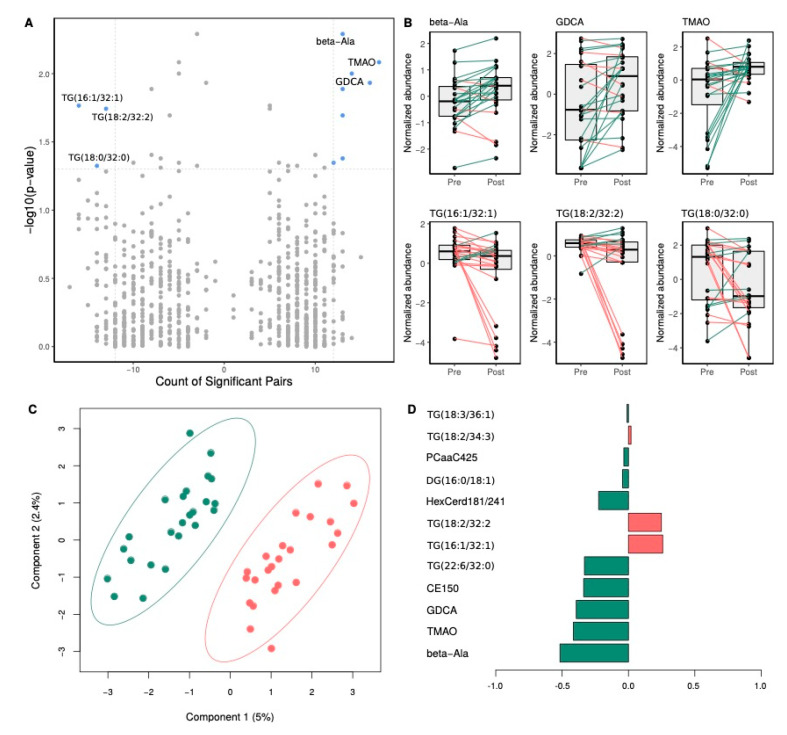
Consumption of red raspberries has been reported to exert acute beneficial effects on postprandial glycemia, insulinemia, triglyceridemia, and cytokine levels in metabolically disturbed subjects. In a two-arm parallel-group, randomized, controlled trial, 59 subjects with overweight or abdominal obesity and with slight hyperinsulinemia or hypertriglyceridemia were randomized to consume 280 g/day of frozen raspberries or to maintain their usual diet for 8 weeks. Primary analyses measured metabolic differences between the groups. Secondary analyses performed with omics tools in the intervention group assessed blood gene expression and plasma metabolomic changes following the raspberry supplementation. The intervention did not significantly affect plasma insulin, glucose, inflammatory marker concentrations, nor blood pressure. Following the supplementation, 43 genes were differentially expressed, and several functional pathways were enriched, a major portion of which were involved in the regulation of cytotoxicity, immune cell trafficking, protein signal transduction, and interleukin production. In addition, 10 serum metabolites were found significantly altered, among which β-alanine, trimethylamine N-oxide, and bioactive lipids. Although the supplementation had no meaningful metabolic effects, these results highlight the impact of a diet rich in raspberry on the immune function and phospholipid metabolism, thus providing novel insights into potential immune-metabolic pathways influenced by regular raspberry consumption.

Keywords: berry fruits; gene expression; immunity; metabolic syndrome; multi-omics; phenolic compounds; sphingolipids.


Conflict of interest statement

The authors declare no conflict of interest. The funders had no role in the design of the study, data collection and analysis, interpretation of results, decision to publish, or redaction of the manuscript.

Figures

Figure 1
Figure 1
Patient flow diagram for recruitment, randomization, and data collection.
Figure 2
Figure 2
Graphical representation of the study protocol.
Figure 3
Figure 3
Gene expression change between pre- and post-supplementation states in the Rb group. Panel (A) shows the log2 average abundance of transcripts in counts per million mapped reads (log CPM) on the x-axis and the log2 fold-change (log FC) on the y-axis. Non-significant genes are represented by grey dots. Over- and under-expressed genes (FC > 1.25) with unadjusted significant differences (paired t-test p-value < 0.05) are colored in green and red, respectively. Significant differentially expressed genes from paired t-tests (p-value < 0.001) and showing at least a 1.25 FC are labeled with gene names. The dashed lines represent 1.25 FC. Panel (B) shows the top differentially expressed genes between pre- and post-supplementation states in the Rb group. Box and whisker plots show median, first, and third quartiles, and maximum and minimum values for the 24 sample pairs before (Pre) and after (Post) the Rb supplementation. The three transcripts, which exhibited the most significant (p-value < 0.001) over- and under-expression derived from paired t-tests (post vs. pre), are shown on the top and bottom rows, respectively. Green and red lines stand for increasing or decreasing gene expression levels between pre- and post-supplementation states within individual paired samples. Panel (C) shows network plots of enriched terms following the Rb supplementation. Network plots depict the linkages among differentially regulated gene clusters and functional enriched terms in the Gene Ontology Biological Processes (GO-BP) (left) and Kyoto Encyclopedia of Genes and Genomes (KEGG) (right) pathway databases. The size of the grey dots is proportional to the number of genes in the enriched pathway (from 7 to 13 genes), and the red-to-green color gradient of gene dots represents the direction of the gene expression fold-change following the Rb supplementation.
Figure 4
Figure 4
Impact of Rb supplementation on plasma metabolite levels. Panel (A) shows a volcano plot of paired comparisons between metabolite plasma levels in pre- and post-supplementation groups. On the x-axis, a count of significant sample pairs is shown. On the y-axis, the minus logarithm of paired t-test p-values is shown. Metabolites showing statistically significant changes following the Rb supplementation (p-value < 0.05 and fold change > 1.25) are depicted as blue dots on the right (increase) and left (decrease) top corners. Top-three significantly different metabolites of both increasing and decreasing values are labeled. Panel (B) shows top metabolites showing significant changes following Rb supplementation. Box and whisker plots show median, first, and third quartiles, and maximum and minimum values for the 24 sample pairs before (Pre) and after (Post) the Rb supplementation. The three metabolites, which exhibited the most significant decrease and increase following the supplementation, are shown on the top and bottom rows, respectively. Green and red lines stand for increasing or decreasing plasma metabolite levels between pre- and post-supplementation states within individual paired samples. Panel (C) shows a bi-dimensional score plot depicting the distinct plasma metabolomic profile between pre- (red dots) and post-supplementation (green dots) paired participants. The two principal components of the smPLS-DA model along with their corresponding variance in group discrimination are shown on y- and x-axis, respectively. Panel (D) shows a loading plot representing the top 10 metabolites selected on the first component of the smPLS-DA model. Most important metabolites in group discrimination are ordered according to their loading weights (horizontal bars), from bottom to top. Bar color indicates the group for which the mean value is the highest for each feature (orange and green stand for pre- and post-supplementation groups, respectively).

References

    1. Eichelmann F., Schwingshackl L., Fedirko V., Aleksandrova K. Effect of plant-based diets on obesity-related inflammatory profiles: A systematic review and meta-analysis of intervention trials. Obes. Rev. 2016;17:1067–1079. doi: 10.1111/obr.12439. - DOI - PubMed
    1. Reynolds A., Mann J., Cummings J., Winter N., Mete E., Morenga L.T. Carbohydrate quality and human health: A series of systematic reviews and meta-analyses. Lancet. 2019;393:434–445. doi: 10.1016/S0140-6736(18)31809-9. - DOI - PubMed
    1. O’Keefe S.J. The association between dietary fibre deficiency and high-income lifestyle-associated diseases: Burkitt’s hypothesis revisited. Lancet Gastroenterol. Hepatol. 2019;4:984–996. doi: 10.1016/S2468-1253(19)30257-2. - DOI - PMC - PubMed
    1. Alberti K., Eckel R.H., Grundy S.M., Zimmet P.Z., Cleeman J.I., Donato K.A., Fruchart J.-C., James W.P.T., Loria C.M., Smith S.C. Harmonizing the Metabolic Syndrome. Circulation. 2009;120:1640–1645. doi: 10.1161/CIRCULATIONAHA.109.192644. - DOI - PubMed
    1. Health Canada Canada’s Dietary Guidelines. [(accessed on 31 October 2020)];2019 Available online: https://food-guide.canada.ca/en/guidelines.

Publication types

MeSH terms