. 2020 Dec 17;21(24):9624.
doi: 10.3390/ijms21249624.

Physiological, Biochemical, and Transcriptomic Responses of Neolamarckia cadamba to Aluminum Stress

Affiliations

Physiological, Biochemical, and Transcriptomic Responses of Neolamarckia cadamba to Aluminum Stress

Baojia Dai et al. Int J Mol Sci. .

Abstract

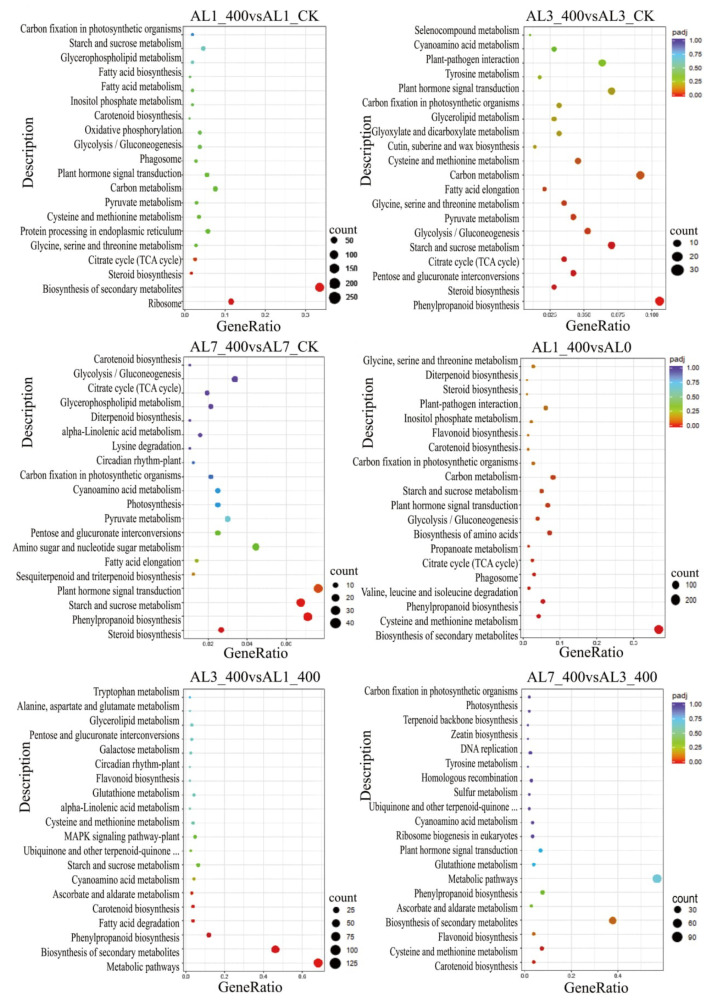
Aluminum is the most abundant metal of the Earth's crust accounting for 7% of its mass, and release of toxic Al3+ in acid soils restricts plant growth. Neolamarckia cadamba, a fast-growing tree, only grows in tropical regions with acidic soils. In this study, N. cadamba was treated with high concentrations of aluminum under acidic condition (pH 4.5) to study its physiological, biochemical, and molecular response mechanisms against high aluminum stress. High aluminum concentration resulted in significant inhibition of root growth with time in N. cadamba. The concentration of Al3+ ions in the root tip increased significantly and the distribution of absorbed Al3+ was observed in the root tip after Al stress. Meanwhile, the concentration of Ca, Mg, Mn, and Fe was significantly decreased, but P concentration increased. Aluminum stress increased activities of antioxidant enzymes such as superoxide dismutase (SOD), catalase from micrococcus lysodeiktic (CAT), and peroxidase (POD) in the root tip, while the content of MDA was decreased. Transcriptome analysis showed 37,478 differential expression genes (DEGs) and 4096 GOs terms significantly associated with treatments. The expression of genes regulating aluminum transport and abscisic acid synthesis was significantly upregulated; however, the genes involved in auxin synthesis were downregulated. Of note, the transcripts of several key enzymes affecting lignin monomer synthesis in phenylalanine pathway were upregulated. Our results shed light on the physiological and molecular mechanisms of aluminum stress tolerance in N. cadamba.

Keywords: DEGs; Neolamarckia cadamba; ROS; aluminum stress; hormone; signal transduction.


Conflict of interest statement

The authors declare no conflict of interest.

Figures

Figure 1
Figure 1
Effects of different concentrations of AlCl3 stress. (A) The comparison of plant, leaf, and root traits of 0 μM (CK), 50 μM, 100 μM, 200 μM, and 400 μM AlCl3 treatment for 24days. (B) Changing trend of root length under different concentrations of AlCl3 stress. (C) Changing trend of plant height under different concentrations of AlCl3 stress. (D) Changes of aboveground biomass under AlCl3 treatment for 0 days and 7 days. (E) Changes of belowground biomass under AlCl3 treatment for 0 days and 7 days. Results are mean ± SD of three biological replicates. ck-control. 0–0 μM/L, 50–50 μM/L, 100–100 μM/L, 200–200 μM/L, 400–400 μM/L.
Figure 2
Figure 2
Aluminum stress inhibits the growth of stems and roots. (A,B) Stem section of control group and treatment group at 1 day. (C,D) Stem section of control group and treatment group at 3 days. (E,F) Stem section of control group and treatment group at 7 days. (G) Root tip section of control group at 1 day. (H) Root tip section of control group at 7 days. (I) Root tip section of treatment group at 7 days. The scale bar is 200 μm. (J) Total root length. (K) Cross number. (L) Surface area. (M) Branch root number. (N) Root tip number. (O) Total root volume. The error line represents the average ±SD of the three organisms. The * above the column chart indicated that the growth change between the two samples was significant (Students’ t-test,* p < 0.05, ** p < 0.01).
Figure 3
Figure 3
Absorption and distribution of aluminum by root tip. (A) Distribution of aluminum in root tip in different periods; the length of the root tip is 1 cm. Eriochrome cyanine R staining does not show red and brown as the control group, but shows red and blue as the treatment group. (B-I) Changes of element concentration in root tip. The error line represents the average ± SD of the three organisms (Students’ t-test, * p < 0.05, ** p < 0.01).
Figure 4
Figure 4
Effects of aluminum stress on ROS and chlorophyll. (AH) Changes of ROS in leaves and root tips. (I) Chlorophyll content change. The error line represents the average ± SD of the three organisms. The * above the column chart shows that the content of elements between the two samples was significant (Students’ t-test, * p < 0.05, ** p < 0.01).
Figure 5
Figure 5
qRT-PCR verifies the relative expression levels of differential expression genes (DEGs) at different times under aluminum stress. Transport (evm.TU.Contig488.39, evm.TU.Contig519.36, evm.TU.Contig154.214, evm.TU.Contig154.133, evm.TU.Contig491.4, evm.TU.Contig63.553); transcription factor (evm.TU.Contig96.34, evm.TU.Contig948.4, evm.TU.Contig151.18, evm.TU.Contig84.515); protein (evm.TU.Contig368.51, evm.TU.Contig81.157, evm.TU.Contig 171.52, evm.TU.Contig583.176, evm.TU.Contig207.236, evm.TU.Contig66.895, evm.TU.Contig 21.81).
Figure 6
Figure 6
The DEGs of N.cadamba in response to aluminum stress. (A) Principal component analysis (PCA) of DEGs: diagram of treatment group and control group at 0 days, 1 day, 3 days, 7 days, the dots with the same color represent 3 biological replicates of the same treatment group, the blue area and the red area are the treatment group and control group gene cluster, respectively. (B) The green bar represents all DEGs, downregulated DEGs are in blue, and upregulated DEGs are in red, FDR < 0.05. (C,D) The overlapping area represents the DEGs with a common regulation mode between different treatments.
Figure 7
Figure 7
KEGG (Kyoto Encyclopedia of Genes and Genomes) enrichment of six comparative combinations of aluminum stress in different periods. The ordinate indicates the name of the pathway, the abscissa indicates the rich factor, the size of the dot indicates the number of differentially expressed genes in the pathway, and the color of the dot corresponds to different q value ranges.
Figure 8
Figure 8
Differential gene GO enrichment among different combinations of aluminum stress comparison. The abscissa is the GO term, the enrichment is the number of differential genes in the term, and 27 GO terms with the most significant enrichment in different periods are selected to show in the map. The red bar column represents the DEGs which enriched on biological process; the blue bar column represents the DEGs which enriched on molecular function; the yellow bar column represents DEGs which enriched on cellular component.
Figure 9
Figure 9
Expression of cell wall-related genes induced by aluminum stress. (A) Enrichment of DEGs in the phenylalanine pathway. (BD) XTH/PME family DEGs relative expression. FDR < 0.05, |log2(FoldChange)| > 1. The * above the column chart showed that the electrical conductivity changed significantly between the two samples (* p < 0.05, ** p < 0.01).
Figure 10
Figure 10
Expression of related transporters and transcription factors induced by aluminum stress. The threshold of FDR < 0.05, |log2 (FoldChange)| > 1 was used to screen the changes of differential gene expression between the treated group and the control group after aluminum stress at different times. (A) Heat map of aluminum transport-related gene and related protein kinase expression induced by aluminum stress. (B) Heat map of transcription factor-related gene expression induced by aluminum stress.
Figure 11
Figure 11
Aluminum stress induces the expression of ROS and hormone-related genes. The threshold of FDR < 0.05, |log2 (FoldChange)| > 1 was used to screen DEGs between the treated group and the control group after aluminum stress at different times. (A) Heat map of hormone-related gene expression. (B) Heat map of ROS-related gene expression.
Figure 12
Figure 12
Aluminum stress pathway diagram at the cell level in N. cadamba. The green solid line indicates that the upstream gene regulation activates the downstream gene, the red solid line indicates that the upstream gene regulation suppresses the downstream gene, and the yellow dotted line indicates that the upstream gene indirectly or possibly regulates the downstream gene and responds to stress response.

Similar articles

Cited by

References

    1. Schmitt M., Watanabe T., Jansen S. The effects of aluminium on plant growth in a temperate and deciduous aluminium accumulating species. AoB PLANTS. 2016;8:8. doi: 10.1093/aobpla/plw065. - DOI - PMC - PubMed
    1. Hoekenga O.A., Vision T.J., Shaff J.E., Monforte A.J., Lee G.P., Howell S.H., Kochian L.V. Identification and characterization of aluminum tolerance loci in Arabidopsis (Landsberg erecta x Columbia) by quantitative trait locus mapping. A physiologically simple but genetically complex trait. Plant Physiol. 2003;132:936–948. doi: 10.1104/pp.103.023085. - DOI - PMC - PubMed
    1. Von Wiren N. Faculty Opinions Recommendation of Plasma Membrane-Localized Transporter for Aluminum in Rice. Proc. Natl. Acad. Sci. USA. 2010;107:18381–18385. - PMC - PubMed
    1. Samac D.A., Tesfaye M. Plant improvement for tolerance to aluminum in acid soils—A review. Plant Cell Tissue Organ Cult. (PCTOC) 2003;75:189–207. doi: 10.1023/A:1025843829545. - DOI
    1. Huynh V.-B., Repellin A., Zuily-Fodil Y., Pham-Thi A.-T. Aluminum stress response in rice: Effects on membrane lipid composition and expression of lipid biosynthesis genes. Physiol. Plant. 2012;146:272–284. doi: 10.1111/j.1399-3054.2012.01622.x. - DOI - PubMed

MeSH terms

LinkOut - more resources