

Correlation analysis between disease severity and inflammation-related parameters in patients with COVID-19: a retrospective study
- PMID: 33349241
- PMCID: PMC7750784
- DOI: 10.1186/s12879-020-05681-5
Correlation analysis between disease severity and inflammation-related parameters in patients with COVID-19: a retrospective study
Abstract
Background: COVID-19 is highly contagious, and the crude mortality rate could reach 49% in critical patients. Inflammation concerns on disease progression. This study analyzed blood inflammation indicators among mild, severe and critical patients, helping to identify severe or critical patients early.
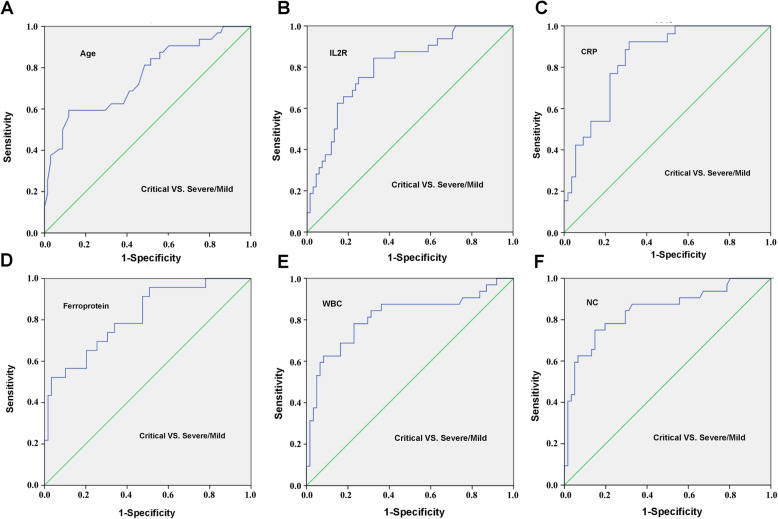
Methods: In this cross-sectional study, 100 patients were included and divided into mild, severe or critical groups according to disease condition. Correlation of peripheral blood inflammation-related indicators with disease criticality was analyzed. Cut-off values for critically ill patients were speculated through the ROC curve.
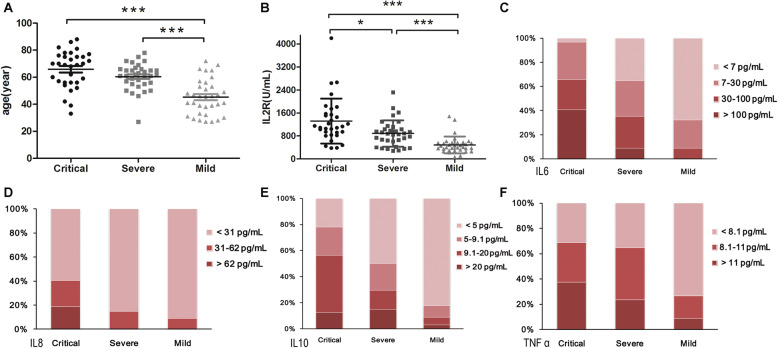
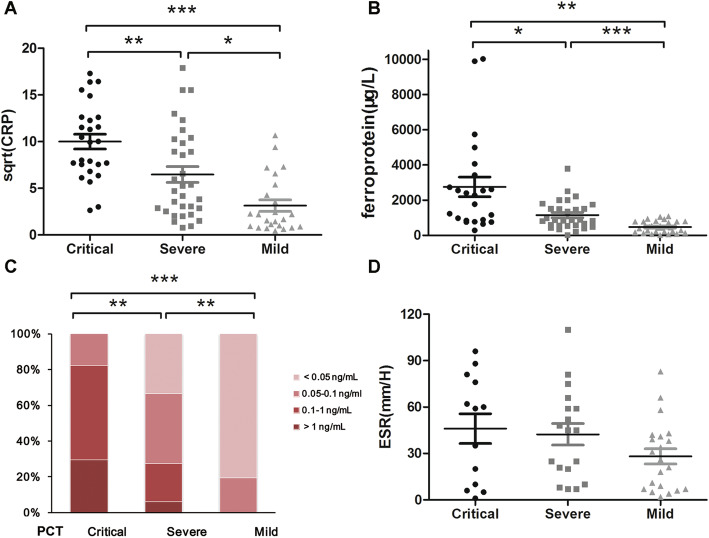
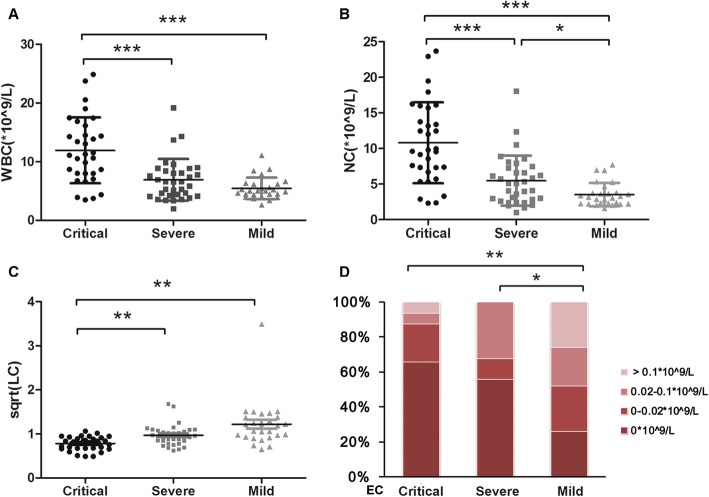
Results: Significantly, disease severity was associated with age (R = -0.564, P < 0.001), interleukin-2 receptor (IL2R) (R = -0.534, P < 0.001), interleukin-6 (IL-6) (R = -0.535, P < 0.001), interleukin-8 (IL-8) (R = -0.308, P < 0.001), interleukin-10 (IL-10) (R = -0.422, P < 0.001), tumor necrosis factor α (TNFα) (R = -0.322, P < 0.001), C-reactive protein (CRP) (R = -0.604, P < 0.001), ferroprotein (R = -0.508, P < 0.001), procalcitonin (R = -0.650, P < 0.001), white cell counts (WBC) (R = -0.54, P < 0.001), lymphocyte counts (LC) (R = 0.56, P < 0.001), neutrophil count (NC) (R = -0.585, P < 0.001) and eosinophil counts (EC) (R = 0.299, P < 0.001). With IL2R > 793.5 U/mL or CRP > 30.7 ng/mL, the progress of COVID-19 to critical stage should be closely observed and possibly prevented.
Conclusions: Inflammation is closely related to severity of COVID-19, and IL-6 and TNFα might be promising therapeutic targets.
Keywords: Blood cell count; COVID-19; Cytokine; Disease severity; Inflammation.
Conflict of interest statement
There was no conflict of interest between the authors.
Figures
References
-
- The Novel Coronavirus Pneumonia Emergency Response Epidemiology Tanm The epidemiological characteristics of an outbreak of 2019 novel coronavirus diseases (covid-19) in China. Zhonghua Liu Xing Bing Xue Za Zhi. 2020;41(2):145–151.
MeSH terms
Substances
Grants and funding
LinkOut - more resources
Full Text Sources
Other Literature Sources
Medical
Molecular Biology Databases
Research Materials
Miscellaneous
