. 2021 Mar;47(3):693-709.
doi: 10.1016/j.ultrasmedbio.2020.10.010. Epub 2021 Jan 7.

Cavitation Emissions Nucleated by Definity Infused through an EkoSonic Catheter in a Flow Phantom

Affiliations

Cavitation Emissions Nucleated by Definity Infused through an EkoSonic Catheter in a Flow Phantom

Maxime Lafond et al. Ultrasound Med Biol. 2021 Mar.

Erratum in

Abstract

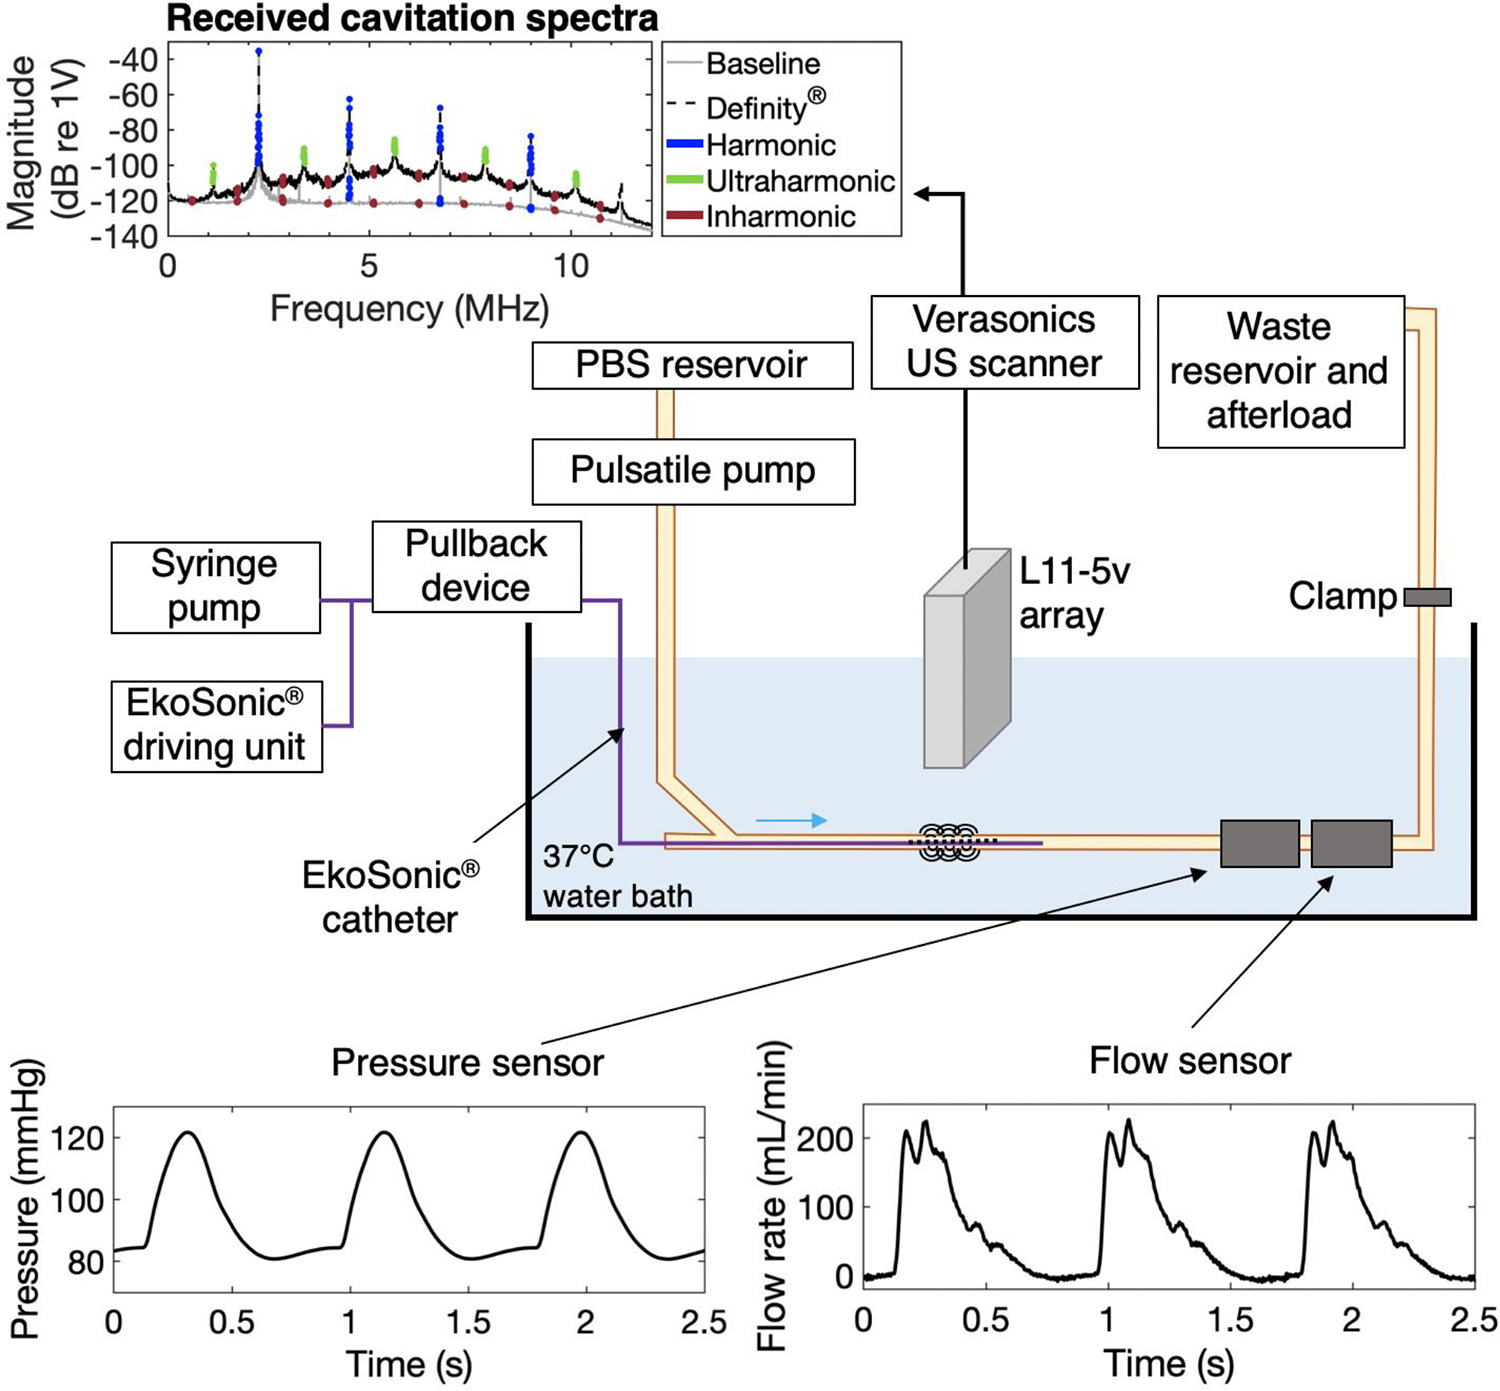
The EkoSonic endovascular system has been cleared by the U.S. Food and Drug Administration for the controlled and selective infusion of physician specified fluids, including thrombolytics, into the peripheral vasculature and the pulmonary arteries. The objective of this study was to explore whether this catheter technology could sustain cavitation nucleated by infused Definity, to support subsequent studies of ultrasound-mediated drug delivery to diseased arteries. The concentration and attenuation spectroscopy of Definity were assayed before and after infusion at 0.3, 2.0 and 4.0 mL/min through the EkoSonic catheter. PCI was used to map and quantify stable and inertial cavitation as a function of Definity concentration in a flow phantom mimicking the porcine femoral artery. The 2.0 mL/min infusion rate yielded the highest surviving Definity concentration and acoustic attenuation. Cavitation was sustained throughout each 15 ms ultrasound pulse, as well as throughout the 3 min infusion. These results demonstrate a potential pathway to use cavitation nucleation to promote drug delivery with the EkoSonic endovascular system.

Keywords: Catheter delivery of Definity; Cavitation nucleation; Drug delivery; Intravascular ultrasound; Theragnostic ultrasound.


Conflict of interest statement

Conflict of interest disclosure Boston Scientific provided the EkoSonic catheters and a driving unit. Curtis Genstler is an employee of Boston Scientific. Alexander S. Hannah is a former employee of Boston Scientific. The other authors have no conflicts of interest to disclose.

Figures

Figure 1:
Figure 1:
Schematic of the acoustic attenuation spectroscopy system. Definity® was infused via a syringe pump into an infusion reservoir, and transferred to the measurement reservoir at a concentration of 4.6×10⁶microbubbles/mL. The sample flowed from the measurement reservoir to the sample chamber by gravity. A pair of broadband polyvinylidene fluoride transducers was employed to transmit and receive a broadband pulse through the sample chamber. Attenuation data were acquired using an oscilloscope connected to computer. GPIB = general purpose interface bus.
Figure 2:
Figure 2:
Schematic of femoral artery flow phantom for cavitation activity measurement under physiological conditions. Phosphate-buffered saline (PBS) flowed through the latex tubing using a pulsatile pump. The pump parameters (rate and volume per pulse) as well as a clamp were adjusted to obtain physiologic pressure and flow waveforms measured with a pressure meter and a flow meter. The elevated waste and afterload reservoir permitted the adjustment of the hydrostatic pressure. The EkoSonic catheter was inserted in the tubing through a hemostasis valve, connected to a syringe pump for Definity® infusion and the EkoSonic driving unit, and connected to a pullback device. The L11–5v ultrasound imaging array was placed axially above the treatment area and connected to a Verasonics research scanner for passive cavitation signal acquisition. The example spectrum shows the frequency content of received signals averaged over all 128 elements of the array with and without presence of Definity®. Harmonic, ultraharmonic, and inharmonic frequency bands processed are indicated in blue, green, and red, respectively. Note that no ultraharmonics are highlighted in the spectrum without Definity® because the magnitude of the data did not exceed 3 dB above the average of the surrounding inharmonic bands.
Figure 3:
Figure 3:
Longitudinal and cross-sectional views of the EkoSonic catheter. The catheter consists of a central coolant lumen in which the US core is inserted, and 3 drug delivery lumens. Directivity pattern and peak rarefactional pressure field of the EkoSonic catheter (bold black line) generated from one pair of ultrasound core transducers in the 6-mm diameter femoral artery flow phantom tube (blue line). The thin black line and gray line denote the rarefactional acoustic pressure isolines for 0.2 MPa, and 1.0 MPa, which are the predicted rarefactional pressure thresholds for stable and inertial cavitation nucleated by Definity® at 2.25 MHz found by setting the cavitation index equal to 0.09 or 0.45, respectively (Bader and Holland 2013). Note however, that the inertial cavitation rarefactional pressure threshold measured for flowing Definity® exposed to 6.0 MHz pulsed Doppler was 0.42 MPa (Radhakrishnan et al. 2013). Robust inertial cavitation is thus expected at 1.0 MPa.
Figure 4.
Figure 4.
(A) Number-weighted and (B) volume-weighted size distributions of Definity® before and after infusion through the EkoSonic catheter at flow rates of 0.3, 2.0, or 4.0 mL/min. (C) Attenuation measurements of Definity® before and after infusion through the EkoSonic catheter at the same flow rates. Error bars represent the standard deviation of 3 measurements.
Figure 5:
Figure 5:
Effect of infused Definity® concentration on the (A) ultraharmonic and (B) inharmonic total cavitation energy, indicative of stable and inertial cavitation, respectively. Results are presented as the total energy in a single 14.4 ms pulse obtained in three experimental runs, calculated using Equation 9. Error bars are the standard deviation across seven pulses and three runs (n=21). The black lines are four-parameter sigmoid fits of the data, weighted by the inverse of the coefficient of variation. B-mode image inserts were acquired at the end of a 3 min infusion with infused Definity® concentrations of 4.6×10⁷and 9.2×10⁸ microbubbles/mL.
Figure 6:
Figure 6:
A. Ultraharmonic and inharmonic acoustic emissions within seven 15 ms pulses at a pulse repetition frequency of 10 Hz. The concentration of Definity® infused through the catheter was 4.6×10⁷microbubbles/mL. Data are represented as the mean ± standard deviation (n=7). Time points 0.6, 1.7, and 11.5 ms, are marked with gray dashed lines. The 0 ms time point corresponds to the start of the ultrasound pulse. B. Cross-sectional multiplex images of cavitation emissions obtained by passive cavitation imaging for processing windows starting at 0.6 (left column), 1.7 (middle column), and 11.5 (right column) ms; B-mode ultrasound in grayscale and passive cavitation image overlays: signal from the transducers (harmonics) in blue, stable cavitation (ultraharmonics) in green, and inertial cavitation (inharmonics) in red. The color maps represent values in dB relative to 1mJV2MPa2. The bottom row shows the merged inharmonic and ultraharmonic layers, highlighting the spatiotemporal dynamics of stable and inertial cavitation.
Figure 7:
Figure 7:
(A) Stable and (B) inertial cavitation activity measured throughout Definity® infusions at 2.0 mL/min through the EkoSonic catheter. The concentration of Definity® infused through the catheter was 4.6×10⁷microbubbles/mL. Cavitation activity measured in phosphate-buffered saline PBS only (noise) is plotted in a dashed black line. Data are represented in mean ± standard deviation (n=3). C. Passive cavitation images of the average stable (left) and inertial (right) energy acquired over the course of one 3 min infusion of Definity®.
Figure 8:
Figure 8:
A. Stable and inertial cavitation activity at a single axial image location in the flow phantom during a single 3 min infusion at 2.0 mL/min with a catheter pull-back rate of 0.5 mm/s. The concentration of Definity® infused through the catheter was 4.6×10⁷microbubbles/mL. Data time points were aligned in post-processing to set the first peak at 0 s to compensate for positioning variability between experimental runs (n=3). B. Composite passive cavitation images acquired at times points when the array was above the first (Tx1) and fourth (Tx4) pairs of transducers.

References

    1. Apfel RE. The Role of Impurities in Cavitation-Threshold Determination. J Acoust Soc Am Acoustical Society of America, 1970;48:1179–1186.
    1. Appis AW, Tracy MJ, Feinstein SB. Update on the safety and efficacy of commercial ultrasound contrast agents in cardiac applications. Echo Res Pract 2015;2:R55–R62. - PMC - PubMed
    1. Arvanitis CD, Bazan-Peregrino M, Rifai B, Seymour LW, Coussios CC. Cavitation-enhanced extravasation for drug delivery. Ultrasound Med Biol 2011;37:1838–1852. - PubMed
    1. Arvanitis CD, Clement GT, McDannold N. Transcranial Assessment and Visualization of Acoustic Cavitation: Modeling and Experimental Validation. IEEE Trans Med Imaging 2015;34:1270–1281. - PMC - PubMed
    1. Arvanitis CD, Livingstone MS, Vykhodtseva N, McDannold N. Controlled Ultrasound-Induced Blood-Brain Barrier Disruption Using Passive Acoustic Emissions Monitoring. PLoS ONE 2012;7:e45783. - PMC - PubMed

Publication types

LinkOut - more resources