. 2020 Dec 21;11(1):6425.
doi: 10.1038/s41467-020-20179-z.

Enriched conditioning expands the regenerative ability of sensory neurons after spinal cord injury via neuronal intrinsic redox signaling

Affiliations

Enriched conditioning expands the regenerative ability of sensory neurons after spinal cord injury via neuronal intrinsic redox signaling

Francesco De Virgiliis et al. Nat Commun. .

Abstract

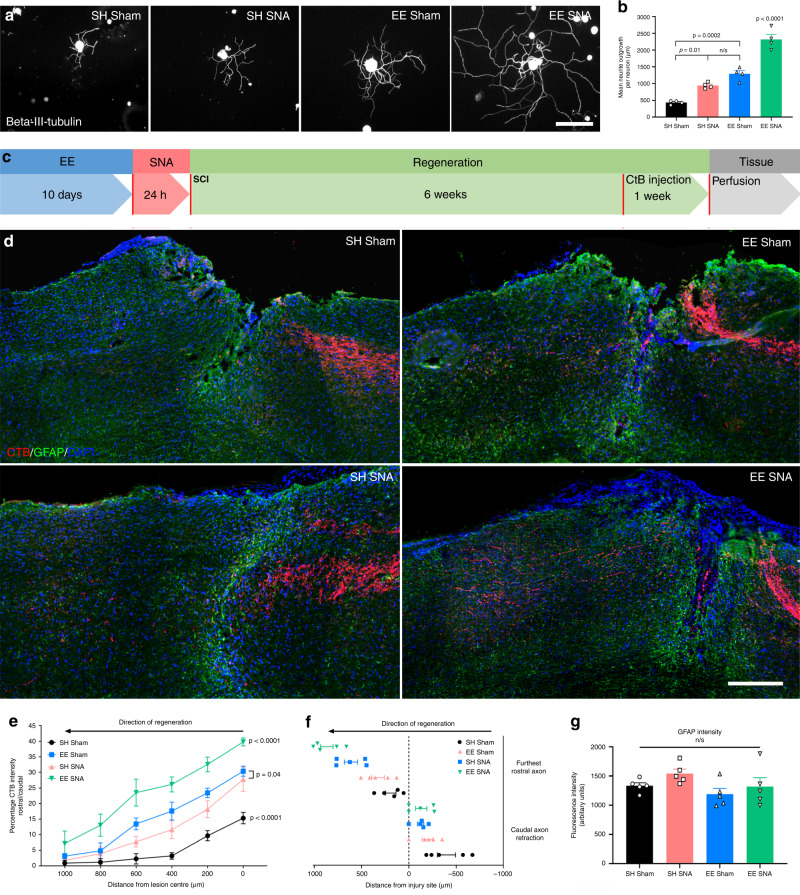
Overcoming the restricted axonal regenerative ability that limits functional repair following a central nervous system injury remains a challenge. Here we report a regenerative paradigm that we call enriched conditioning, which combines environmental enrichment (EE) followed by a conditioning sciatic nerve axotomy that precedes a spinal cord injury (SCI). Enriched conditioning significantly increases the regenerative ability of dorsal root ganglia (DRG) sensory neurons compared to EE or a conditioning injury alone, propelling axon growth well beyond the spinal injury site. Mechanistically, we established that enriched conditioning relies on the unique neuronal intrinsic signaling axis PKC-STAT3-NADPH oxidase 2 (NOX2), enhancing redox signaling as shown by redox proteomics in DRG. Finally, NOX2 conditional deletion or overexpression respectively blocked or phenocopied enriched conditioning-dependent axon regeneration after SCI leading to improved functional recovery. These studies provide a paradigm that drives the regenerative ability of sensory neurons offering a potential redox-dependent regenerative model for mechanistic and therapeutic discoveries.


Conflict of interest statement

The authors declare no competing interests.

Figures

Fig. 1
Fig. 1. Enriched conditioning (EE + SNA) induces a significant increase in DRG regenerative growth in vitro and axon regeneration in vivo after SCI.
a Representative images of cultured DRG neurons from SH sham, EE Sham, SH SNA, and EE + SNA stained for Beta-III-tubulin. Scale bar, 100 µm. b Quantification of average neurite outgrowth per neuron (mean ± SEM, one-way ANOVA, Tukey’s post hoc, n.s. = nonsignificant, n = 4 biologically independent animals/group, average of 20 cells/replicate). c Timeline for the in vivo experiment. d Representative images of CTB-traced (magenta) dorsal column sensory axons after injury, glial fibrillary acidic protein (GFAP) (green) and DAPI (blue). Scale bar, 200 µm. e Quantification of CTB-positive regenerating axons (mean ± SEM, Two-way repeated-measures ANOVA, Tukey’s post hoc, n = 5 biologically independent animals/group. Fluorescence intensity was measured in one series of tissue for each spinal cord). f Average distance between lesion center and furthest regenerating axon/caudal tract retraction (mean ± SEM, n = 5 biologically independent animals/group. Length of the furthest regenerating five axons and main tract retraction was measured in one series of tissue for each spinal cord). g Quantification of GFAP intensity around the lesion site (mean ± SEM, one-way ANOVA, n.s. = nonsignificant, n = 5 biologically independent animals/group). Fluorescence intensity was measured in one series of tissue for each spinal cord.
Fig. 2
Fig. 2. EE + SNA induces upregulation of signaling pathways and of NOX2 complex in DRG.
a Area proportional Venn diagram showing the number of differentially expressed (DE) genes and the extent of overlap among the three conditions SH SNA, EE Sham, and EE + SNA (each normalized to respective SH sham, P-value < 0.05, n = 3 independent biological experiments/condition). b Heatmap showing the Gene ontology analysis (molecular function, DAVID) of the DE genes modulated by SH SNA, EE Sham, and EE + SNA vs. SH Sham (modified Fisher’s exact P-value < 0.05). c Network visualization of protein–protein interaction of the NOX oxidases category with proteins belonging to signaling pathways specifically enriched upon EE + SNA. Each protein is organized in a circular layout accordingly to their shared molecular function. Nox2 subunits are organized in the center of the network. Each line (edge) represents a protein–protein interaction. d Heatmap showing mRNA expression analysis (fold change vs. SH Sham, P-value < 0.05) of the genes belonging to NOX2 complex. e Immunoblotting analysis of NOX2 complex components from DRG protein extracts after SH Sham, EE Sham, SH SNA, or EE + SNA. f Quantification of immunoblotting, glyceraldehyde phosphate dehydrogenase (GAPDH) was used as a loading control to which protein expression was normalized. (mean ± SEM, one-way ANOVA, Tukey’s post hoc, n = 3 biologically independent animals/group examined over three independent experiments).
Fig. 3
Fig. 3. NOX2 is required for EE + SNA-dependent increase in neurite outgrowth and axon regeneration after SCI.
a Representative images of cultured DRG from NOX2fl/fl mice previously transduced in vivo with AAV-GFP or AAV-Cre-GFP (green) and stained with Beta-III-tubulin (red) after SH Sham or EE + SNA. Scale bar, 100 µm. b Quantification of average neurite outgrowth per neuron (mean ± SEM, one-way ANOVA, Tukey’s post hoc, n.s. = nonsignificant, n = 4 biologically independent animals/group, average of 20 cells/replicate). c Timeline for the in vivo experiment. d Representative images of CTB-traced (red) dorsal column sensory axons after injury and DAPI (blue) to determine the lesion site (dashed line). Scale bar, 400 µm. e Quantification of CTB-positive regenerating axons (mean ± SEM, two-way repeated-measures ANOVA, Tukey’s post hoc, n.s. = nonsignificant, n = 5 biologically independent animals/group). Fluorescence intensity was measured in one series of tissue for each spinal cord.
Fig. 4
Fig. 4. NOX2 is required for EE + SNA-dependent increase in ROS production and redox signaling in DRG.
a Representative images of DRGs from WT or NOX2fl/fl mice after EE SNA or SH Sham, hydrocyanine–Cy3 (red) staining of ROS 1 day after SCI. Scale bar, 100 µm. b Quantification of hydrocyanine–Cy3 in DRG neurons (mean ± SEM, one-way ANOVA, Tukey’s post hoc, n = 3 biologically independent animals/group, examined over three independent experiments). Fluorescence intensity was measured in one series of tissue for each DRG. c Network visualization of the GO clustering analysis of the differentially oxidized proteins in EE + SNA (green) and SH Sham (red)-specific datasets run with ClueGO in Cytoscape (Bonferroni P-value < 0.05). Each node represents a GO-enriched term and the size of each node represents its enrichment significance. Edges represent interrelations between terms, defined by the Kscore. Red and green color intensity reflects proteins from a given dataset (red = Sham, green = EE + SNA, gray = common). Main functional groups are reported.
Fig. 5
Fig. 5. pSTAT3 is induced and occupies the promoters of NOX2 subunits following EE + SNA.
a In silico motif analysis run with Pscan of the NOX2 gene member’s promoters, showing the putative transcription factors regulating their transcription ranked by p-value. STAT3 binding motif; letters represent the relative enrichment for each gene at that position. b Immunoblotting of pSTAT3 from DRG extracts after SH Sham, EE Sham, SH SNA, or EE + SNA. c Quantification of immunoblotting, pSTAT3 was normalized to levels of STAT3, GAPDH was used as a loading control (mean ± SEM, one-way ANOVA, Tukey’s post hoc, n = 3 biologically independent animals/group examined over three independent experiments). d Quantitative RT-PCR analysis of NOX2 complex genes after chromatin immunoprecipitation (ChIP) for pSTAT3, expressed as fold change of DNA enrichment compared to IgG (mean ± SEM, two-tailed unpaired Student’s T-test, n = 4 independent biological replicates/group). e Quantitative RT-PCR analysis of NOX2 complex genes after ChIP for H3K27ac, expressed as fold change of DNA enrichment compared to IgG (mean ± SEM, two-tailed unpaired Student’s T-test, n.s. = nonsignificant, n = 3 independent biological replicates/group, examined over three independent experiments).
Fig. 6
Fig. 6. STAT3 deletion in DRG blocks EE + SNA-dependent axonal regeneration and NOX2 complex expression.
a Timeline for the in vivo experiment. b Representative images of WT (injected with control AAV-GFP) and STAT3 KO (injected with AAV-Cre-GFP) CTB-traced (red) dorsal column sensory axons after injury and DAPI (blue), to determine the lesion site (dashed line). Scale bar, 200 µm. c Quantification of fluorescence intensity of CTB-positive regenerating axons (mean ± SEM, two-way repeated-measures ANOVA, Tukey’s post hoc, ***P-value < 0.0001, n = 4 biologically independent animals/group). Fluorescence intensity was measured in one series of tissue for each spinal cord. d Representative images of cultured DRG neurons from SH Sham + vehicle (DMSO), SH Sham + PKC activator, EE + SNA + vehicle (DMSO), and EE + SNA + PKC inhibitor, stained with Beta-III-tubulin (red) and pSTAT3 (green). Scale bar, 100 µm. e Quantification of mean neurite outgrowth per neuron (mean ± SEM, one-way ANOVA, Tukey’s post hoc, n.s. = nonsignificant, n = 3 biologically independent animals/group, average of 20 cells/replicate). f Quantification of pSTAT3 fluorescence intensity (mean ± SEM, one-way ANOVA, Tukey’s post hoc, n = 3 biologically independent animals/group, average of 20 cells/replicate).
Fig. 7
Fig. 7. Overexpression of constitutively active p47phox (p47-3X) in DRG neurons induces axon regeneration and synaptic plasticity after SCI.
a Timeline for the in vivo experiment. b Representative images of GFP-positive sensory axons (green) after spinal cord injury and DAPI (blue) to determine the lesion site (dashed line). Scale bar, 200 µm. c Quantification of fluorescence intensity of GFP-positive regenerating axons (mean ± SEM, two-way repeated-measures ANOVA, Tukey’s post hoc, n = 9 biologically independent animals/group examined over two independent experiments). Fluorescence intensity was measured in one series of tissue for each spinal cord. d Average distance between lesion center and furthest regenerating axon/caudal tract retraction (mean ± SEM, n = 9 biologically independent animals/group examined over two independent experiments. Length of the furthest regenerating five axons and main tract retraction was measured in one series of tissue for each spinal cord). e Multi-fluorescent orthogonal 3D confocal images show colocalization between vGAT-positive boutons (green) and ChAT-positive motor neurons (red) below the injury (L1-4). Scale bar 25 μm, the orthogonal planes XY, XZ, and YZ are labeled. f Quantification of vGAT-positive boutons apposed to motoneurons (mean ± SEM, two-tailed unpaired Student’s t-test, n = 9 biologically independent animals/group, average of 20 motoneurons/replicate examined over two independent experiments). g Multi-fluorescent orthogonal 3D confocal images show juxtaposition between vGlut1-positive boutons (blue), GFP-positive axons (green), and ChAT-positive motoneurons (red) below the injury (L1-4), arrowheads indicate triple colocalization. Scale bar 25 μm, the orthogonal planes XY, XZ, and YZ are labeled. h Quantification of vGlut1-positive boutons apposed to motoneurons (whole bar), vGlut1 and GFP colocalization apposed to motoneurons (cross-hatched area) (mean ± SEM, two-tailed unpaired Student’s t-test, n = 9 biologically independent animals/group, average of 20 motoneurons/replicate examined over 2 independent experiments). i Quantification of the time required to first contact an adhesive pad placed on the hind paws (mean ± SEM, two-way repeated-measures ANOVA, Tukey’s post hoc, n = 9 biologically independent animals/group examined over two independent experiments). j Quantification of the time required to remove an adhesive pad placed on the hind paws (mean ± SEM, two-way repeated-measures ANOVA, Tukey’s post hoc, n = 9 biologically independent animals/group examined over two independent experiments).

Similar articles

Cited by

References

    1. Sofroniew MV. Dissecting spinal cord regeneration. Nature. 2018;557:343–350. doi: 10.1038/s41586-018-0068-4. - DOI - PubMed
    1. He Z, Jin Y. Intrinsic control of axon regeneration. Neuron. 2016;90:437–451. doi: 10.1016/j.neuron.2016.04.022. - DOI - PubMed
    1. Cho Y, Cavalli V. HDAC signaling in neuronal development and axon regeneration. Curr. Opin. Neurobiol. 2014;27:118–126. doi: 10.1016/j.conb.2014.03.008. - DOI - PMC - PubMed
    1. Ferreira LM, Floriddia EM, Quadrato G, Di Giovanni S. Neural regeneration: lessons from regenerating and non-regenerating systems. Mol. Neurobiol. 2012;46:227–241. doi: 10.1007/s12035-012-8290-9. - DOI - PubMed
    1. Kaplan A, Bueno M, Hua L, Fournier AE. Maximizing functional axon repair in the injured central nervous system: lessons from neuronal development. Dev. Dyn. 2018;247:18–23. doi: 10.1002/dvdy.24536. - DOI - PubMed

Publication types

MeSH terms