. 2020 Dec 21;10(1):22188.
doi: 10.1038/s41598-020-79083-7.

Low-flux scanning electron diffraction reveals substructures inside the ordered membrane domain

Affiliations

Low-flux scanning electron diffraction reveals substructures inside the ordered membrane domain

Masanao Kinoshita et al. Sci Rep. .

Abstract

Ordered/disordered phase separation occurring in bio-membranes has piqued researchers' interest because these ordered domains, called lipid rafts, regulate important biological functions. The structure of the ordered domain has been examined with artificial membranes, which undergo macroscopic ordered/disordered phase separation. However, owing to technical difficulties, the local structure inside ordered domains remains unknown. In this study, we employed electron diffraction to examine the packing structure of the lipid carbon chains in the ordered domain. First, we prepared dehydrated monolayer samples using a rapid-freezing and sublimation protocol, which attenuates the shrinkage of the chain-packing lattice in the dehydration process. Then, we optimised the electron flux to minimise beam damage to the monolayer sample. Finally, we developed low-flux scanning electron diffraction and assessed the chain packing structure inside the ordered domain formed in a distearoylphosphatidylcholine/dioleoylphosphatidylcholine binary monolayer. Consequently, we discovered that the ordered domain contains multiple subdomains with different crystallographic axes. Moreover, the size of the subdomain is larger in the domain centre than that near the phase boundary. To our knowledge, this is the first study to reveal the chain packing structures inside an ordered domain.


Conflict of interest statement

The authors declare no competing interests.

Figures

Figure 1
Figure 1
FRET-quenching intensity of the donor in wet and dehydrated DOPC monolayers. The samples contain 0.2 mol% Bodipy-PC and 0.4 mol% Texas Red labelled DPPE (Texas Red-DPPE) as FRET donor and acceptor, respectively. Bars show the donor intensity Idonor of (a) a wet sample, (b) a sample dehydrated by the RFS method and (c) a sample dehydrated at the atmospheric pressure and room temperature. For easy comparison, the Idonor-values of the dehydrated samples were normalised to that of the wet sample. Error bars indicate the standard errors.
Figure 2
Figure 2
ED patterns from the DSPC monolayer at different electron fluxes; (a) 0.9 e/nm2·s, (b) 2.3 e/nm2·s, (c) 4.7 e/nm2·s, (d) 15.9 e/nm2·s, and (e) 30.0 e/nm2·s. The DSPC monolayer was formed on a collodion-coated grid for transmission electron microscopic observation (TEM-grid). The selected area was 7.9 μm2, corresponding to 1 μm in diameter, and the exposure time was five s. Arrowheads indicate diffraction peaks corresponding to the carbon-chain packing. To improve the visibility, we have shown the black/white-inverse images.
Figure 3
Figure 3
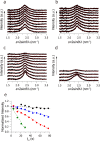
Kinetics of structural decay upon continuous irradiation with an electron beam. One-dimensional ED patterns at the electron flux of (a) 0.9 e/nm2·s, (b) 2.3 e/nm2·s, (c) 4.7 e/nm2·s, and (d) 15.9 e/nm2·s are shown. The data were obtained in the same region under continuous irradiation with the electron beam. The irradiation times tirr were 5 s, 13 s, 21 s, 29 s, 37 s, 45 s, 53 s, 61 s, 69 s, and 77 s from the bottom to top profiles. Each profile is fitted to a Lorentz function, and the fitting result is shown by a red profile. The selected area is 0.79 μm2, which corresponds to 1 μm in diameter. (e) Peak heights are plotted as a function of tirr under the electron flux of 0.9 e/nm2·s (black), 2.3 e/nm2·s (blue), 4.7 e/nm2·s (red), and 15.9 e/nm2·s (green). The dashed lines indicate linear fitting in the region tirr < 77 s for 0.9 e/nm2·s − 4.7 e/nm2·s and tirr < 29 s for 15.9 e/nm2·s.
Figure 4
Figure 4
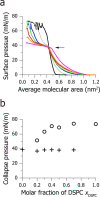
Composition-dependent phase behaviour of DSPC/DOPC binary monolayers. (a) πA isotherms of DSPC/DOPC binary monolayers at different mole fractions of DSPC (xDSPC). xDSPC = 0 (pink), 0.2 (orange), 0.3 (red), 0.4 (green), 0.5 (blue), 0.7 (grey), and 1.0 (black). An arrow indicated the collapse pressure of the disordered domains. (b) Collapse pressure vs. composition plot. The circles and crosses show the collapse pressure of the ordered and disordered domains, respectively.
Figure 5
Figure 5
Selective acquisition of ED patterns from the ordered and disordered domains. (a) A fluorescent micrograph of the DSPC/DOPC (xDSPC = 0.3) monolayer formed on a collodion-coated TEM-grid. Since sample contain 0.2 mol% Texas Red-DPPE, a disordered domain marker, the (*) darker and (**) brighter regions correspond to the ordered and disordered domains, respectively. (b) and (c) show ED patterns obtained in the ordered and disordered domains, respectively. Arrows indicate the hexagonal spot obtained in the ordered domain. The selected area is 0.79 μm2, corresponding to a diameter of 1 μm. An exposure time of five seconds was used. (d) and (e) show the one-dimensional ED profiles of (b) and (c), respectively. Although we subtracted the background using a monolayer-free TEM-grid (see “Materials and methods” for details), the diffraction peak from the collodion film could not be completely removed in the panel (e). This is because the thickness of the collodion film is not homogeneous on the TEM-grid. Thus, we deconvoluted those peaks using the two Lorentz functions; the red and blue profiles show the diffraction peaks corresponding to the carbon chains and the collodion film, respectively.
Figure 6
Figure 6
Local structure inside an ordered domain. (a) A fluorescent micrograph of the DSPC/DOPC (xDSPC = 0.3) monolayer formed on a collodion-coated TEM grid. The darker and brighter regions correspond to the DSPC-rich ordered and DOPC-rich disordered domains, respectively. (b) Magnification of the area, which is indicated by the dashed square in (a). Bars indicate 30 μm. (c) The ED patterns obtained at regions 1–7, as indicated in (b). The selected area is 6.2 μm2, corresponding to 2.8 μm in diameter. The corresponding region numbers were directly indicated in the panels. (d) We plotted the intensity of the hexagonal spots appearing along the azimuthal direction θ, which is shown in panel (c). The corresponding region numbers are directly indicated in the panel. The difference in the azimuthal angle of the hexagonal spots between the centre (regions 4 and 5) and annular (regions 3 and 6) regions in the ordered domain are indicated by a dashed line and arrowheads, respectively. Schematic illustrations of the directions of the chain packing lattice in regions 3–6 are also shown in (d).
Figure 7
Figure 7
A schematic illustration of the distribution of the subdomains inside a single ordered domain. Blue and green lipids correspond to DSPC and DOPC, respectively.

Similar articles

Cited by

References

    1. Lingwood D, Simons K. Lipid rafts as a membrane-organizing principle. Science. 2010;327:46–50. doi: 10.1126/science.1174621. - DOI - PubMed
    1. Suzuki KGN, et al. Transient GPI-anchored protein homodimers are units for raft organization and function. Nat. Chem. Biol. 2012;8:774–783. doi: 10.1038/nchembio.1028. - DOI - PubMed
    1. Nicolson GL. The fluid-mosaic model of membrane structure: Still relevant to understanding the structure, function and dynamics of biological membranes after more than 40 years. Biochim. Biophys. Acta Biomembr. 2014;1838:1451–1466. doi: 10.1016/j.bbamem.2013.10.019. - DOI - PubMed
    1. Kusumi A, et al. Defining raft domains in the plasma membrane. Traffic. 2020;21:106–137. doi: 10.1111/tra.12718. - DOI - PubMed
    1. Kinoshita M, Matsumori N, Murata M. Coexistence of two liquid crystalline phases in dihydrosphingomyelin and dioleoylphosphatidylcholine binary mixtures. Biochim. Biophys. Acta Biomembr. 2014;1838:1372–1381. doi: 10.1016/j.bbamem.2014.01.017. - DOI - PubMed

Publication types