. 2021 Mar;6(3):327-338.
doi: 10.1038/s41564-020-00836-1. Epub 2020 Dec 21.

Stepwise evolution of Salmonella Typhimurium ST313 causing bloodstream infection in Africa

Affiliations

Stepwise evolution of Salmonella Typhimurium ST313 causing bloodstream infection in Africa

Caisey V Pulford et al. Nat Microbiol. 2021 Mar.

Abstract

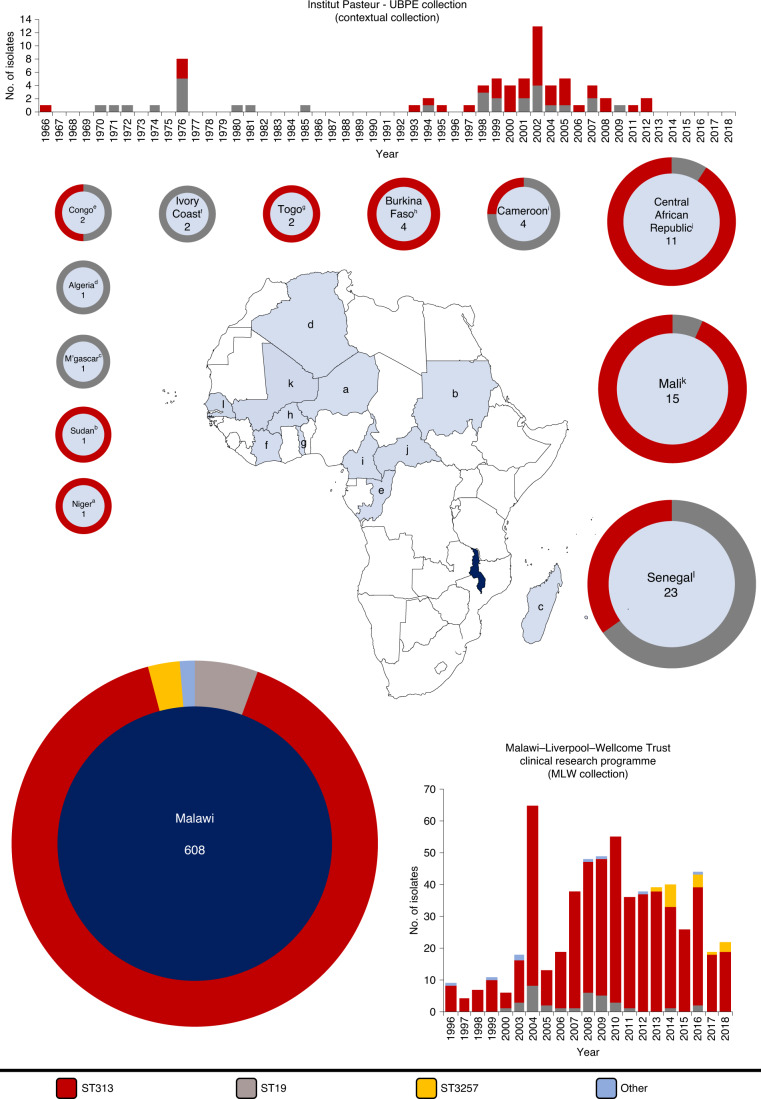
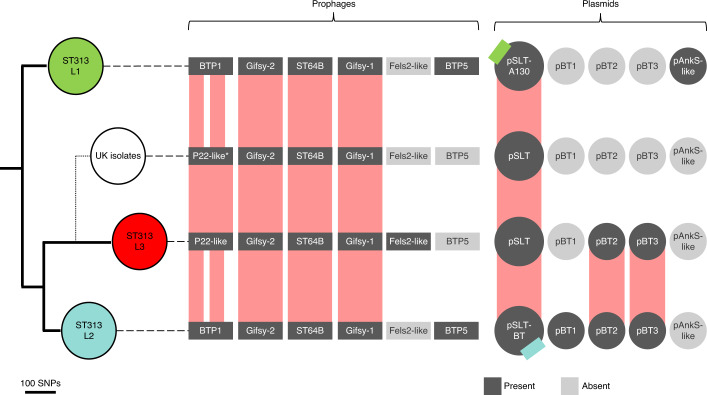
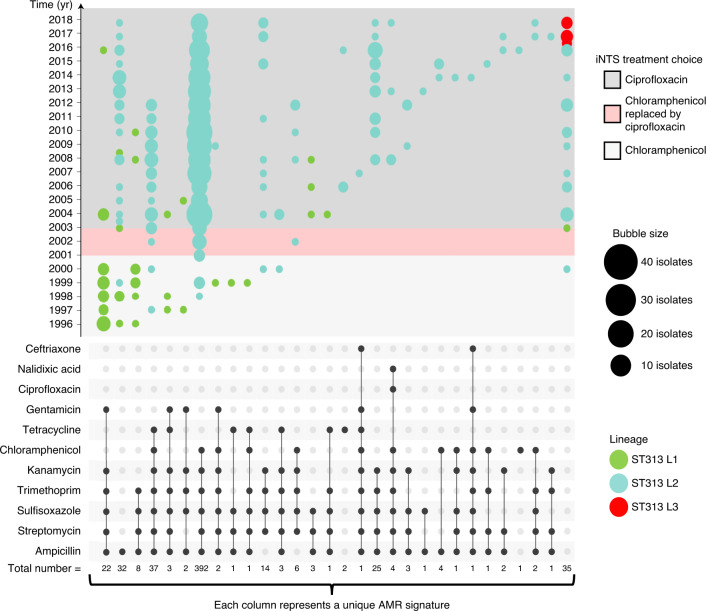
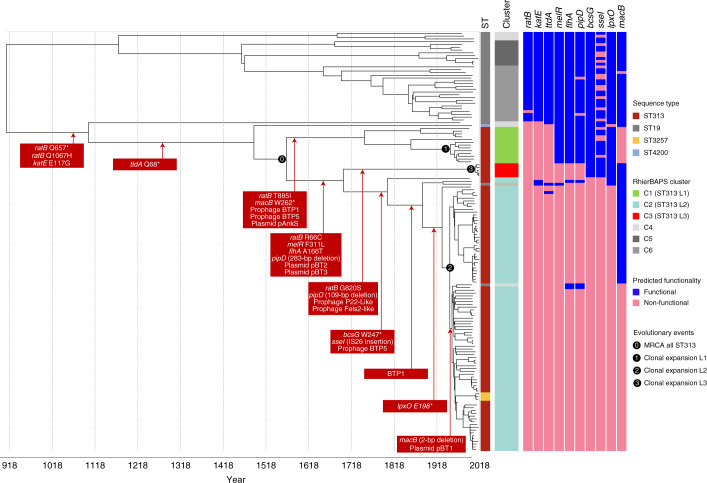
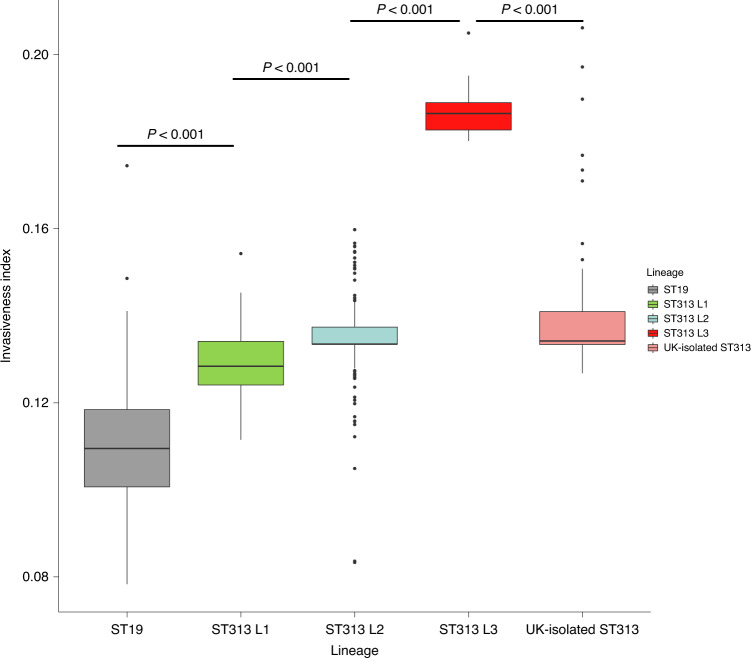
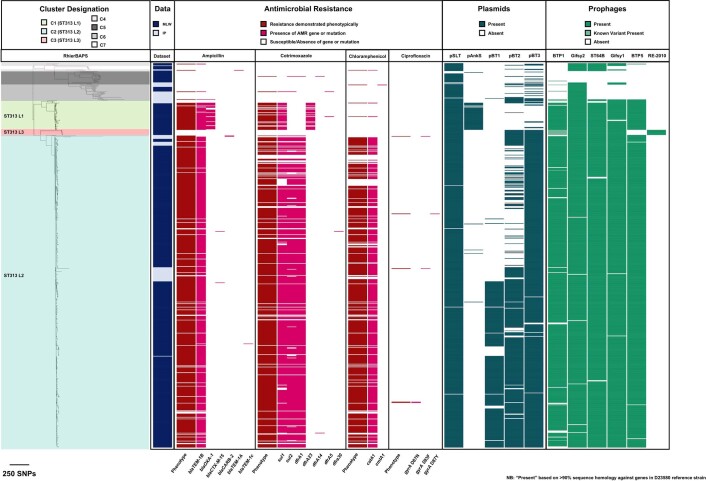
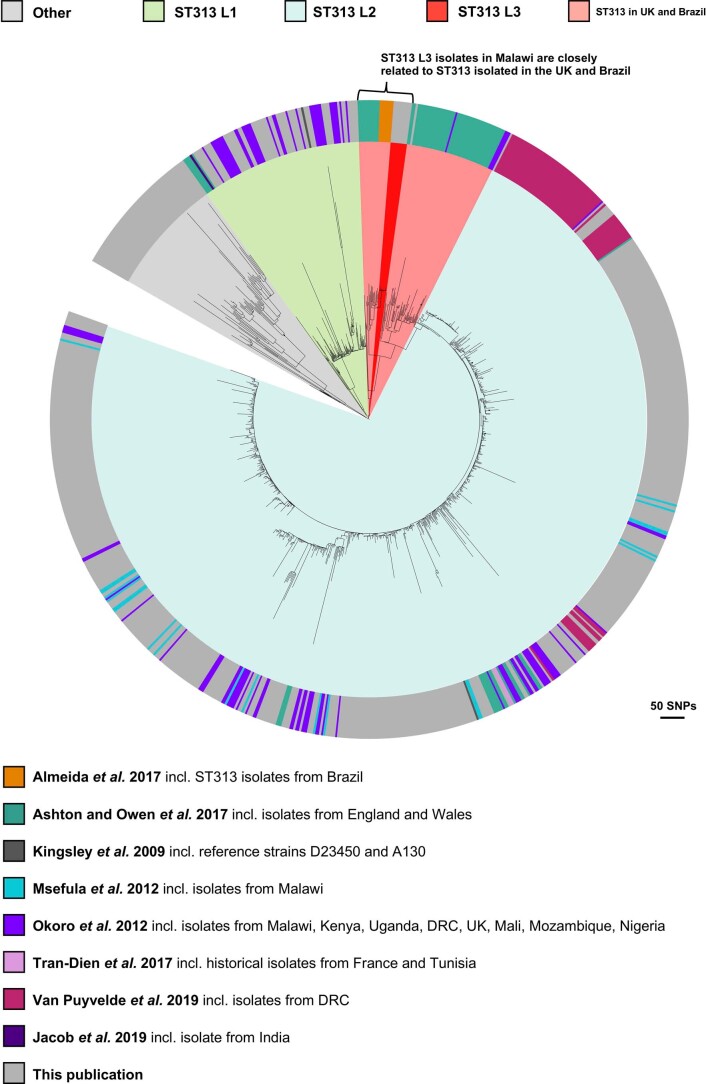
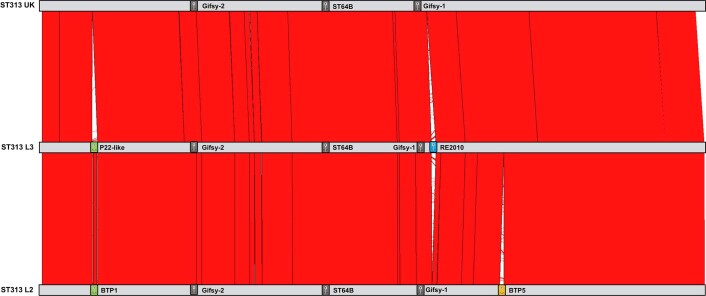
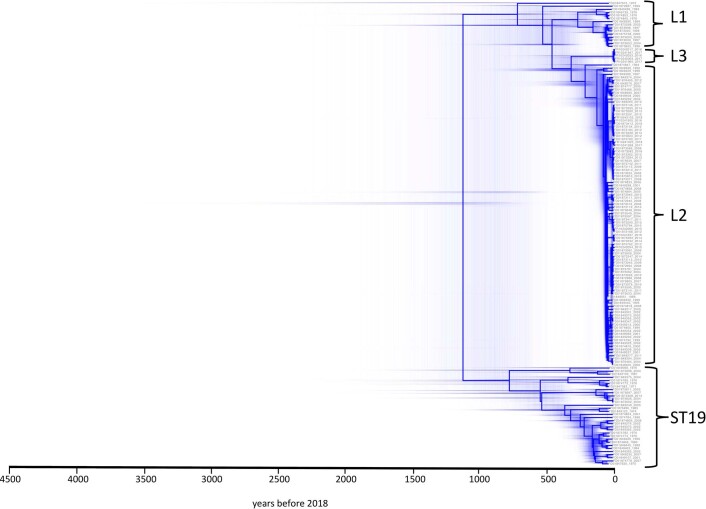
Bloodstream infections caused by nontyphoidal Salmonella are a major public health concern in Africa, causing ~49,600 deaths every year. The most common Salmonella enterica pathovariant associated with invasive nontyphoidal Salmonella disease is Salmonella Typhimurium sequence type (ST)313. It has been proposed that antimicrobial resistance and genome degradation has contributed to the success of ST313 lineages in Africa, but the evolutionary trajectory of such changes was unclear. Here, to define the evolutionary dynamics of ST313, we sub-sampled from two comprehensive collections of Salmonella isolates from African patients with bloodstream infections, spanning 1966 to 2018. The resulting 680 genome sequences led to the discovery of a pan-susceptible ST313 lineage (ST313 L3), which emerged in Malawi in 2016 and is closely related to ST313 variants that cause gastrointestinal disease in the United Kingdom and Brazil. Genomic analysis revealed degradation events in important virulence genes in ST313 L3, which had not occurred in other ST313 lineages. Despite arising only recently in the clinic, ST313 L3 is a phylogenetic intermediate between ST313 L1 and L2, with a characteristic accessory genome. Our in-depth genotypic and phenotypic characterization identifies the crucial loss-of-function genetic events that occurred during the stepwise evolution of invasive S. Typhimurium across Africa.


Conflict of interest statement

R.C. was employed by the University of Liverpool at the time of the study and is now an employee of the GSK group of companies. The remaining authors declare no competing interests.

Figures

Fig. 1
Fig. 1. Bloodstream isolates of Salmonella Typhimurium used in this study.
Isolates were collected from either the Unité des Bactéries Pathogènes Entériques of the Institut Pasteur Centres (n = 72, light blue) or the MLW Clinical Research Center (n = 608, dark blue). Bar graphs show the number of isolates of different sequence types collected by centre per year. Donut charts indicate the proportion of sequence types collected per country and show the total number of isolates from each location in the centre. Note that only isolates from African countries (M’gascar, Madagascar; Congo, Republic of the Congo) are shown in donut plots. Letters in superscript relate to the location on the map. The colour code is shown at the bottom of the figure.
Fig. 2
Fig. 2. The four major ST313 clusters have different prophage and plasmid repertoires.
Maximum-likelihood phylogeny demonstrating the population structure of ST313 L1, L2 and L3. Approximate location of UK lineages is indicated schematically (Extended Data Fig. 2) due to the diversity of isolates. Prophage and plasmid repertoire of the reference strain for each lineage are shown (dark grey indicates presence; light grey represents absence). Reference isolates used were A130 (ST313 L1), D23580 (ST313 L2), BKQZM9 (ST313 L3) and U2 (UK strains). Red blocks represent the extent of conservation between lineage reference genomes, with white gaps indicating missing regions. Coloured squares on the pSLT plasmid represents different AMR cassettes. *P22-like prophage is absent in UK reference (U2), but present in some UK strains.
Fig. 3
Fig. 3. Temporal AMR trends in S. Typhimurium lineages (1996–2018).
The combination matrix (bottom) depicts predicted AMR patterns of S. Typhimurium. Isolates collected before 1996 were sampled only sporadically, and thus were excluded from analysis. Within the combination matrix, dark grey circles indicate genome-predicted resistance and the vertical combination of grey circles represents the resistance profile. Total number of isolates with each resistance profile is indicated below the matrix. The combination matrix was created using the UpSetR package. The bubble plot (top) depicts the relative number of isolates (bubble size) with each resistance profile (combination matrix) per year (y axis). Lineage assignments are shown using bubble colour to identify lineage-specific AMR trends. Local Malawi antimicrobial usage policy is highlighted in background colours overlaid on the timeline in the bubble plot. The bubble plot was created using R ggplot2.
Fig. 4
Fig. 4. Stepwise evolution of S. Typhimurium responsible for BSI in Africa.
Chronograph of 150 S. Typhimurium strains isolated from the bloodstream of human patients with iNTS disease. The choice of the 150 isolates from both the Malawian and contextual datasets is described in Methods. The figure shows a maximum clade credibility tree. Adjacent colour strips are as follows (from left to right); ST, lineage assignment (rHierBAPs) with the three major ST313 lineages highlighted in colour. Predicted functionality (Methods) is depicted as a colour strip for each gene and is based on whole-genome-based predictions of SNPs likely to play a functional role. Genome-degradation events that generate functionally relevant pseudogenes are displayed in red boxes overlying the chronograph. An asterisk represents a premature stop codon. The numbers in black circles indicate four key evolutionary events. Figure visualized using iTOL.
Fig. 5
Fig. 5. Invasiveness index of ST19 and ST313 lineages.
Box plot representing the distribution of invasiveness index values for all genome sequences included in this study summarized by lineage assignment. UK-isolated ST313 refers to those described in ref. . Groups were compared using a two-sided Wilcoxon–Mann–Whitney test and the resultant P-values were all less than 0.001. Number of isolates in each group: ST19 (n = 66), ST313 L1 (n = 52), ST313 L2 (n = 550), ST313 L3 (n = 9) and UK-isolated ST313 (n = 59). In the box plot, centre lines represent median values, box limits represent upper and lower quartiles, whiskers represent 1.5× the interquartile range and individual points represent outliers. The box plot was created using R ggplot2.
Extended Data Fig. 1
Extended Data Fig. 1. Dataset maximum likelihood core genome SNP phylogeny.
Maximum likelihood phylogeny based on the core genome SNP alignment of strains used in this study. Background shading on phylogeny represents cluster designation (rHierBAPs) and additional metadata is represented as adjacent colour strips. Note that Malawi-Liverpool Wellcome Clinical Research Center is abbreviated to MLW and Institute Pasteur Unité des Bactéries Pathogènes Entériques Contextual Collection is abbreviated to IP. Figure visualised using iTOL.
Extended Data Fig. 2
Extended Data Fig. 2. Contextual maximum likelihood core gene SNP phylogeny.
Maximum likelihood phylogeny based on the core gene SNP alignment of strains in this study in the context of published ST313 genomes–,,,,. Background shading on phylogeny represents cluster designation (rHierBAPs). Outer ring provides details on the original publication. Grey represents this publication. Figure visualised using iTOL.
Extended Data Fig. 3
Extended Data Fig. 3. Chromosomal comparison of ST313 lineages.
Comparison of the complete genome sequences of ST313 lineage representatives generated using the Artemis Comparison Tool. Reference isolates used; D23580 (ST313 L2), BKQZM9 (ST313 L3) and U2 (UK strains). The number of genes shared between D23580 and BKQZM9 was 4,529. An additional 167 genes were BKQZM9-specific, whereas 309 genes were exclusive to D23580, largely explained by differences in the prophage and plasmid repertoire of the two strains. Red represents sequence similarity and white represents regions absent. Prophage positions are represented as coloured boxes.
Extended Data Fig. 4
Extended Data Fig. 4. Prophage BTP1 comparisons.
Comparison of P22-like prophage regions identified in ST313 lineages generated using the Artemis Comparison Tool. Red represents sequence similarity and white represents regions absent. (a) shows the comparison between P22-like prophage in ST313 L3 (strain BKQZM9) and ST313 L2 (strain D23580). Prophage annotation is adapted from that shown in Owen et al., 2017, with different colours highlighting different prophage regions. (b) shows the comparison between P22-like prophage in ST313 L3 (strain BKQZM9) and a P22-like prophage in ST313 sampled in the UK.
Extended Data Fig. 5
Extended Data Fig. 5. Examples of variation within the Tn21-like element.
Annotation of the resistance cassette carried on the Tn21-like element integrated into the Salmonella virulence plasmid pSLT-BT. Examples of variation in the Tn21-like element is shown for three different resistance profiles in ST313 L2, Grey boxes between annotations represents gene presence. Annotation is adapted from Kingsley et al., 2009, and shows antibiotic resistance genes (red), integrase or transposase (blue), pseudogenes (green) and other genes (grey).
Extended Data Fig. 6
Extended Data Fig. 6. pSLT comparison of D23580 vs BKQZM9.
Comparison of the Salmonella virulence plasmid pSLT identified in ST313 L3 (BKQZM9) and ST313 L2 (D23580) generated using the Artemis Comparison Tool. Red represents sequence similarity and white represents absent regions. The location of the Tn21-like element is indicated.
Extended Data Fig. 7
Extended Data Fig. 7. Phylogenetic reconstruction of pSLT plasmid.
Maximum likelihood phylogenetic tree showing the population structure of the pSLT plasmid in ST19 and ST313 lineages. Colour strip from right to left; cluster assignment of each isolate and number of antimicrobials each isolate is resistant to. The likely point of insertion of the Tn21-like element is indicated for ST313 L1 strains (green arrow) and ST313 L2 strains (blue arrow).
Extended Data Fig. 8
Extended Data Fig. 8. Distribution of possible hierarchies generated in BEAST analysis.
Chronograph of 150S. Typhimurium strains isolated from bloodstream of human iNTS disease patients. The figure displays the distribution of possible hierarchies and highlights uncertainty in the timeline. Figure was visualized using DensiTree.

Comment in

Similar articles

Cited by

References

    1. Stanaway JD, et al. The global burden of non-typhoidal salmonella invasive disease: a systematic analysis for the Global Burden of Disease Study 2017. Lancet Infect. Dis. 2019;19:1312–1324. - PMC - PubMed
    1. Feasey NA, Dougan G, Kingsley RA, Heyderman RS, Gordon MA. Invasive non-typhoidal salmonella disease: an emerging and neglected tropical disease in Africa. Lancet. 2012;379:2489–2499. - PMC - PubMed
    1. Marchello CS, Dale AP, Pisharody S, Rubach MP, Crump JA. A systematic review and meta-analysis of the prevalence of community-onset bloodstream infections among hospitalized patients in Africa and Asia. Antimicrob. Agents Chemother. 2019;64:e01974–19. - PMC - PubMed
    1. Reddy EA, Shaw AV, Crump JA. Community-acquired bloodstream infections in Africa: a systematic review and meta-analysis. Lancet Infect. Dis. 2010;10:417–432. - PMC - PubMed
    1. Kingsley RA, et al. Epidemic multiple drug resistant Salmonella Typhimurium causing invasive disease in sub-Saharan Africa have a distinct genotype. Genome Res. 2009;19:2279–2287. - PMC - PubMed

Publication types

MeSH terms