Multicenter Study
. 2021 Sep;39(9):1103-1114.
doi: 10.1038/s41587-020-00748-9. Epub 2020 Dec 21.

A multicenter study benchmarking single-cell RNA sequencing technologies using reference samples

Affiliations
Multicenter Study

A multicenter study benchmarking single-cell RNA sequencing technologies using reference samples

Wanqiu Chen et al. Nat Biotechnol. 2021 Sep.

Abstract

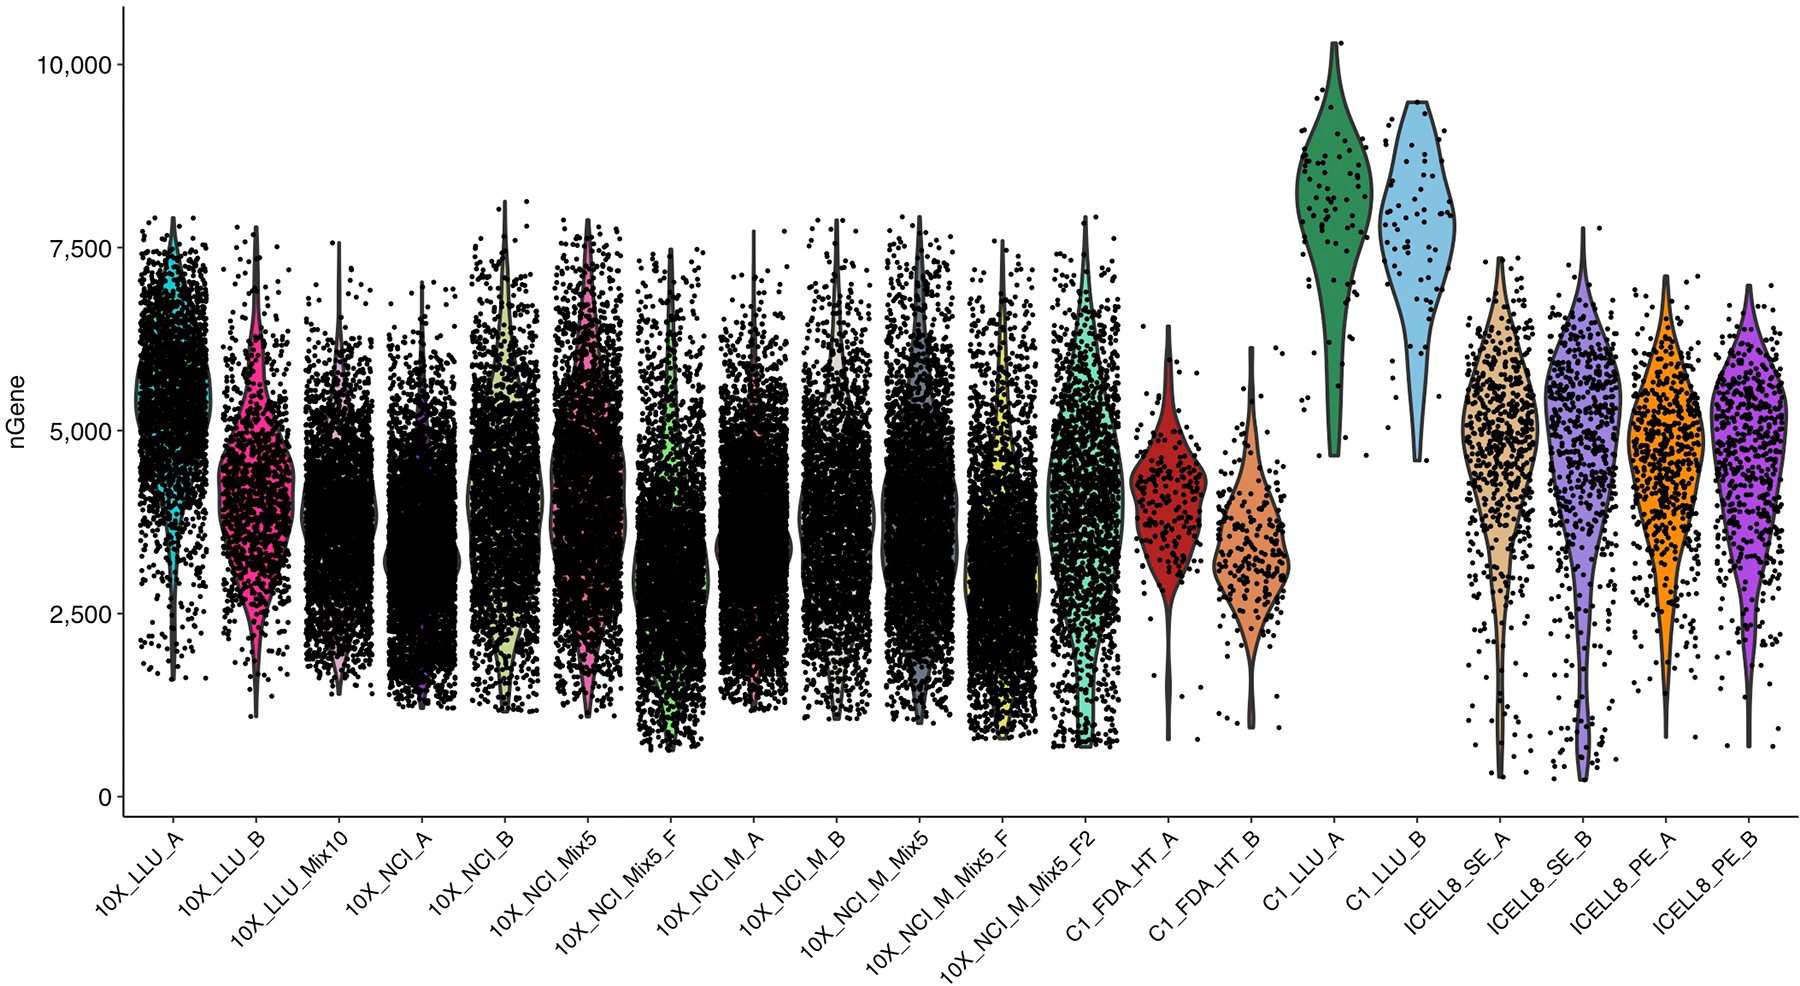
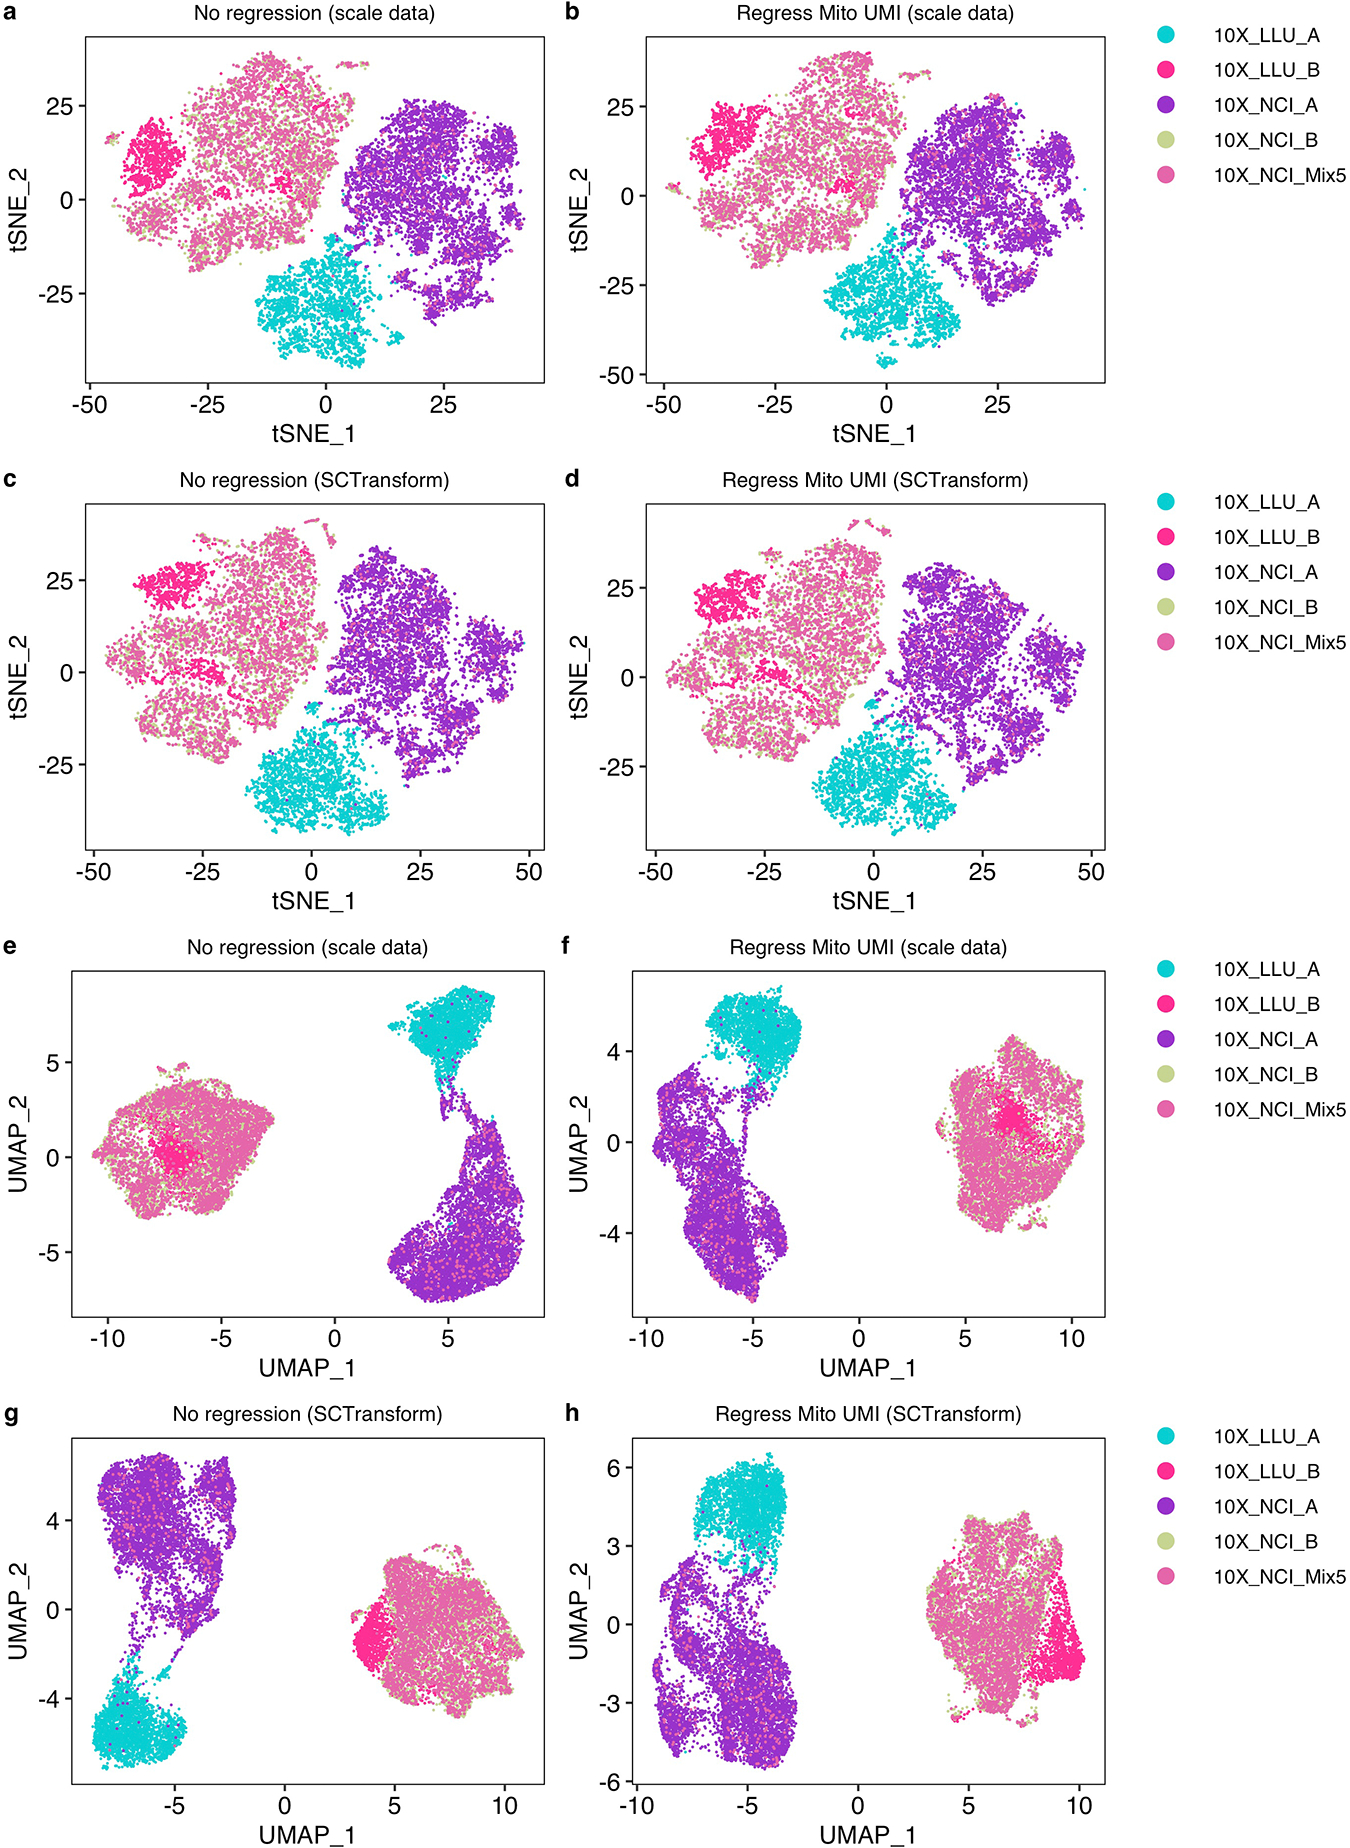
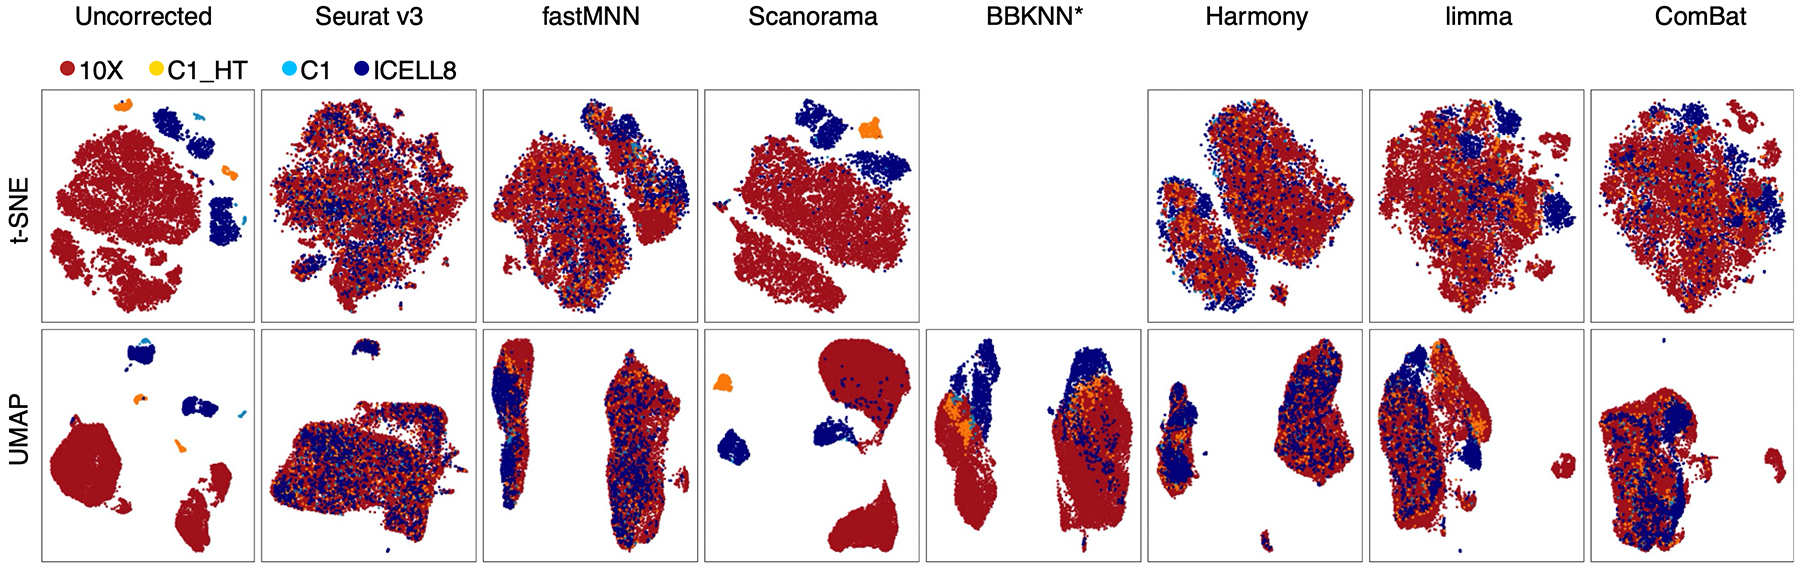
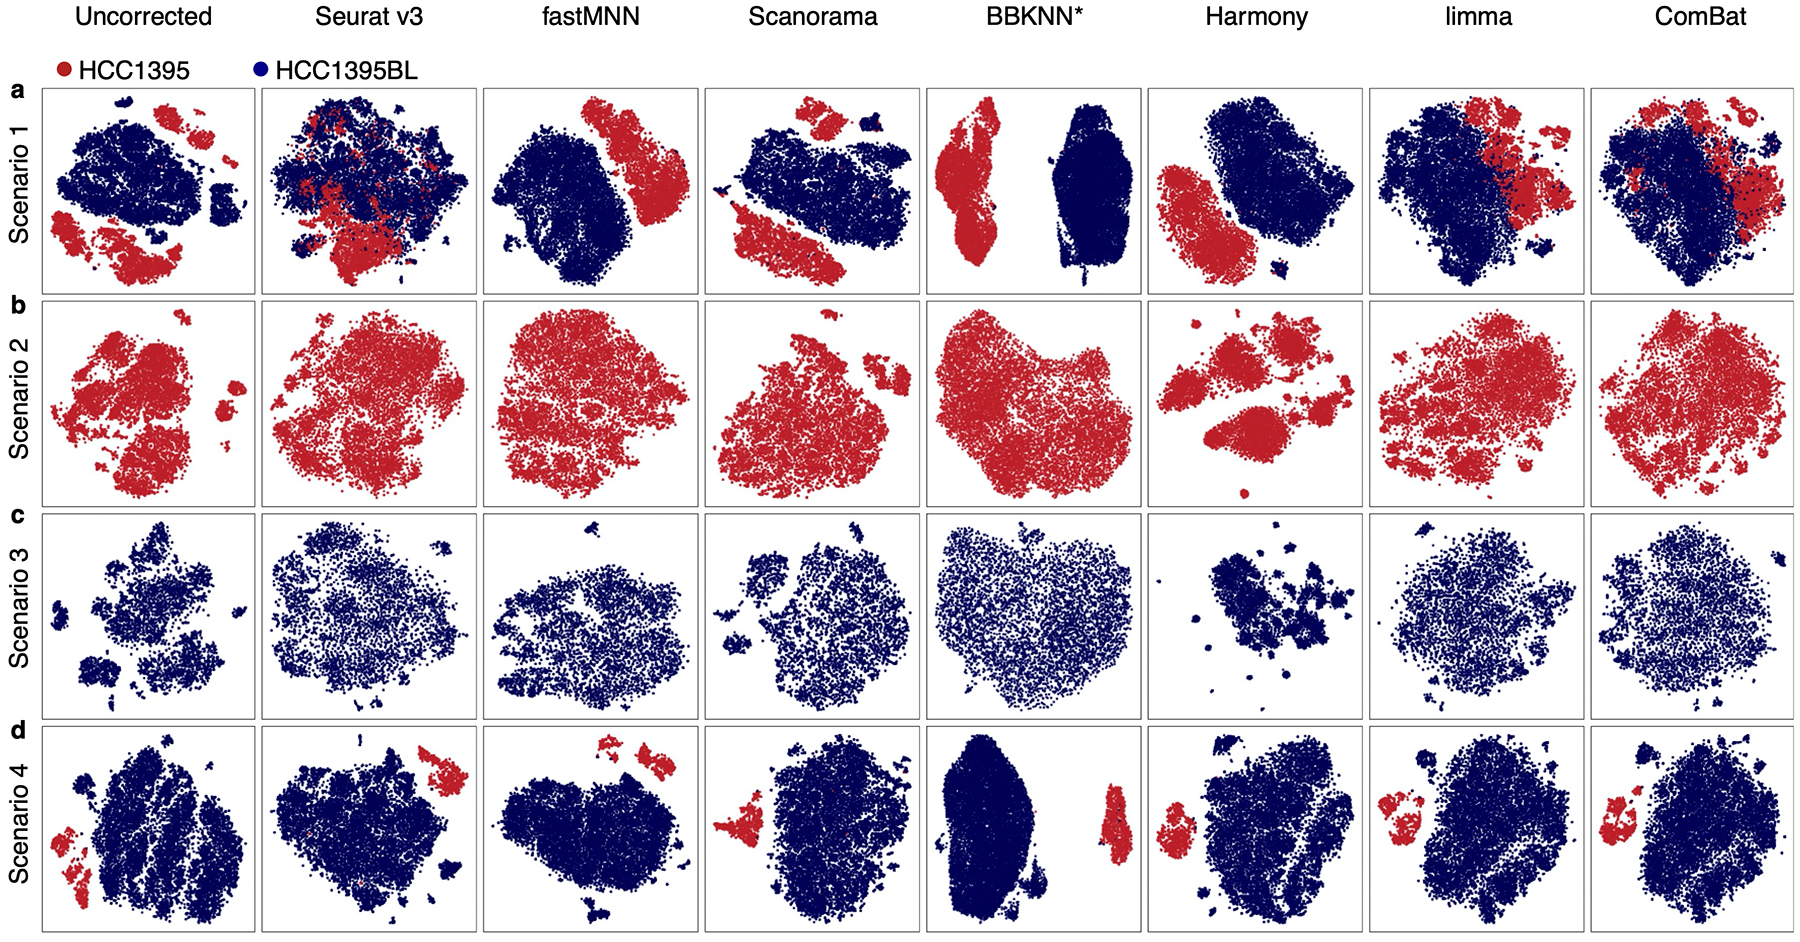
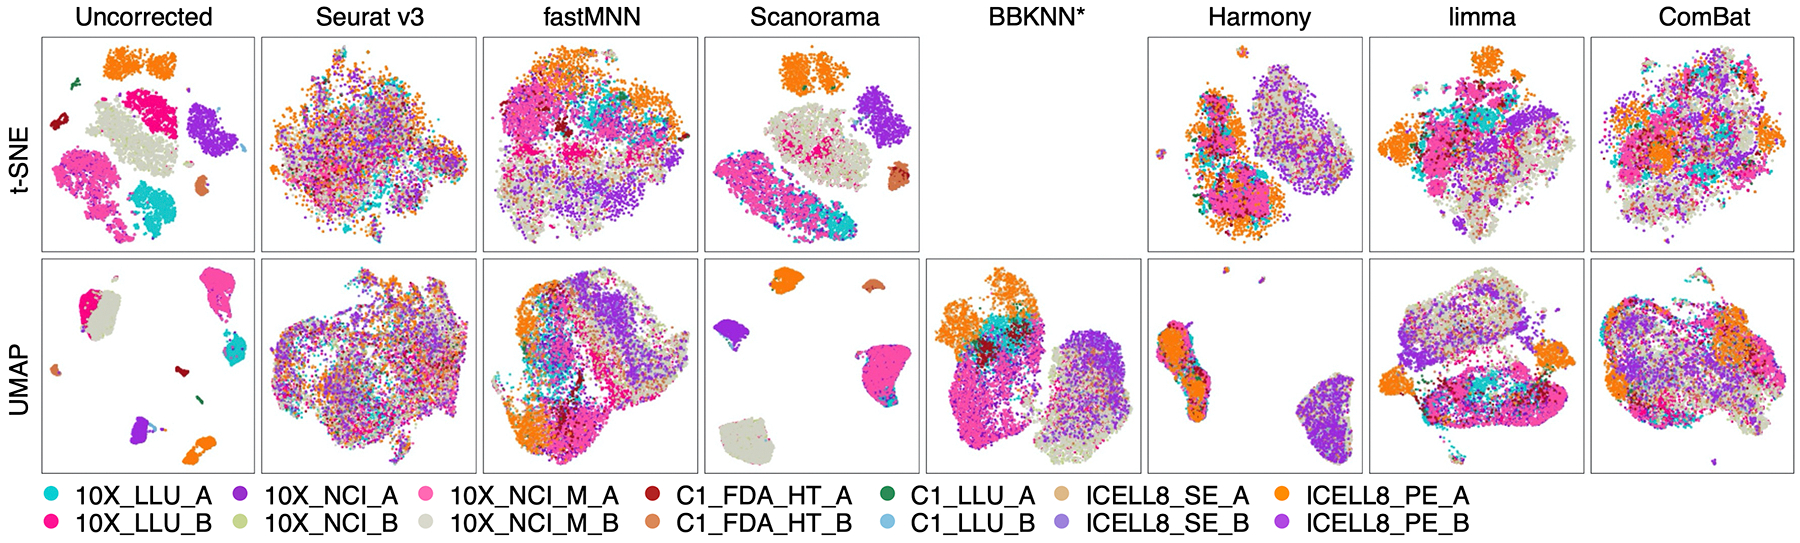
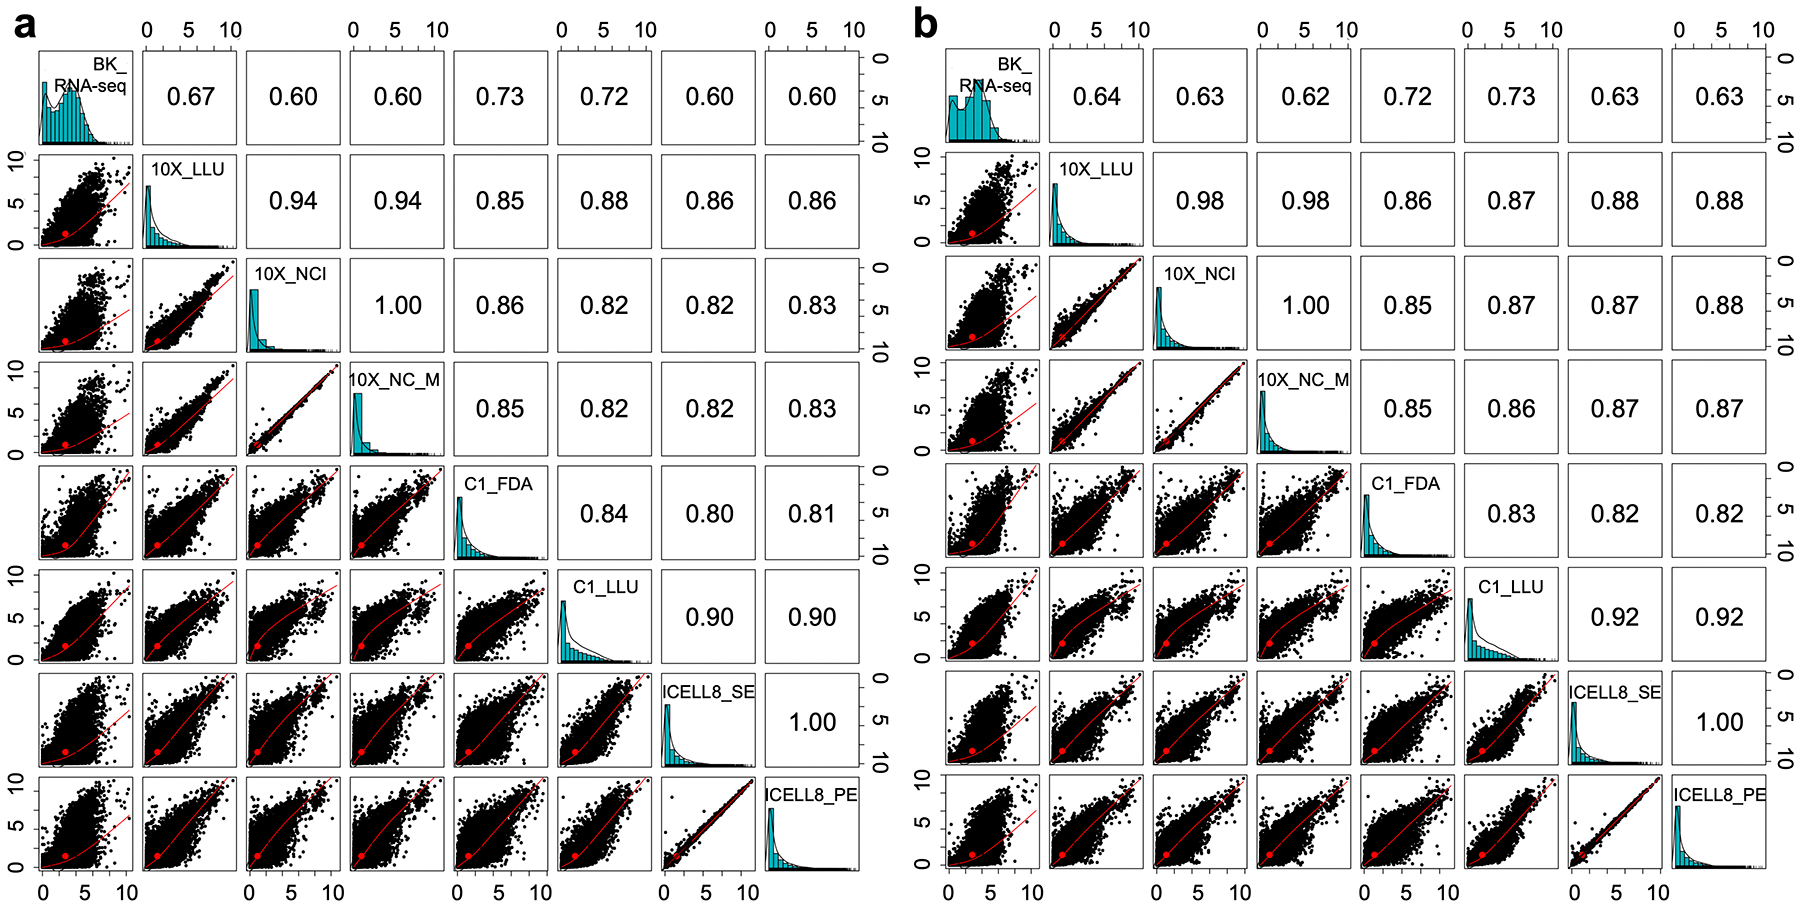
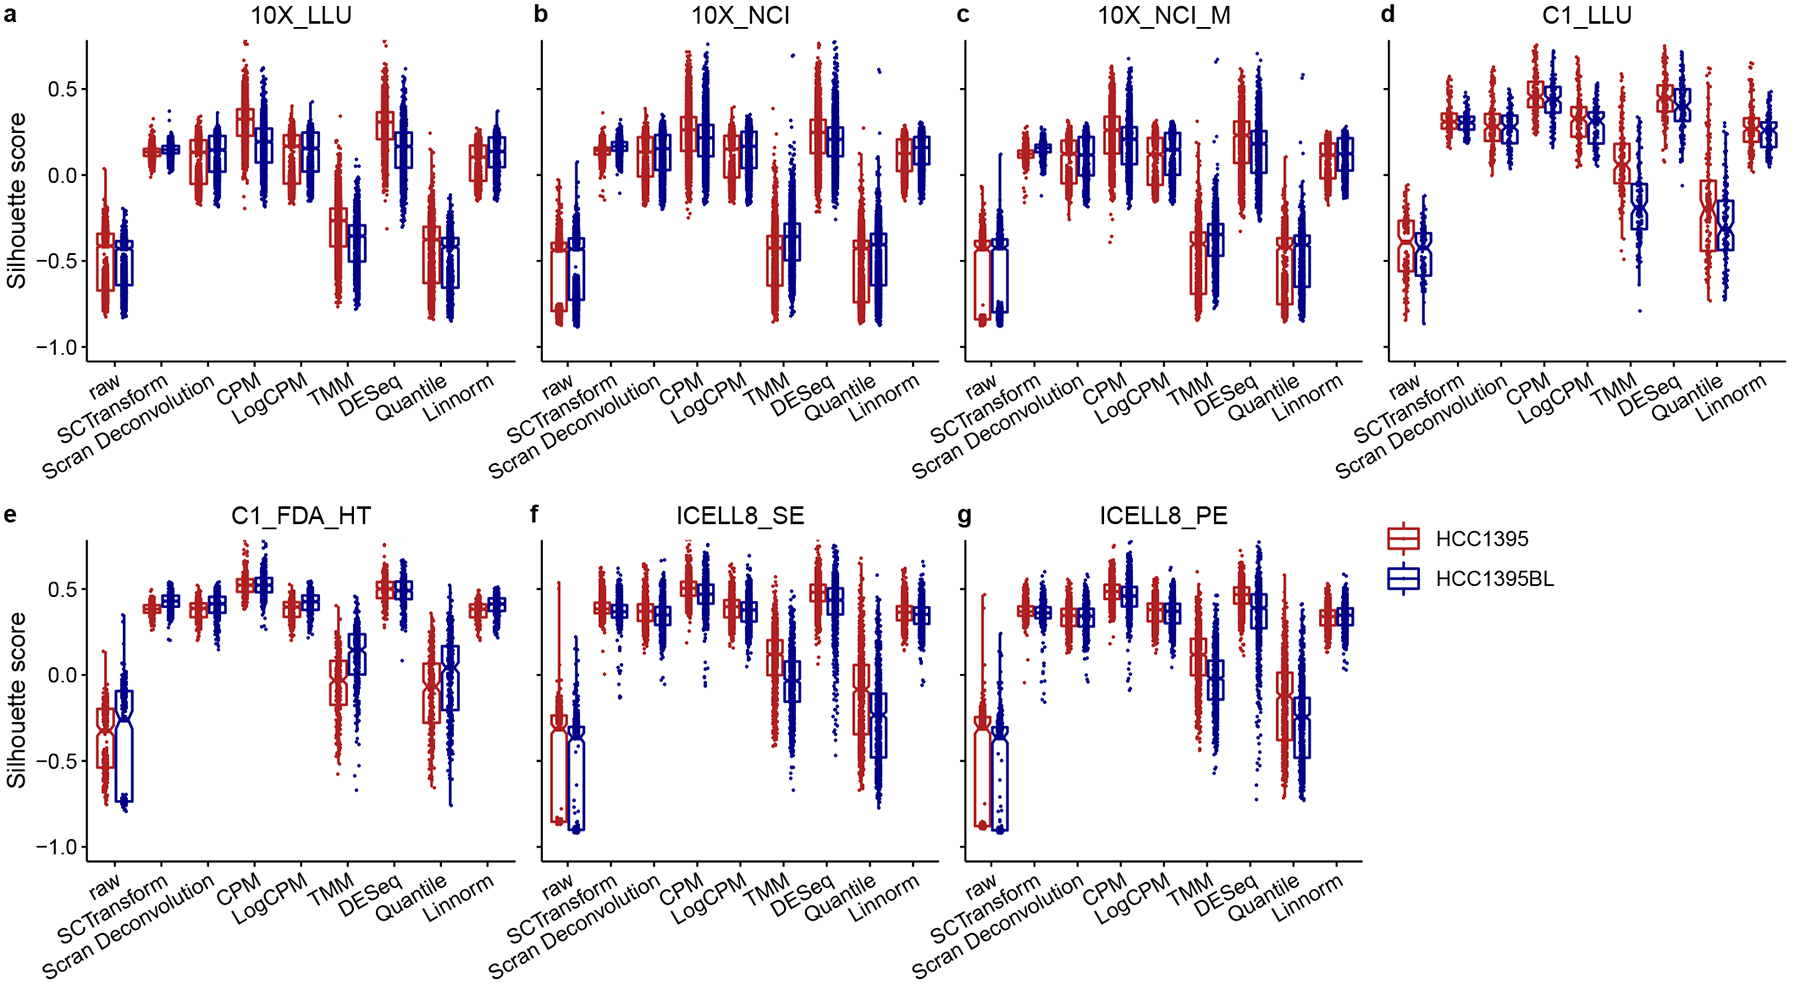
Comparing diverse single-cell RNA sequencing (scRNA-seq) datasets generated by different technologies and in different laboratories remains a major challenge. Here we address the need for guidance in choosing algorithms leading to accurate biological interpretations of varied data types acquired with different platforms. Using two well-characterized cellular reference samples (breast cancer cells and B cells), captured either separately or in mixtures, we compared different scRNA-seq platforms and several preprocessing, normalization and batch-effect correction methods at multiple centers. Although preprocessing and normalization contributed to variability in gene detection and cell classification, batch-effect correction was by far the most important factor in correctly classifying the cells. Moreover, scRNA-seq dataset characteristics (for example, sample and cellular heterogeneity and platform used) were critical in determining the optimal bioinformatic method. However, reproducibility across centers and platforms was high when appropriate bioinformatic methods were applied. Our findings offer practical guidance for optimizing platform and software selection when designing an scRNA-seq study.


Conflict of interest statement

Competing interests statement

Andrew Farmer and Alain Mir are employees of Takara Bio USA, Inc., and Ben Ernest and Urvashi Mehra were employees of Digicon Corporation. All other authors claim no conflicts of interest. The views presented in this article do not necessarily reflect current or future opinion or policy of the US Food and Drug Administration. Any mention of commercial products is for clarification and not intended as an endorsement.

Figures

Extended Data Figure 1.
Extended Data Figure 1.. An overview of the number of genes detected in each cell across all datasets.
The violin plot shows the number of genes detected in each cell across 20 scRNA-seq datasets. The plot was generated using Seurat (version 3.1). Each dot represents a single cell. The violin shapes summarize the data distributions, which are colored in the background to signify each of the 20 different scRNA seq datasets. Each scRNA-seq dataset is plotted on the X-axis; the Y-axis shows the corresponding number of genes detected in a cell (nGene) for that dataset. The average number of genes detected in each cell was about 4000 and most of the cells had 2500–7500 genes, except for samples C1_LLU_A and C1_LLU_B. The 10X Genomics scRNA datasets were preprocessed using CellRanger 3.1.
Extended Data Figure 2.
Extended Data Figure 2.. Regressing mitochondrial genes and normalizing UMI did not remove batch effects.
Five different batches of scRNA-seq data (10X_LLU_A, 10X_LLU_B, 10X_NCI_A, 10X_NCI_B, and 10X_NCI_Mix5) generated at two sites (LLU and NCI) are shown either as t-SNE plots (panels a-d) or as UMAPs (panels e-h). (a) LogNormalized, scaled data with no regression; (b) LogNormalized, scaled data filtered with mitochondrial (Mito) gene regression >5% and UMI normalization by Seurat v3; (c) ScTransform with no regression; (d) SCTransform with mitochondrial gene regression and UMI normalization; (e) LogNormalized, scaled data with no regression; (f) scaled data with mitochondrial gene regression and UMI normalization; (g) SCTransform with no regression; and (h) SCTransform with mitochondrial gene regression and UMI normalization.
Extended Data Figure 3.
Extended Data Figure 3.. UMAP showing batch effect correction by mixability and clusterability using scRNA-seq datasets in four different sample scenarios.
Batch-effect corrections were performed for the following four scenarios: (a) Scenario 1, where all 20 scRNA-seq datasets were combined, including mixed and non-mixed, with large proportions of two dissimilar types of cells (Sample A, breast cancer cell line HCC1395 and Sample B, B-lymphocyte line HCC1395BL); Datasets from 10X were down-sampled to 1200 cells per dataset. (b) Scenario 2, where five datasets (10X_LLU_A, 10X_NCI_A, C1_FDA_HT_A, C1_LLU_A, and ICELL8_SE_A) from the breast cancer cells (Sample A, HCC1395) were generated separately at four centers (LLU, NCI, FDA, and TBU) on four platforms (10X, Fluidigm C1, Fluidigm C1_HT, and TBU ICELL8); (c) Scenario 3, where five datasets (10X_LLU_B, 10X_NCI_B, C1_FDA_HT_B, C1_LLU_B, and ICELL8_SE_B) from B-lymphocytes (Sample B, HCC1395BL) were generated separately at four centers (LLU, NCI, FDA, and TBU) on four platforms (10X, Fluidigm C1, Fluidigm C1_HT, and TBU ICELL8); and (d) Scenario 4, where four datasets (10X_LLU_Mix10, 10X_NCI_M_Mix5, 10X_NCI_M_Mix5_F, and 10X_NCI_M_Mix5_F2) were generated from 5% or 10% of breast cancer cells (Sample A, HCC1395), spiked into the B-lymphocytes (Sample B, HCC1395BL), and analyzed with the 10X Genomics platform at two centers (LLU and NCI) in four different batches. Batch correction methods included Seurat v3.1, fastMNN (SeuratWrappers v0.1.0), Scanorama V1.4, BBKNN V1.3.5, Harmony V0.99.9, limma V3.40.4, and Combat (sva V3.32.1). The top 2000 highly variable genes (HVGs) of these datasets were used as the gene set for batch correction. All the 10X data were preprocessed using CellRanger 3.1.
Extended Data Figure 4.
Extended Data Figure 4.. t-SNE plots and UMAPs showing batch-effect corrections by mixability and clusterability across four scRNA-seq platforms.
t-SNE plots and UMAPs showing the batch-effect corrections performed by seven methods using 20 scRNA-seq datasets across different platforms. Datasets from 10X were down-sampled to 1200 cells per dataset. *Note, for BBKNN, only UMAP was available and shown. The scRNA-seq datasets are colored to identify the four different platforms: 10X 3´ scRNA-seq platform (red), C1 3´ HT scRNA-seq platform (yellow), C1 full-length scRNA-seq platform (light blue), and ICELL8 full-length scRNA-seq platform (dark blue). Batch correction methods included: Seurat v3.1, fastMNN (SeuratWrappers v0.1.0), Scanorama V1.4, BBKNN V1.3.5, Harmony V0.99.9, limma V3.40.4, and Combat (sva V3.32.1). Scanorama failed to separate two cell types into discrete clusters when non-10X platforms were included in the analysis. The top 2000 HVGs across all datasets were used as the gene set for batch correction. All the 10X data were preprocessed using CellRanger 3.1.
Extended Data Figure 5.
Extended Data Figure 5.. Batch effect correction displayed by cell type identity.
Batch-effect corrections were performed for the following four scenarios: (a) Scenario 1, where all 20 scRNA-seq datasets were combined, including mixed and non-mixed, with large proportions of two dissimilar types of cells (Sample A, breast cancer cell line HCC1395 and Sample B, B-lymphocyte line HCC1395BL); Datasets from 10X were down-sampled to 1200 cells per dataset. (b) Scenario 2, where five datasets (10X_LLU_A, 10X_NCI_A, C1_FDA_HT_A, C1_LLU_A, and ICELL8_SE_A) from the breast cancer cells (Sample A, HCC1395) were generated separately at four centers (LLU, NCI, FDA, and TBU) on four platforms (10X, Fluidigm C1, Fluidigm C1_HT, and TBU ICELL8); (c) Scenario 3, where five datasets (10X_LLU_B, 10X_NCI_B, C1_FDA_HT_B, C1_LLU_B, and ICELL8_SE_B) from B-lymphocytes (Sample B, HCC1395BL) were generated separately at four centers (LLU, NCI, FDA, and TBU) on four platforms (10X, Fluidigm C1, Fluidigm C1_HT, and TBU ICELL8); and (d) Scenario 4, where four datasets (10X_LLU_Mix10, 10X_NCI_M_Mix5, 10X_NCI_M_Mix5_F, 10X_NCI_M_Mix5_F2) were generated from 5% or 10% of breast cancer cells (Sample A, HCC1395) spiked into the B-lymphocytes (Sample B, HCC1395BL) and analyzed with the 10X Genomics platform at two centers (LLU and NCI) in four different batches. *For BBKNN, only UMAPs were available and shown in (a-d). The HCC1395 breast cancer cells (Sample A) were labeled in red and the HCC1395BL B lymphocytes (Sample B) were labeled in blue. Batch correction methods included Seurat v3.1, fastMNN (SeuratWrappers v0.1.0), Scanorama V1.4, BBKNN V1.3.5, Harmony V0.99.9, limma V3.40.4, and Combat (sva V3.32.1). The top 2000 HVGs were used as the gene set for batch correction. All the 10X data were preprocessed using CellRanger 3.1.
Extended Data Figure 6.
Extended Data Figure 6.. Scanorama worked well for 10X Genomics scRNA-seq datasets regardless of the presence of shared cell types across batches.
(a) t-SNE plot and (b) UMAP showing batch-effect corrections using twelve 10X Genomics scRNA-seq datasets consisting of both mixed and non-mixed samples from two sites (LLU and NCI) in different batches after Scanorama (version 1.4.) batch correction. (c) t-SNE plot and (d) UMAP showing projections of batch-effect corrections using six 10X scRNA-seq datasets consisting of only non-mixed samples from two sites (LLU and NCI) in different batches after Scanorama (version 1.4.) batch correction. Different colors represent different datasets. All the datasets were down-sampled to 1200 cells per dataset. After the batch correction, cells from the same cell line type clustered together and mixed adequately within the same cell types. All the data were preprocessed using CellRanger 3.1.
Extended Data Figure 7.
Extended Data Figure 7.. Batch-effect correction evaluating clusterability using 14 scRNA-seq datasets without spiked-in mixtures.
t-SNE plots and UMAPs showing batch-effect corrections performed by seven methods using 14 non-mixture scRNA-seq datasets across different platforms and sites. Six spiked-in mixture scRNA-seq datasets (10X_LLU_Mix10, 10X_NCI_Mix5, 10X_NCI_Mix5_F, 10X_NCI_M_Mix5, 10X_NCI_M_Mix5_F, and 10X_NCI_M_Mix5_F2) were removed from the 20 datasets in Scenario 1 for batch-effect correction evaluation. The fourteen non-mixture scRNA-seq datasets are from both breast cancer cells (10X_LLU_A, 10X_NCI_A, 10X_NCI_M_A, C1_FDA_HT_A, C1_LLU_A, ICELL8_SE_A, and ICELL8_PE_A) and B-lymphocytes (10X_LLU_B, 10X_NCI_B, 10X_NCI_M_B, C1_FDA_HT_B, C1_LLU_B, ICELL8_SE_B, and ICELL8_PE_B). Datasets from 10X were down-sampled to 1200 cells per dataset. *Note, for BBKNN, only UMAP was available and shown. Batch correction methods included Seurat v3.1, fastMNN (SeuratWrappers v0.1.0), Scanorama V1.4, BBKNN V1.3.5, Harmony V0.99.9, limma V3.40.4, and Combat (sva V3.32.1). All the 10X data were preprocessed using CellRanger 3.1.
Extended Data Figure 8.
Extended Data Figure 8.. fastMNN batch-effect correction depends on the order of importing scRNA-seq data into the pipeline.
Panels (a-c) show results obtained using fastMNN when the spiked-in (mixed) datasets (i.e., 10X_LLU_Mix10, 10X_NCI_Mix5, 10X_NCI_Mix5_F, 10X_NCI_M_Mix5, 10X_NCI_M_Mix5_F, and 10X_NCI_M_Mix5_F2) were imported into the pipeline before other non-mixed scRNA-seq datasets from the 20 scRNA-seq datasets of Scenario 1. (a) t-SNE vs. UMAP with color-coding by dataset; (b) tSNE vs. UMAP, colored by cell types (HCC1395, red; HCC1395BL, blue); and (c) A silhouette score = 0.52 showing that fastMNN correctly separated the two cell types into two clusters representing breast cancer cells and B lymphocytes. Panels (d-f) show results obtained using fastMNN when the non-mixed datasets were imported into the pipeline before the mixture datasets. (d) tSNE vs. UMAP with color-coding by datasets or (e) tSNE vs. UMAP colored by cell types; and (f) A low silhouette score of 0.22 showing that fastMNN had difficulty correctly separating the two cell types in this case. Batch-effect corrections were performed using fastMNN (SeuratWrappers v0.1.0) and silhouette width scores were calculated using the silhouette function from the R package cluster (v.2.0.8). Datasets from 10X were down-sampled to 1200 cells per dataset. The order of dataset input is shown on the top of the Figures (a, b, c or d, e, f).
Extended Data Figure 9.
Extended Data Figure 9.. Correlations of gene expression profiles across datasets.
Scatter plots displaying the gene expression profile correlations between each of seven scRNA-seq datasets (10X_LLU, 10X_NCI, 10X_NCI_M, C1_FDA, C1_LLU, ICELL8_SE, and ICELL8_PE) vs. their corresponding bulk RNA-seq dataset (BK_RNA-seq) for either (a) breast cancer cells or (b) B lymphocytes. The commonly detected transcripts [(log(CPM +1) normalized] across all datasets were used (15,553 genes for breast cancer cells and 15,201 genes for B lymphocytes) to generate the scatter plots. Each dot represents each gene as a point in each scatterplot; x,y values represent the gene expression variation in a pair of compared datasets. The middle diagonal bar charts display the distribution of the most abundant or rare genes in each dataset and also provide the labels for the respective datasets. The Pearson correlation coefficient R between each of the datasets compared is shown to display the consistency of the different RNA-seq datasets.
Extended Data Figure 10.
Extended Data Figure 10.. Scanorama batch correction using 10X and non-10X scRNA-seq datasets from two different studies.
(a, un-corrected) UMAP of 10 datasets (10X: PBMCs 68K, PBMCs 3K, CD19+ B cells, CD14+ monocytes, CD4+ helper T cells, CD56+ NK cells, CD8+ cytotoxic T cells, CD4+CD45RO+ memory T cells, CD4+CD25+ regulatory T cells; Drop-seq: PBMCs) out of 26 datasets from Hie et al. before batch correction by Scanorama. (b, corrected-based on dataset) UMAP of 10 different datasets shown in (a) from Hie et al. after batch correction by Scanorama, colored to identify the datasets. (c, corrected-based on platform) UMAP of 10 different datasets shown in (a) from Hie et al. colored to identify the two different platforms used (10X Genomics and Drop-seq); note poor results using Drop-seq. (d, un-corrected) UMAP of 8 datasets (breast cancer cells: C1_FDA_HT_A, C1_LLU_A, ICELL8_SE_A, and ICELL8_PE_A; and B lymphocytes: C1_FDA_HT_B, C1_LLU_B, ICELL8_SE_B, and ICELL8_PE_B) out of 20 datasets in our study analyzed using three different non-10X sequencing platforms before batch correction by Scanorama. (e, corrected-based on dataset) UMAP of 8 datasets shown in (d) after batch correction by Scanorama, colored to identify the datasets. Note lack of discrimination between different cell types. (f, corrected-based on platform) UMAP of 8 datasets shown in (d) after batch correction by Scanorama, colored to identify the platforms (C1_FDA_HT, blue; C1, purple; ICELL8, pink). The PBMC datasets were downloaded from http://scanorama.csail.mit.edu/data_light.tar.gz. Our eight datasets were preprocessed using the featureCounts pipeline and batch-effect correction was performed using Scanorama V1.4.
Figure 1.
Figure 1.. Overall study design, scRNA-seq mapping, and numbers of genes detected across datasets.
(a) Schematic overview of the study design (see detailed descriptions and notations in the Methods). Two reference cell lines (Sample A, HCC1395; and Sample B, HCC1395BL) were used to generate scRNA-seq data across four platforms (10X Genomics, Fluidigm C1, Fluidigm C1 HT, and Takara Bio ICELL8), four testing sites (LLU, NCI, FDA, and TBU). At the LLU and NCI sites (10X), mixed single-cell captures and library constructions were also prepared with either 10% or 5% cancer cells spiked into the B lymphocytes. At the NCI site, single-cell captures and library constructions were also performed with methanol-fixed cell mixtures (5% cancer cells spiked into B lymphocytes, Fixed 1 & 2). One set of 10X scRNA libraries from NCI was also sequenced using a shorter modified sequencing method. Bulk cell RNA-seq was also obtained from these cell lines, each in triplicate. See Methods for details about study design. (b) For both the breast cancer cell line (Sample A) and the B lymphocyte line (Sample B) across 14 pair-wise datasets, percentage of reads mapped to the exonic region (blue), non-exonic region (orange), or not mapped to the human genome (gray). For unique molecular identifier (UMI) methods (10X), dark blue indicates the exonic reads with UMIs. (c) Median number of genes detected per cell at different sequencing read depths.
Figure 2.
Figure 2.. Effect of pre-processing pipeline on the number of genes detected with UMI- and non-UMI-based scRNA-seq datasets.
(a–c) Evaluation of the UMI-based (10X) data with Cell Ranger, UMI-Tools, or zUMIs. (d–e) Evaluation of data from non-UMI based technologies C1 full-length transcript, C1 HT, and ICELL8 full-length transcript using FeatureCounts, Kallisto, or RSEM. (a) Bar plot showing the number of cells captured with UMI-based technology; (b) and (d) Box plot showing the number of genes detected per cell in UMI-based and non-UMI based technologies, respectively; (c) and (e) Violin plots showing the gene expression correlation and consensus genes [represented by IoU (Intersection over Union)] per cell between any two pipelines in UMI-based and non-UMI based technologies, respectively. The sample sizes (n) used to derive statistics in (b) and (d) were: (b) 10X_LLU_A, n= 3045 cells; 10X_NCI_A, n=6425 cells; 10X_NCI_M_A, n=6483 cells; 10X_LLU_B, n=1439 cells; 10X_NCI_B, n=3296 cells; 10X_NCI_M_B, n=3273 cells; (d) C1_LLU_A, n=80 cells; C1_FDA_HT_A, n=203 cells; ICELL8_SE_A, n=600 cells; ICELL8_PE_A, n=598 cells; C1_LLU_B, n=66 cells; C1_FDA_B, n=241 cells; ICELL8_SE_B, n=600 cells; ICELL8_PE_B, n=596 cells. For detailed statistics regarding minima, maxima, centre, bounds of box and whiskers and percentile related to the figure, please refer to Supplementary Table 5.
Figure 3.
Figure 3.. Silhouette score boxplot comparing eight normalization methods.
Boxplot of silhouette values stratified by eight normalization methods across 14 datasets, including (a) 10X_LLU, (b) 10X_NCI, (c) 10X_NCI_M, (d) C1_FDA_HT, (e) C1_LLU, (f) ICELL8_PE, and (g) ICELL8_SE in breast cancer cells (HCC1395; Sample A) and B lymphocytes (HCC1395BL; Sample B). Eight normalization methods included SCTransform, Scran Deconvolution, CPM, LogCPM, TMM, DESeq, Quantile, and Linnorm. For each dataset, reads of each cell were down-sampled to two different read depths (10K and 100K per cell) before calculating the silhouette width values. LogCPM normalization performed fairly well and was used as the default normalization for our subsequent batch-effect correction analyses. Two normalization methods developed for bulk cell RNA-seq (TMM and Quantile) had the lowest scores. The sample sizes (n) used to derive statistics were: 10X_LLU_A, n= 3560 cells, 10X_LLU_B, n=1770 cells; 10X_NCI_A, n=4284 cells, 10X_NCI_B, n=4136 cells; 10X_NCI_M_A, n=1372 cells, 10X_NCI_M_B, n=2082 cells; C1_LLU_A, n=160 cells, C1_LLU_B, n=132 cells; C1_FDA_HT_A, n=318 cells, C1_FDA_HT_B, n=374 cells; ICELL8_SE_A, n=1134 cells, ICELL8_SE_B, n=1078 cells; ICELL8_PE_A, n=980 cells, ICELL8_PE_B, n=954 cells). For detailed statistics regarding minima, maxima, centre, bounds of box and whiskers and percentile related to the figure, please refer to Supplementary Table 6.
Figure 4.
Figure 4.. Batch-effect corrections evaluated in four different sample composition scenarios.
(a) Batch-effect correction in Scenario #1, where all 20 scRNA-seq datasets were combined, including mixed and non-mixed, with large proportions of two dissimilar types of cells (Sample A, breast cancer cell line HCC1395; and Sample B, B-lymphocyte line HCC1395BL). Datasets from 10X were down-sampled to 1200 cells per dataset. (b) Batch-effect correction in Scenario #2, where five scRNA-seq datasets (10X_LLU_A, 10X_NCI_A, C1_FDA_HT_A, C1_LLU_A, and ICELL8_SE_A) from the breast cancer cells were generated separately at the four centers (LLU, NCI, FDA, and TBU) on four platforms (10X, Fluidigm C1, Fluidigm C1_HT, and TBU ICELL8); (c) Batch-effect correction in Scenario #3, where five scRNA-seq datasets (10X_LLU_B, 10X_NCI_B, C1_FDA_HT_B, C1_LLU_B, and ICELL8_SE_B) from the B lymphocytes were generated separately at the four centers on the same four platforms; (d) Batch-effect correction in Scenario #4, where four datasets (10X_LLU_Mix10, 10X_NCI_M_Mix5, 10X_NCI_M_Mix5_F, 10X_NCI_M_Mix5_F2) were generated from 5% or 10% breast cancer cells spiked into B lymphocytes, and analyzed with the 10X Genomics platform at two centers in four different batches. Each dataset is indicated by a unique color in panels (a) to (d). Idealized projection of cells for the four different scenarios is presented on the left. *Note for BBKNN, only UMAP is available and shown. Silhouette width score quantifying the clusterability for (e) Scenario #1 or (f) Scenario #4, corresponding to panels (a) and (d), respectively. (g) kBET acceptance score quantifying the mixability, calculated using the cross-platform/center scRNA-seq data acquired either from breast cancer cells only or from B-lymphocytes only for all four scenarios (a-d, also labeled as Scenarios #1–#4).
Figure 5.
Figure 5.. Feature plots showing cell type clustering based on cell type-specific marker genes across 20 scRNA-seq datasets.
Feature plots generated across 20 scRNA-seq datasets using the top 10 DEGs specific for (a) breast cancer cells before batch-effect correction; (b) breast cancer cells after fastMNN batch-effect correction; (c) B lymphocytes before batch correction; and (d) B lymphocytes after fastMNN batch-effect correction. Datasets from 10X were down-sampled to 1200 cells per dataset. In feature plots, genes with relatively high expression in each cell are highlighted in brick red (corresponding to breast cancer cells; Sample A) or blue (corresponding to B cells; Sample B).
Figure 6.
Figure 6.. Performance ranking of bioinformatics metrics and best-practice recommendations.
(a) Gene detection sensitivity measured separately for each of the three classes of scRNA-seq protocol: 10X-, non-10X-based 3´ tagging, and full-length. (b) Normalization methods ranked by their clusterability as measured by Z-scores (either the median or the variance of the silhouette width across the 14 datasets). (c) Batch-correction methods ranked by their clusterability as measured by Z-score from the harmonic mean of the silhouette scores (Scenarios #1 and #4). (d) Batch-correction methods ranked by their mixability as measured by Z-score from the harmonic mean of kBET acceptance scores (Scenarios #1–#4). Z-scores are plotted as circles with their size and color shade scaled to the Z-score value from large to small, and dark blue to light blue. Note that larger Z-score values imply better performance, except for clusterability variance, where a smaller value is preferred: *Larger is better; **Smaller is better. (e) Best practice recommendations for single-cell RNA-seq analysis. #The current version of Scanorama did not correct batch effects for data from multiple platforms; however, it worked well when only 10X Genomics data were analyzed. ##Seurat v.3 was suitable for biologically similar samples, but over-corrected batch effects and misclassified cell types if large fractions of distinct cell types were present in different batches.

Similar articles

Cited by

References

    1. Klein AM et al. Droplet barcoding for single-cell transcriptomics applied to embryonic stem cells. Cell 161, 1187–1201 (2015). - PMC - PubMed
    1. Macosko EZ et al. Highly Parallel Genome-wide Expression Profiling of Individual Cells Using Nanoliter Droplets. Cell 161, 1202–1214 (2015). - PMC - PubMed
    1. Gierahn TM et al. Seq-Well: portable, low-cost RNA sequencing of single cells at high throughput. Nat Methods 14, 395–398 (2017). - PMC - PubMed
    1. Liu T, Wu H, Wu S & Wang C Single-Cell Sequencing Technologies for Cardiac Stem Cell Studies. Stem Cells Dev 26, 1540–1551 (2017). - PubMed
    1. Wu H, Wang C & Wu S Single-Cell Sequencing for Drug Discovery and Drug Development. Curr Top Med Chem 17, 1769–1777 (2017). - PubMed

Publication types

LinkOut - more resources