. 2021 Feb;24(2):225-233.
doi: 10.1038/s41593-020-00759-4. Epub 2020 Dec 21.

Long-term self-renewing stem cells in the adult mouse hippocampus identified by intravital imaging

Affiliations

Long-term self-renewing stem cells in the adult mouse hippocampus identified by intravital imaging

Sara Bottes et al. Nat Neurosci. 2021 Feb.

Abstract

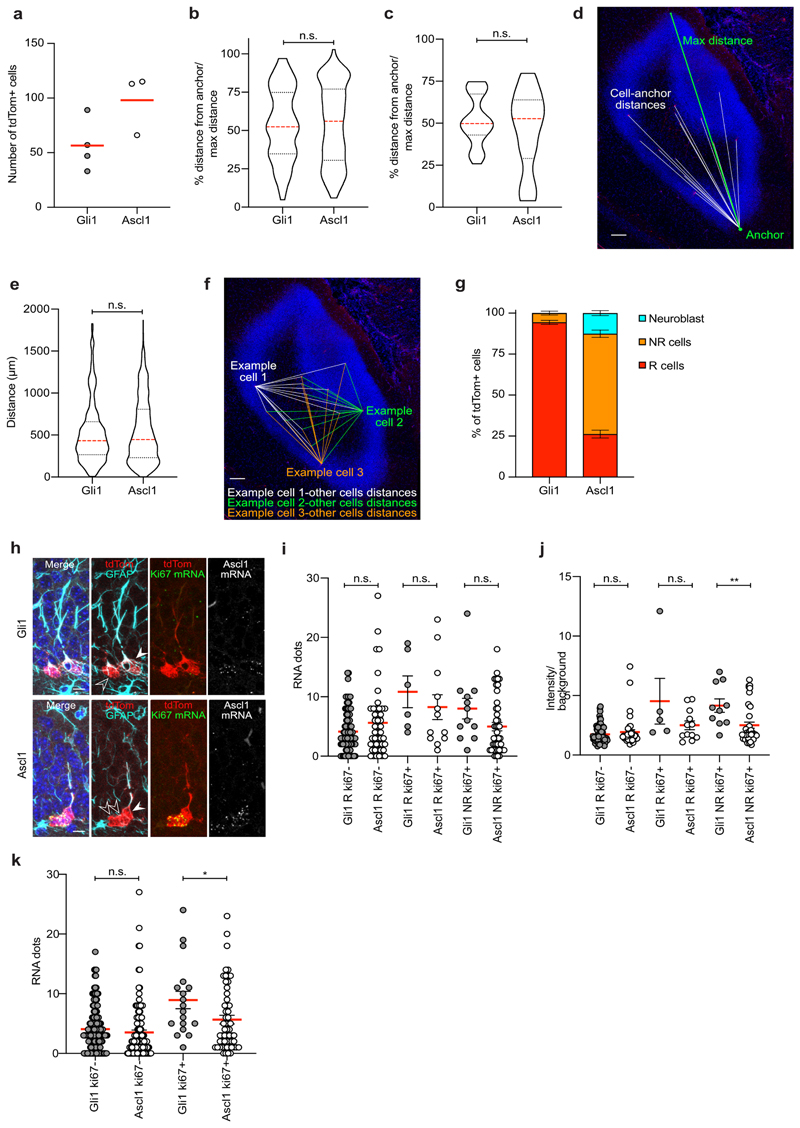
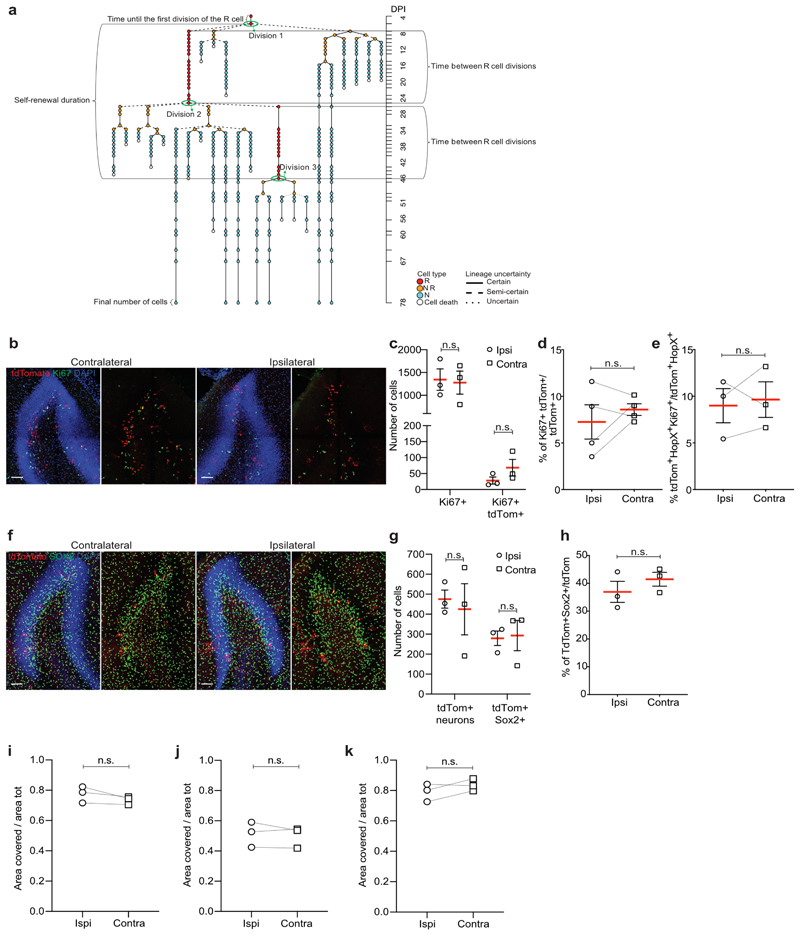
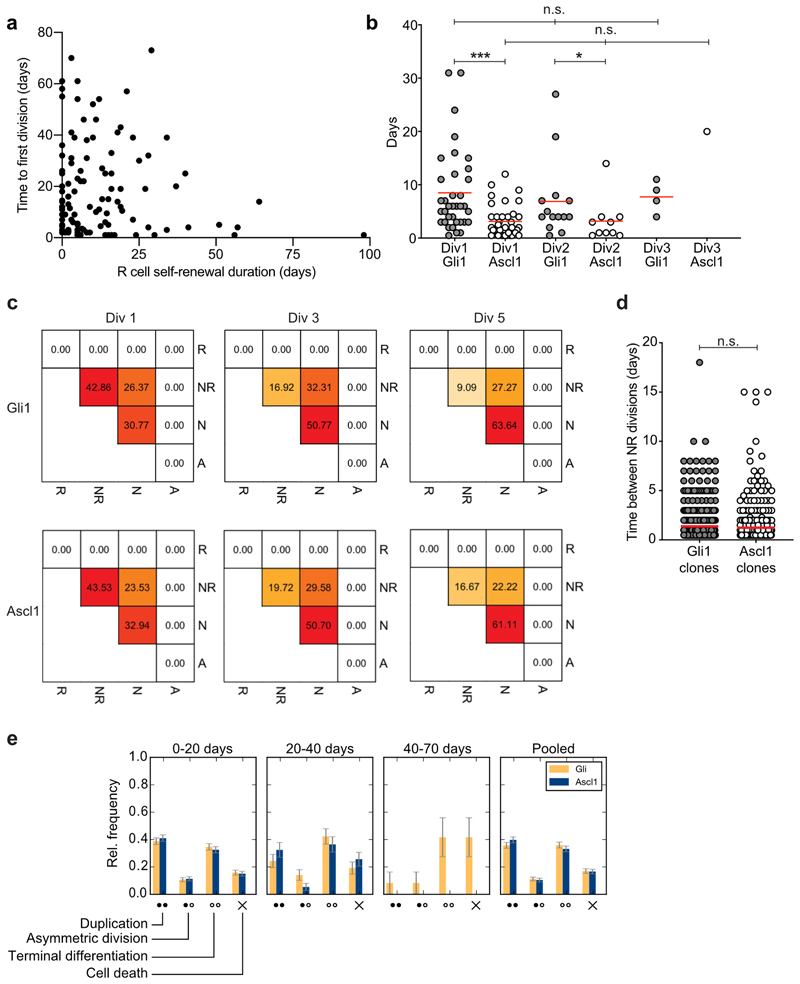
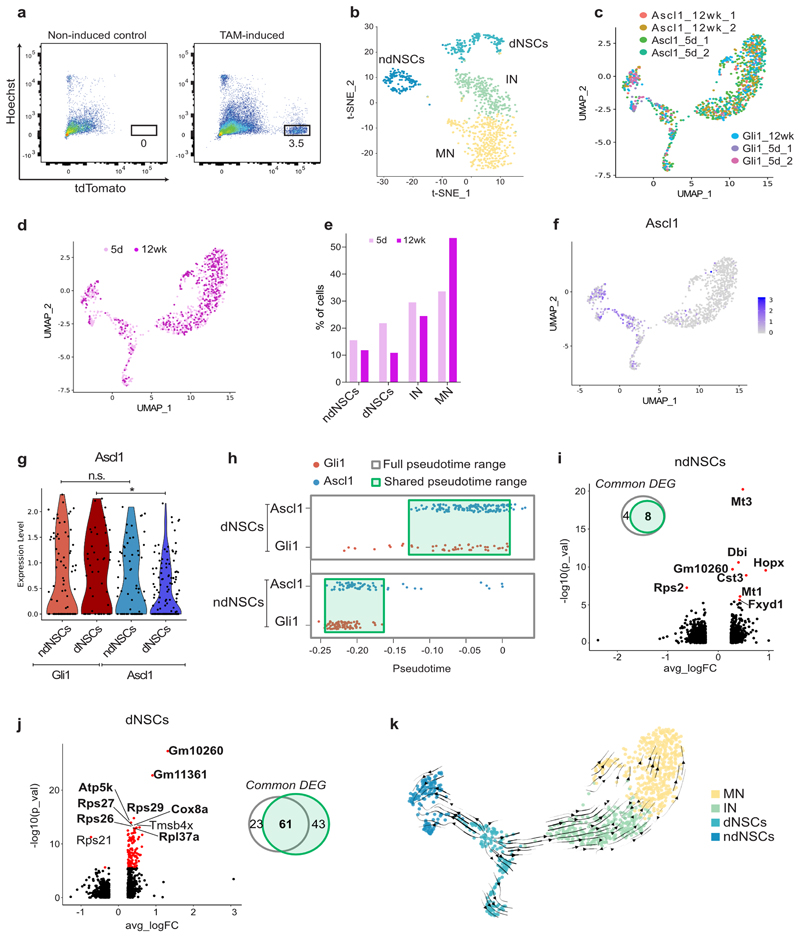
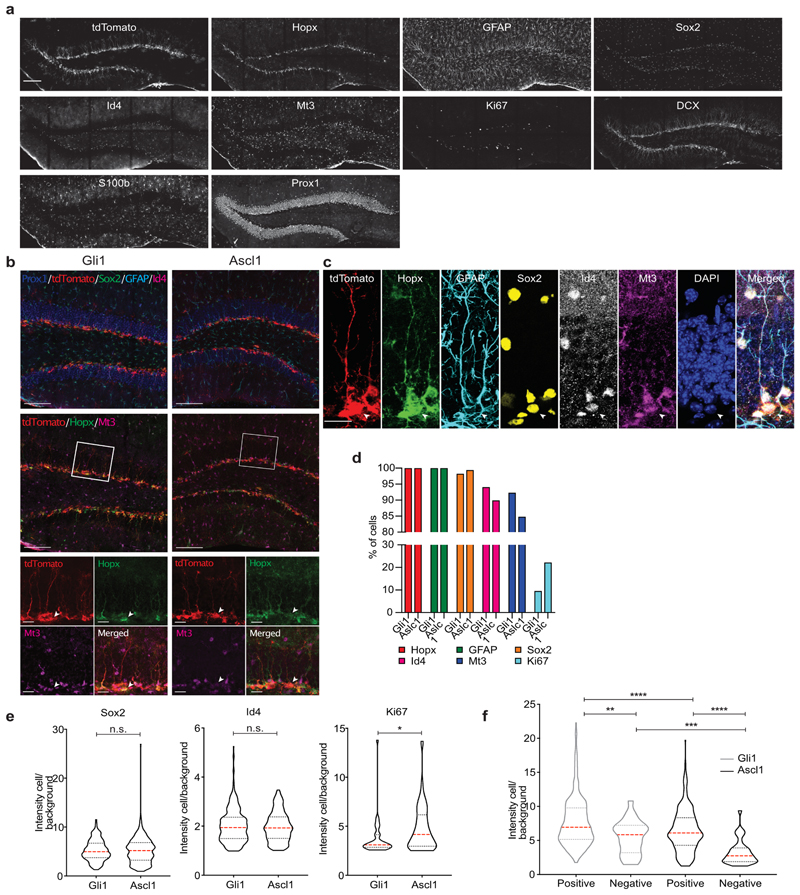
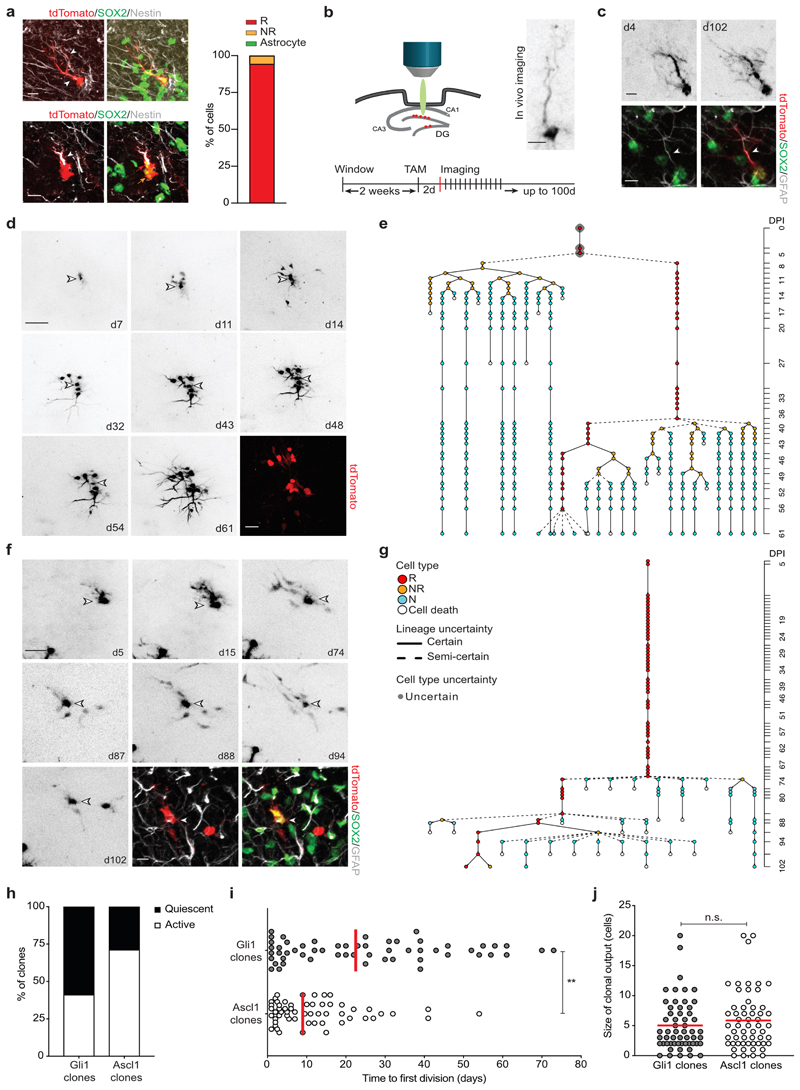
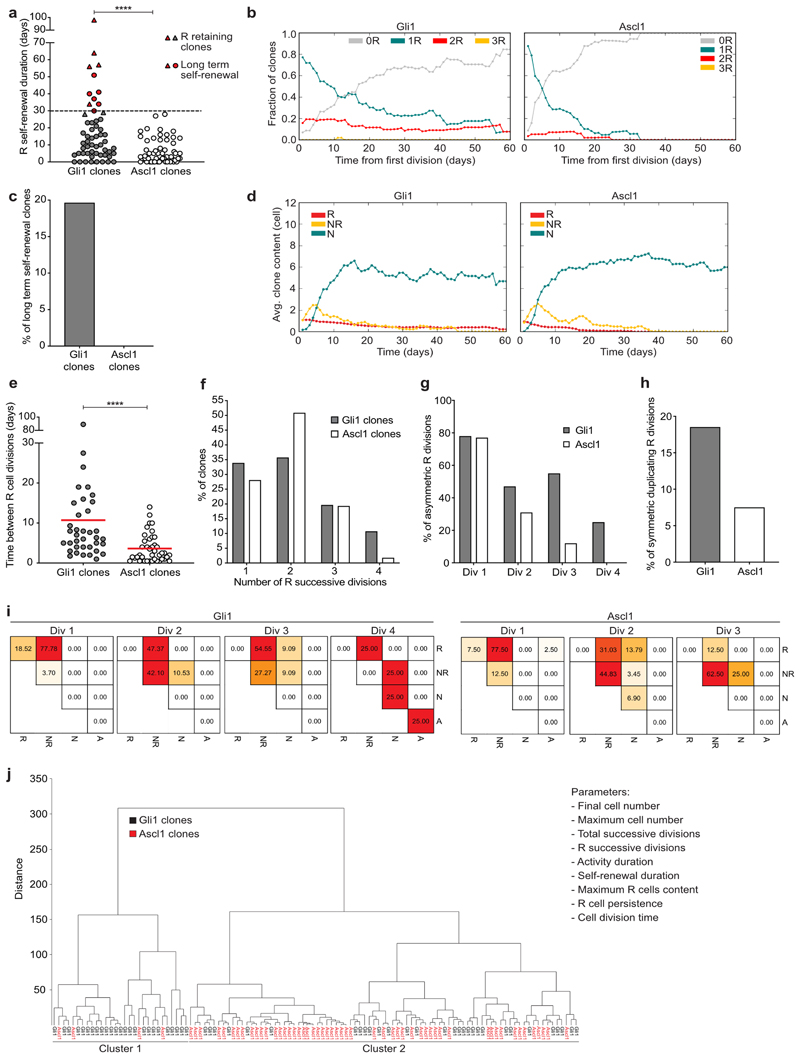
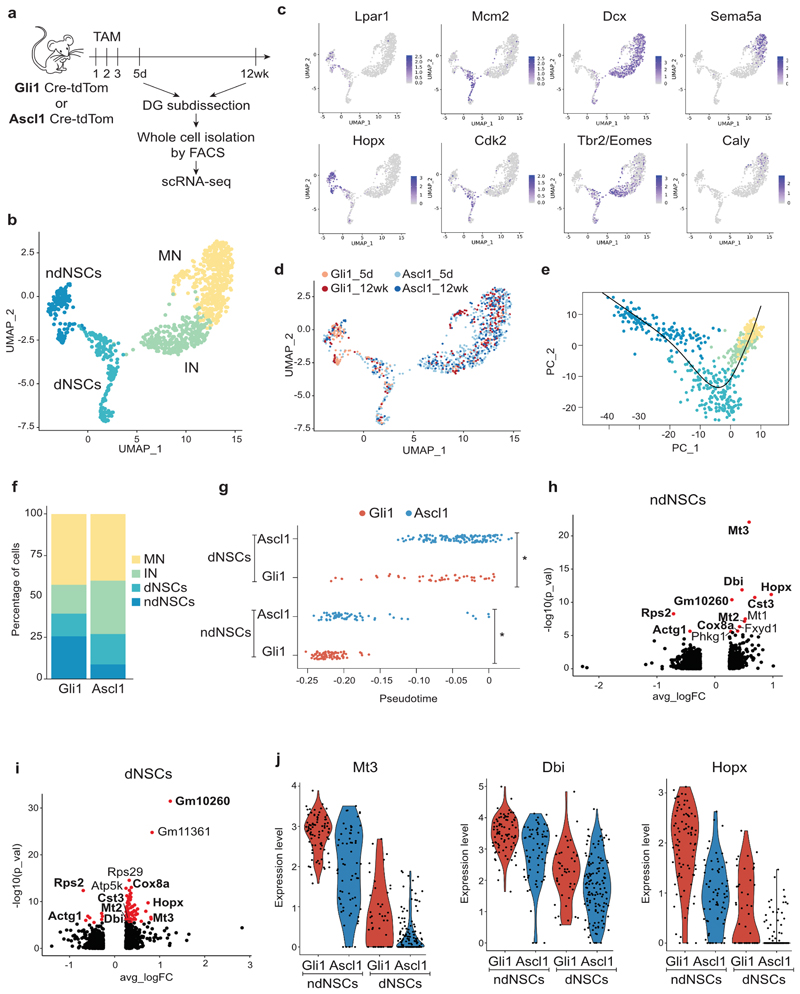
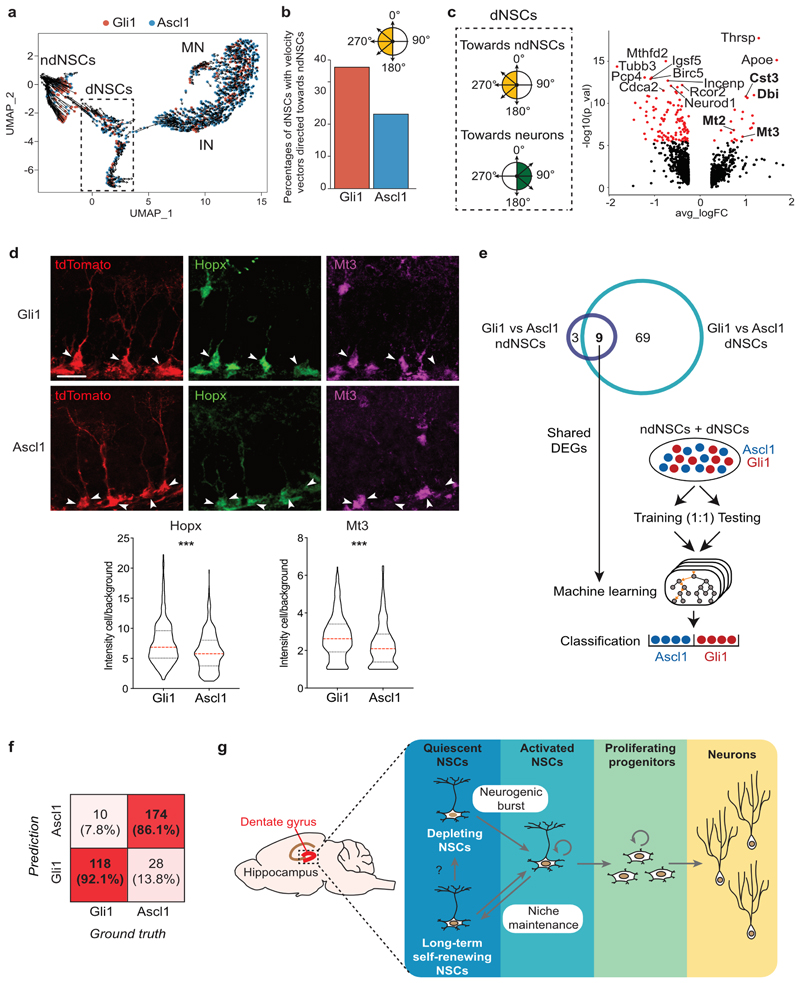
Neural stem cells (NSCs) generate neurons throughout life in the mammalian hippocampus. However, the potential for long-term self-renewal of individual NSCs within the adult brain remains unclear. We used two-photon microscopy and followed NSCs that were genetically labeled through conditional recombination driven by the regulatory elements of the stem cell-expressed genes GLI family zinc finger 1 (Gli1) or achaete-scute homolog 1 (Ascl1). Through intravital imaging of NSCs and their progeny, we identify a population of Gli1-targeted NSCs showing long-term self-renewal in the adult hippocampus. In contrast, once activated, Ascl1-targeted NSCs undergo limited proliferative activity before they become exhausted. Using single-cell RNA sequencing, we show that Gli1- and Ascl1-targeted cells have highly similar yet distinct transcriptional profiles, supporting the existence of heterogeneous NSC populations with diverse behavioral properties. Thus, we here identify long-term self-renewing NSCs that contribute to the generation of new neurons in the adult hippocampus.


Conflict of interest statement

Competing interests statement

The authors declare no competing interests.

Figures

Extended Data Fig. 1
Extended Data Fig. 1. Characterization of Gli1 and Ascl1-targeted cells.
a, Number of tdTom+ cells in the SGZ 2d after recombination in Gli1 (n = 4 mice) and Ascl1 (n = 3 mice). b, Percentage of the distance of tdTom+ R cells from the anchor/max distance in Gli1 and Ascl1 at 2dpi. Horizontal sections, first 300 μm of DG are considered (Gli1: 53.93 ± 2.27, n = 106 cells; Ascl1: 54.35 ± 1.83, n = 199 cells; Mann Whitney test: Mann-Whitney U = 10407; p = 0.849, two-tailed). c, Percentage of the distance of imaged clones from the anchor/max distance in Gli1 and Ascl1 at 2mpi. Horizontal sections (Gli1: 51.6 ± 2.31, n = 40 clones; Ascl1: 45.6 ± 5.63, n = 18 clones; Mann Whitney test: Mann-Whitney U = 337; p = 0.708, two-tailed). d, Representation of the method used to quantify the distances between R cells and the anchor. Horizontal view of the DG. e, Quantification of the distance between pairs of tdTom+ R cells in Gli1 and Ascl1 at 2dpi. Horizontal sections, first 300 μm of DG are considered (Gli1: 523.5 ± 14.86, n = 608 pair of cells; Ascl1: 546.1 ± 9.25, n = 1696 pair of cells; Mann Whitney test: Mann-Whitney U = 505390; p = 0.469, two-tailed). f, Representation of the method used to quantify the distances between pair of R cells (only the pairings of 3 R cells with all the other R cells in the section are shown as examples). Horizontal view of the DG. g, Quantification of tdTom+ cell types in the SGZ 2d after recombination in Gli1 (n = 4 mice) and Ascl1 (n = 3 mice). h, Representative pictures of RNA-Scope with Ki67 probe (green) and Ascl1 probe (grey) and immunostaining for tdTomato (red) and GFAP (cyan) of Gli1 and Ascl1-targeted cells at 5dpi. Filled arrowheads point to R cells; empty arrowheads point to NR cells. i, Quantification of the Ascl1 mRNA dots of: R ki67- cells (Gli1: 4.136 ± 0.366, n = 88 cells; Ascl1: 5.617 ± 0.851, n = 47 cells; Unpaired t-test: t = 1.855; df = 133; p = 0.065, two-tailed), R ki67+ cells (Gli1: 10.83 ± 2.676, n = 6; Ascl1: 8.250 ± 2.089, n = 12; Unpaired t-test: t = 0.734; df = 16; p = 0.473, two-tailed), NR ki67+ cells (Gli1: 8.000 ± 1.741, n = 12; Ascl1: 4.978 ± 0.7160, n= 45; Unpaired t-test: t = 1.834; df = 55; p = 0.0721, two-tailed). j, Quantification of the Ascl1 mRNA levels (fluorescence intensity of the cell/background) of: R ki67- cells (Gli1: 1.739 ± 0.083, n = 77 cells; Ascl1: 1.933 ± 0.198, n = 40 cells; Unpaired t-test: t = 1.055; df = 115; p = 0.293, two-tailed), R ki67+ cells (Gli1: 4.528 ± 1.919, n = 5; Ascl1: 2.502 ± 0.369, n = 12; Unpaired t-test: t = 1.54; df = 15; p = 0.144, two-tailed), NR ki67+ cells (Gli1: 4.157 ± 0.566, n = 10; Ascl1: 2.510 ± 0.258, n= 39; Unpaired t-test: t = 2.815; df = 47; **p = 0.007, two-tailed). k, Quantification of the Ascl1 mRNA dots of: ki67- cells (Gli1: 4.067 ± 0.295, n = 149 cells; Ascl1: 3.516 ± 0.405, n = 124 cells; Unpaired t-test: t = 1.121; df = 271; p = 0.263, two-tailed), ki67+ cells (Gli1: 8.944 ± 1.454, n = 18; Ascl1: 5.667 ± 0.728, n = 57; Unpaired t-test: t = 2.141; df = 73; *p = 0.035, two-tailed). Values are shown as mean ± s.e.m. Bars in violin plots represent median and quartiles. Scale bars represent 100 μm (d,f) and 10 μm (h). For detailed statistics, see Supplementary Table 5.1
Extended Data Fig. 2
Extended Data Fig. 2. Intravital 2-photon imaging does not affect proliferation or lineage commitment of Gli1-targeted NSCs.
a, Explanatory scheme of the different parameters extracted from lineage data of the imaged clones. b, Comparison of cell proliferation in contralateral and ipsilateral side in Gli1 mice after 2 months of 2-photon imaging (dorsal DG, horizontal sections). c, Quantification of Ki67+ cells and Ki67+ tdTom+ cells in contra- and ipsilateral side. Horizontal sections, first 360 μm of DG are considered (Ki67+ ipsilateral: 1345 ± 235.7, n = 3 mice; Ki67+ contralateral: 1278 ± 252.2, n = 3 mice; Paired t-test: t = 0.2631; df = 2; p = 0.817, two-tailed. Ki67+/tdTom+ ipsilateral: 28 ± 11.06, n = 3 mice; Ki67+/tdTom+ contralateral: 68.33 ± 26.1, n = 3 mice; Paired t-test: t = 2.678; df = 2; p = 0.116, two-tailed). d, Percentage of Ki67+ tdTom+/tdTom+ cells in contra- and ipsilateral side (ipsilateral: 7.26 ± 1.84, n = 4 mice; contralateral: 8.58 ± 0.63, n = 4 mice; Paired t-test: t = 0.895; df = 3; p = 0.436, two-tailed). e, Percentage of tdTom+ Hopx+ Ki67+/tdTom+ Hopx+ cells in contra- and ipsilateral side (ipsilateral: 9.0 ± 1.83, n = 3 mice; contralateral: 9.63 ± 1.91, n = 3 mice; Paired t-test: t = 0.392; df = 2; p = 0.733, two-tailed). f, Comparison of the number and identity of tdTom+ cells in contralateral and ipsilateral side in Gli1 mice after 2 months of 2-photon imaging (dorsal DG, horizontal sections). g, Quantification of tdTom+ neurons and Sox2+ tdTom+ glial cells in contra- and ipsilateral side. Horizontal sections, first 360 μm of DG are considered (tdTom+ ipsilateral: 475.3 ± 45.16, n = 3 mice; tdTom+ contralateral: 424.7 ± 128.2, n = 3 mice; Paired t-test: t = 0.475; df = 2; p = 0.681, two-tailed. tdTom+ SOX2+ ipsilateral: 279.3 ± 36.5, n=3 mice; tdTom+ Sox2+ contralateral: 293 ± 75.5, n = 3 mice; Paired t-test: t = 0.345; df = 2; p = 0.762, two-tailed). h, Percentage of Sox2+ tdTom+/tdTom+ in contra- and ipsilateral side (ipsilateral: 36.93 ± 3.78, n = 3 mice; contralateral: 41.49 ± 2.49, n = 3 mice; Paired t-test: t = 1.347; df = 2; p = 0.31, two-tailed). i, Quantification of the DG area covered by GFAP+ cells/area tot in Gli1 contra- and ipsilateral side at 2 weeks after surgery (ipsilateral: 0.77 ± 0.03, n = 3 mice; contralateral: 0.73 ± 0.01, n = 3 mice; Paired t -test: t = 2.004; df = 2; p = 0.183, two-tailed). j, Quantification of the DG area covered by Iba1+ cells/area tot in Gli1 contra- and ipsilateral side at 2 weeks after surgery (ipsilateral: 0.51 ± 0.05, n = 3 mice; contralateral: 0.5 ± 0.04, n = 3 mice; Paired t-test: t = 0.677; df = 2; p = 0.568, two-tailed). k, Quantification of the DG area covered by GFAP+ cells/area tot in Gli1 contra- and ipsilateral side at 2.5 months after surgery (ipsilateral: 0.79 ± 0.03, n = 3 mice; contralateral: 0.83 ± 0.02, n = 3 mice; Paired t-test: t = 1.654; df = 2; p = 0.24, two-tailed). Values are shown as mean ± s.e.m. Scale bars represent 100 μm (b, f). For detailed statistics, see Supplementary Table 5.1
Extended Data Fig. 3
Extended Data Fig. 3. NR cells behavior is similar between Gli1- and Ascl1- derived lineages.
a, Relationship between time to first division and R cell self-renewal duration. Gli1 and Ascl1-targeted R cells are shown as dots in the XY correlation graph (correlation analysis: Spearman r = -0.03, n= 113 XY pairs; p (two-tailed) = 0.744). b, Time until division of R cells (in days) in successive divisions. Div1: first division after the first neurogenic division in the clone. Comparison among consecutive divisions in each mouse line (Gli1 Div1: 8.49 ± 1.29, n = 36 divisions; Gli1 Div2: 6.89 ± 1.95, n = 14 divisions; Gli1 Div3: 7.75 ± 1.49, n = 4 divisions; p = 0.511. Ascl1 Div1: 3.12 ± 0.49, n = 37 divisions; Ascl1 Div2: 3.2 ± 1.28, n = 10 divisions; Ascl1 Div3: 20, n = 1 divisions; p = 0.225. Statistical test used: Kruskal Wallis) and comparison between Gli1 and Ascl1 (Div1: Mann Whitney test: Mann-Whitney U = 302; ***p < 0.0001, two-tailed; Div2: Mann Whitney test: Mann-Whitney U = 34.5; *p = 0.034, two-tailed). c, Heat maps representing the frequencies of division modes of Gli1- and Ascl1- targeted NR cells (division rounds (Div) 1, 3 and 5 counting from the first NR division. Gli1 Div1 n = 91 divisions; Gli1 Div3 n = 65 divisions; Gli1 Div5 n = 11 divisions. Ascl1 Div1 n = 85 divisions; Ascl1 Div3 n = 71 divisions; Ascl1 Div5 n = 18 divisions). R, radial glia-like cell; NR, proliferating progenitor cell; N, neuron; A, astrocyte. Division events contain only certain lineage relations. d, Time (in days) between NR cell divisions (Gli1: 1.38 ± 0.08, n = 460 cells; Ascl1: 1.24 ± 0.08, n = 461 cells; Mann Whitney test: Mann-Whitney U = 100475; p = 0.1207, two-tailed). e, Relative frequency of the NR cells cell fate distribution. The lineage trees are shifted to the first R cell division and NR divisions are pooled according to the time windows in which they take place (Gli1 n in 0-20 days interval: 410, Gli1 n in 20-40 days interval: 78, Gli1 n in 40-70 days interval: 12; Ascl1 n in 0- 20 days interval: 424, Ascl1 n in 20-40 days interval: 74, Ascl1 n in 40-70 days interval: 0). Error bars represent the standard error of the proportion. Division events contain all binary lineage relations (certain and uncertain). Values are shown as mean ± s.e.m. For detailed statistics, see Supplementary Table 5.2
Extended Data Fig. 4
Extended Data Fig. 4. Transcriptional analysis of Gli1- vs Ascl1-targeted cells.
a, Representative FACS plots showing gating for live (Hoechst-) tdTomato+ DG cells sorted for scRNA-seq. b, t-Distributed Stochastic Neighbor Embedding (t-SNE) visualization of the 4 clusters (non-dividing NSCs (ndNSCs), dividing NSCs (dNSCs), Immature Neurons (IN), Mature Neurons (MN)) identified in Gli1- and Ascl1 targeted tdTomato+ neuronal cells. c, Uniform Manifold Approximation and Projection (UMAP) visualization of the seven individual datasets used for analysis. _1 and _2 indicate duplicates for a given data point. d, UMAP visualization of the cell isolated 5 days or 12 weeks after tamoxifen injection. e, Distribution of the cells among the 4 clusters, 5 days or 12 weeks after tamoxifen injection. f, Expression pattern of Ascl1 mRNA. g, Violin plots showing Ascl1 mRNA levels in Gli1- and Ascl1-derived ndNSCs and dNSCs (Wilcoxon text, *p < 0.05). h, Position of Gli1 (red) and Ascl1 (blue) ndNSCs and dNSCs along the pseudotime axis as calculated by Monocle. Cells present along the full pseudotime range (grey rectangle) or sharing the same pseudotime range (green rectangle) are depicted. i-j, Volcano plots showing significantly differentially expressed genes (DEGs) (red, padj < 0.05) between Gli1 or Ascl1-targeted ndNSCs (i) or dNSCs (j) when comparing only cells with shared pseudotime range. Venn diagrams indicate the overlap between DEGs found when comparing Gli1 or Ascl1-targeted ndNSCs (i) or dNSCs (j) using the full pseudotime range (grey circles) or the shared pseudotime range (green circles). Among the top 10 DEGs, bolded gene names highlight the DEGs found in both comparisons. k, UMAP visualization of RNA velocities calculated using scVelo. For detailed statistics, see Supplementary Table 5.3
Extended Data Fig. 5
Extended Data Fig. 5. Stem cell markers associated with quiescence are differentially expressed between Gli1- and Ascl1-targeted NSCs.
a, Representative example of a Gli1- tdTom DG section (5 days post tamoxifen injection) stained with multiple antibodies using the 4i protocol. Visualization of 9 different cellular markers in addition to tdTomato. Single channels are shown. b, Representative images of a Gli1 and an Ascl1 DG section stained using 4i protocol, 5 days post tamoxifen injection. Visualization of six different cellular markers plus tdTomato. (Top) Prox1/blue, tdTom/red, SOX2/green, GFAP/light blue, Id4/magenta. (Middle) tdTom/red, Hopx/green, Mt3/magenta. (Bottom) single channels at higher magnification (regions in the white squares). c, Example of a Gli1-targeted R cell stained using the 4i protocol (5 days post tamoxifen injection). Visualization of 5 different R cell markers in addition to tdTomato and DAPI. Displayed are single channels and a merged picture. d, Percentage of cells that express different NSC and proliferation markers in Gli1- and Ascl1-targeted R cells (Gli1 n = 330 cells; Ascl1 n = 316 cells). e, Quantification of Sox2 (Gli1 = 5.24 ± 0.11 n = 330 cells; Ascl1 = 5.22 ± 0.14, n = 316 cells; Mann Whitney test: Mann-Whitney U = 51100; p = 0.661, two-tailed), Id4 (Gli1 = 2.02 ± 0.03, n = 317 cells; Ascl1 = 1.98 ± 0.03, n = 285 cells; Mann Whitney test: Mann-Whitney U = 44567; p = 0.776, two-tailed) and Ki67 (Gli1 = 3.78 ± 0.36, n = 32 cells; Ascl1 = 4.82 ± 0.28, n = 69 cells; Mann Whitney test: Mann-Whitney U = 760; p = *0.011, two-tailed) protein levels (fluorescence intensity of the cell/background) in Gli1- and Ascl1-targeted R cells. f, Quantification of Hopx protein levels (fluorescence intensity of the cell/background) in Gli1- and Ascl1- targeted R cells that are either positive or negative for Mt3 (Gli1 positive: 7.77 ± 0.20, n = 313 cells; Gli1 negative: 5.47 ± 0.5, n = 24 cells; Whitney test: Mann-Whitney U = 2394; **p = 0.003, two-tailed. Ascl1 positive: 6.46±0.18, n = 284 cells; Ascl1 negative: 3.28 ± 0.32, n = 32 cells; Whitney test: Mann-Whitney U = 1651; ****p < 0.0001, two-tailed. Gli1 positive vs Ascl1 positive: Mann Whitney test: Mann-Whitney U = 35578; ****p < 0.0001, two-tailed. Gli1 negative vs Ascl1 negative: Mann Whitney test: Mann-Whitney U = 182; ***p = 0.0006, two-tailed). Values are shown as mean ± s.e.m. Bars in violin plots represent median and quartiles. Scale bars represent 400 μm (a), 100 μm (b) and 20 μm (c, high magnification and b). For detailed statistics, see Supplementary Table 5.4
Fig. 1
Fig. 1. Gli1-targeted R cells contain long-term self-renewing hippocampal stem cells.
a, Representative confocal images of R (tdTom+/red, SOX2+/green, Nestin+/white; red arrow; white arrowheads indicate major radial R cell process) and NR cells (tdTom+/red, SOX2+/green, Nestin-/white; orange arrow) after recombination with imaging dose. Quantification of tdTom+ cell types in the SGZ 2d after recombination. b, Experimental setup for chronic in vivo imaging of Gli1-tdTom NSCs over up to 100d. Shown is a representative R cell. c, Representative in vivo images of a Gli1-targeted quiescent R cell at 4 and 102 dpi and post hoc immunohistochemical analysis of the same R cell (tdTom+/red, SOX2+/green, GFAP+/white; white arrowhead indicates major radial process) at 102 dpi. The horizontal view of the cell corresponds to the view obtained during in vivo imaging. d, Selected pictures (collapsed z-stacks) of a Gli1-targeted R cell (white arrowhead) and its progeny imaged over the course of 2 months exhibiting long-term self-renewal (51d). Post hoc immunohistochemical analysis of the same clone (tdTom+/red) at 61dpi. e, Lineage tree deduced from tracking the R cell in D. Identified cell types are color-coded, and lineage transitions are depicted depending on their certainty (see methods). f, Example of a Gli1-targeted R cell clone showing long R cell persistence. Post hoc immunohistochemical analysis of the same clone (tdTom+/red, SOX2+/green, GFAP+/white) at 102dpi shows the presence of a R cell (white arrowhead, GFAP+/SOX2+), a NR cell (GFAP-/SOX2+) and a neuron (GFAP-/SOX2-). g, Lineage tree deduced from tracking the R cell in F and its progeny. h, Percentage of active and quiescent clones in Gli1 and Ascl1-targeted cells (total Gli1: 136; Gli1 active: 41.1%; Gli1 quiescent: 58.8 %; total Ascl1: 80; Ascl1 active: 71.2 %; Ascl1 quiescent: 28.75 %. Ascl1 cell data consist of 19 new lineages and 61 previously described lineages (see Methods). i, Time until the first division (in days) of Gli1 and Ascl1 R cells calculated from the start of the imaging 2dpi (Gli1: 24.98 ± 2.8, n = 56 R cells; Ascl1: 11.85 ± 1.5, n = 57 R cells; Mann Whitney test: Mann-Whitney U = 1055; **p = 0.0017, two-tailed). j, Final number of cells per active clone (Gli1: 5.03 ± 0.57, n = 56 clones; Ascl1: 5.86 ± 0.64, n = 57 clones; Mann Whitney test: Mann-Whitney U = 1440; p = 0.3699, two-tailed). Circles represent individual clones. Values are shown as mean ± s.e.m. Scale bars represent 10 μm (a, c, staining f), 20 μm (staining d), 25 μm (f), 50 μm (d). For detailed statistics, see Supplementary Table 5.1
Fig. 2
Fig. 2. Diverse behavioral features of Gli1- and Ascl1-targeted NSCs.
a, Self-renewal duration (time in days between first and last division in each lineage) of Gli1 and Ascl1- targeted R cells (Gli1: 17.80 ± 2.5, n = 56 clones; Ascl1: 6.5 ± 0.9, n = 57 clones; Mann Whitney test: Mann-Whitney U = 931; ****p < 0.0001, two-tailed). Triangles depict clones where R cell was still present at the end of the imaging (reported only for the clones with observed self-renewal duration ≥ 28d). The described self-renewal duration of these clones is an underestimation of their actual capacity. Red dots depict R cells showing long-term self-renewal. The dashed line represents a long-term self-renewal threshold (30d). b, Fraction of clones with different R content (0R, 1R, 2R, 3R cells) over time, normalised to the surviving population. All (certain, semi-certain and uncertain) R cells are considered. Lineage trees shifted to the first R cell division time point. c, Percentage of clones with R cell self-renewal ≥30d (Gli1: 19.64%; n = 56 clones; Ascl1: 0%; n = 57 clones). Only R cells that were classified as certain are considered. d, Average clone content for Gli1 and Ascl1 lineages over time. R, radial glia like cell; NR, proliferating progenitor; N, neuron. e, Average time (in days) between R cell divisions (Gli1: 10.71 ± 2.4, n = 37 clones; Ascl1: 3.64 ± 0.5, n = 41 clones; Mann Whitney test: Mann-Whitney U = 337.5; ****p < 0.0001, two-tailed). f, Number of successive R cell divisions in Gli1 and Ascl1 lineages (Gli1; 1.div: 33.93%, 2.div: 35.71%, 3.div: 19.64%, 4.div: 10.71%, n = 56 clones; Ascl1 1.div: 28.07%, 2.div: 50.88%, 3 div: 19.30%, 4 div: 1.75%, n = 57 clones). g, Percentage of asymmetric proliferative R divisions (R mother cell generates one R daughter cell and one NR daughter cell) in division rounds (div) 1 to 4 (Gli1 div 1: 77.78%; n = 27 divisions; Gli1 div 2: 47.37%; n = 19 divisions; Gli1 div 3: 54.55%; n = 11 divisions; Gli1 div 4: 25.0%; n = 4 divisions. Ascl1 div 1: 77.5%; n = 40 divisions; Ascl1 div 2: 31.03%; n = 29 divisions; Ascl1 div 3: 12.5%; n = 8 divisions). h, Percentage of symmetric duplicating R cell divisions in the first division (Gli1 = 18.52%, n = 27 divisions; Ascl1 = 7.50%, n = 40 divisions). i, Heat map representing the frequencies of modes of division of Gli1- targeted R cells (division rounds (Div) 1 to 4. Div1 n = 27 divisions; Div2 n = 19 divisions; Div3 n = 11 divisions; Div4 n = 4 divisions) and Ascl1- targeted R cells (division rounds (Div) 1 to 3. Div1 n = 40 divisions; Div2 n = 29 divisions; Div3 n = 8 divisions). R, radial glia-like cell; NR, proliferating progenitor; N, neuron; A, astrocyte. j, Lineage tree clustering using the Ward’s Hierarchical Clustering Method, Euclidean distances. Listed are the different parameters used. Gli1 lineages are contained in Cluster1 (45.4%) and Cluster2 (54.6%). Ascl1 lineages fall in Cluster1 (7.0%) and Cluster2 (93.0%). Cluster1 consists of 86.2% Gli1 lineages and 13.8% Ascl1 lineages. Cluster2 consists of 36.1% Gli1 derived lineages and 63.9% Ascl1 derived lineages. Circles represent individual clones. Values are shown as mean ± s.e.m. For detailed statistics, see Supplementary Table 5.2
Fig. 3
Fig. 3. scRNA-seq of Gli1- and Ascl1-targeted cells identifies NSCs with self-renewal potential.
a, Overview of the experimental approach. b, Uniform Manifold Approximation and Projection (UMAP) visualization of the 4 clusters (non-dividing NSCs (ndNSCs), dividing NSCs (dNSCs), Immature Neurons (IN), Mature Neurons (MN)) identified in Gli1- and Ascl1 targeted tdTomato+ neuronal cells. c, Expression pattern of two cluster-specific genes (top and bottom) for ndNSCs (far left), dNSCs (left), IN (right), MN (far right). d, Gli1- and Ascl1-targeted tdTomato+ cells isolated 5 days (Gli1_5d, Ascl1_5d) or 12 weeks (Gli1_12wk, Ascl1_12wk) after the last tamoxifen injection displayed on the UMAP plot from panel (b). e, Lineage inference using Slingshot. f, Percentages of ndNSCs, dNSCs, IN, MN among all Gli1- or Ascl1- targeted cells. g, Position of Gli1 (red) and Ascl1 (blue) ndNSCs and dNSCs along the pseudotime axis as calculated by Monocle. Unpaired t-test, ndNSCs p = 2.55e-06, dNSCs p = 0.0004042, *p < 0.05. h-i, Volcano plots showing significantly differentially expressed genes (DEGs) (red, padj < 0.05) between Gli1 or Ascl1-targeted ndNSCs (h) or dNSCs (i). Bolded gene names highlight DEGs found in both ndNSCs (h) and dNSCs (i) comparisons. j, Violin plots showing the top 3 common DEGs. For detailed statistics, see Supplementary Table 5.3
Fig. 4
Fig. 4. Molecular profiling reveals distinct features of Gli1- vs. Ascl1-targeted NSCs.
a, The observed and the extrapolated future states (arrows) of Gli1 (red) or Ascl1 (blue) cells was calculated using RNA velocity. The velocities are visualized on the UMAP plot from panel (Fig. 3b). Velocity estimates based on nearest-cell pooling (k=300) were used. b, Percentages of dNSCs Gli1 (red) or Ascl1 (blue) with a velocity vector directed towards ndNSCs (yellow quadrants, vector angles between 180° and 380°). c, Volcano plot showing significantly DEGs (red, padj < 0.05) between dNSCs displaying an RNA velocity vector directed towards ndNSCs (yellow quadrants, vector angles between 180° and 380°), or towards IN (green quadrants, vector angles between >0° and <180°). Bolded gene names highlight common DEG with volcano plots (Fig. 3h) and (Fig. 3i). d, Top: representative examples of Gli1 and Ascl1 R cells stained using 4i protocol, 5 days post tamoxifen injection. Visualization of single channels: tdTom/red, Hopx/green, Mt3/magenta. Bottom: quantification of Hopx (Gli1 = 7.62 ± 0.197, n = 337 cells; Ascl1 = 6.14 ± 0.177, n = 316 cells; Unpaired t-test: t = 5.532; df = 651; ***p < 0.0001, two-tailed) and Mt3 (Gli1 = 2.72 ± 0.064, n = 337 cells; Ascl1 = 2.34 ± 0.065, n = 318 cells; Unpaired t-test: t = 4.201; df = 653; ***p < 0.0001, two-tailed) protein levels (fluorescence intensity of the cell/background) in Gli1- and Ascl1- targeted R cells. e, Schematic of machine learning approach. ndNSCs and dNSCs from Gli1- and Ascl1- targeted cells were divided into a training and a testing set (1:1). The 9 DEGs found in both ndNSCs (Fig. 3h) and dNSCs (Fig. 3i) comparisons were used to build three different machine learning models for classification: Random Forest Classifier (RFC), k Nearest Neighbor (k-NN) and Generalized Linear Models (GLM). The genotype (Gli1 or Ascl1) of ndNSCs and dNSCs was than predicted using the three classification models. f, Numbers and prediction accuracy rates to classify Gli1- vs. Ascl1-targeted cells using RFC, k-NN and GLM models together. Shades of red represent the accuracy of the prediction. g, Schematic showing the differential behavior of the two NSC populations in the DG: the first one gives rise to a burst of neurogenic activity followed by the depletion of the NSC. The second one is able to perform long-term self-renewal contributing to stem cell niche maintenance. Values are reported as mean ± s.e.m. Bars in violin plots represent median and quartiles. Scale bars represent 20 μm (d). For detailed statistics, see Supplementary Table 5.4

References

    1. Gage FH. Science. Vol. 364. New York, N.Y: 2019. Adult neurogenesis in mammals; pp. 827–828. - PubMed
    1. Sorrells SF, et al. Human hippocampal neurogenesis drops sharply in children to undetectable levels in adults. Nature. 2018 - PMC - PubMed
    1. Goncalves JT, Schafer ST, Gage FH. Adult Neurogenesis in the Hippocampus: From Stem Cells to Behavior. Cell. 2016;167:897–914. - PubMed
    1. Eriksson PS, et al. Neurogenesis in the adult human hippocampus. Nat Med. 1998;4:1313–1317. - PubMed
    1. Knoth R, et al. Murine features of neurogenesis in the human hippocampus across the lifespan from 0 to 100 years. PLoS ONE. 2010;5:e8809. - PMC - PubMed

Publication types

MeSH terms