

Causal inference in high dimensions: A marriage between Bayesian modeling and good frequentist properties
- PMID: 33349923
- PMCID: PMC8209114
- DOI: 10.1111/biom.13417
Causal inference in high dimensions: A marriage between Bayesian modeling and good frequentist properties
Abstract
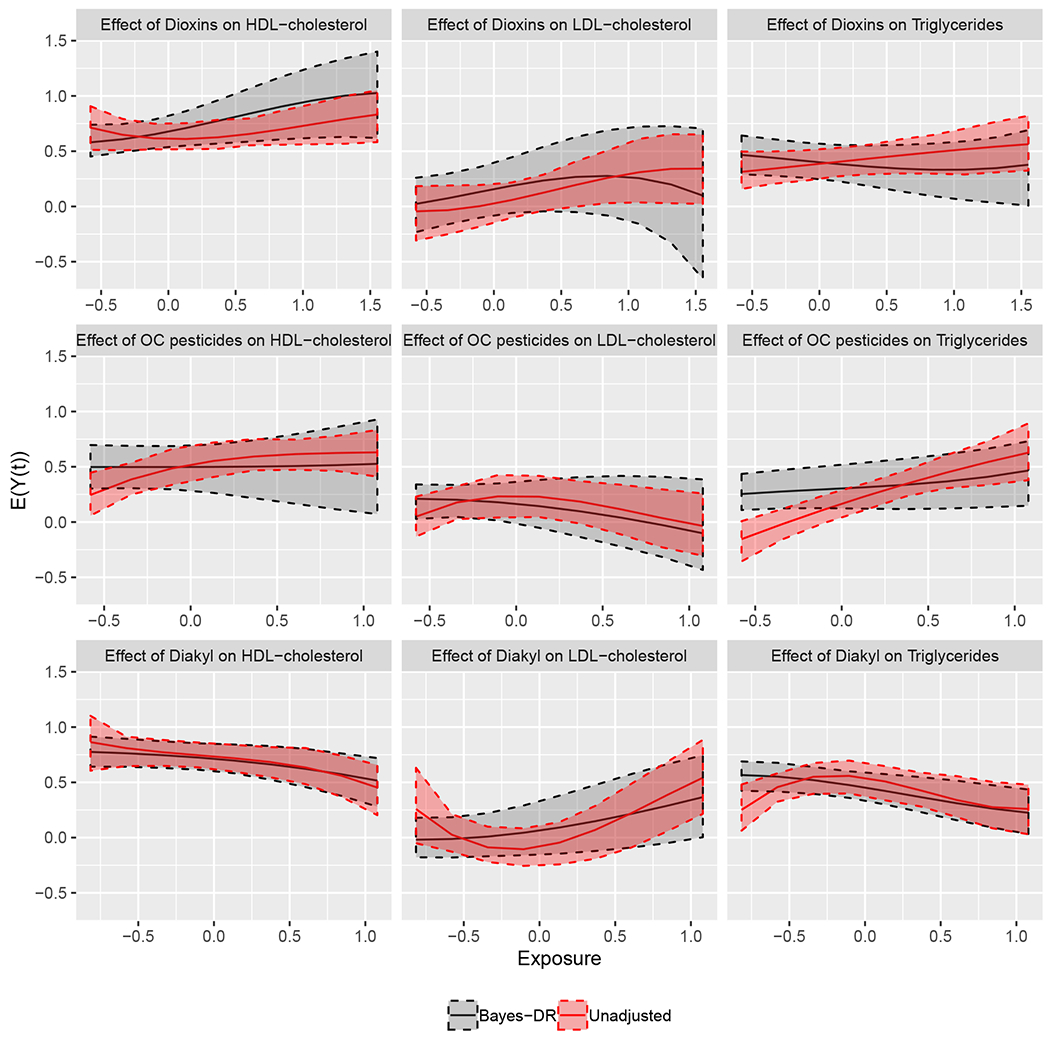
We introduce a framework for estimating causal effects of binary and continuous treatments in high dimensions. We show how posterior distributions of treatment and outcome models can be used together with doubly robust estimators. We propose an approach to uncertainty quantification for the doubly robust estimator, which utilizes posterior distributions of model parameters and (1) results in good frequentist properties in small samples, (2) is based on a single run of a Markov chain Monte Carlo (MCMC) algorithm, and (3) improves over frequentist measures of uncertainty which rely on asymptotic properties. We consider a flexible framework for modeling the treatment and outcome processes within the Bayesian paradigm that reduces model dependence, accommodates nonlinearity, and achieves dimension reduction of the covariate space. We illustrate the ability of the proposed approach to flexibly estimate causal effects in high dimensions and appropriately quantify uncertainty. We show that our proposed variance estimation strategy is consistent when both models are correctly specified, and we see empirically that it performs well in finite samples and under model misspecification. Finally, we estimate the effect of continuous environmental exposures on cholesterol and triglyceride levels.
Keywords: Bayesian modeling; causal inference; doubly robust estimation; environmental exposures; high-dimensional data; model selection; variable selection.
© 2020 The International Biometric Society.
Figures


References
-
- Athey S, Imbens GW, and Wager S (2018). Approximate residual balancing: debiased inference of average treatment effects in high dimensions. Journal of the Royal Statistical Society: Series B (Statistical Methodology) 80, 597–623.
-
- Avagyan V and Vansteelandt S (2020). High-dimensional inference for the average treatment effect under model misspecification using penalised bias-reduced double-robust estimation. Biostatistics and Epidemiology, forthcoming .
-
- Bang H and Robins JM (2005). Doubly robust estimation in missing data and causal inference models. Biometrics 61, 962–973. - PubMed
Publication types
MeSH terms
Grants and funding
- R35 CA197449/CA/NCI NIH HHS/United States
- R01 ES028033/ES/NIEHS NIH HHS/United States
- U19 CA203654/CA/NCI NIH HHS/United States
- T32 ES007142/ES/NIEHS NIH HHS/United States
- P30 ES000002/ES/NIEHS NIH HHS/United States
- T32 MH125815/MH/NIMH NIH HHS/United States
- DP2 MD012722/MD/NIMHD NIH HHS/United States
- R01 MH118927/MH/NIMH NIH HHS/United States
- P50 MD010428/MD/NIMHD NIH HHS/United States
- R01 GM111339/GM/NIGMS NIH HHS/United States
- R01 ES026217/ES/NIEHS NIH HHS/United States
- P01 CA134294/CA/NCI NIH HHS/United States
- R01 ES024332/ES/NIEHS NIH HHS/United States
LinkOut - more resources
Full Text Sources
