. 2020 Dec 22:9:e62850.
doi: 10.7554/eLife.62850.

Individual differences in honey bee behavior enabled by plasticity in brain gene regulatory networks

Affiliations

Individual differences in honey bee behavior enabled by plasticity in brain gene regulatory networks

Beryl M Jones et al. Elife. .

Abstract

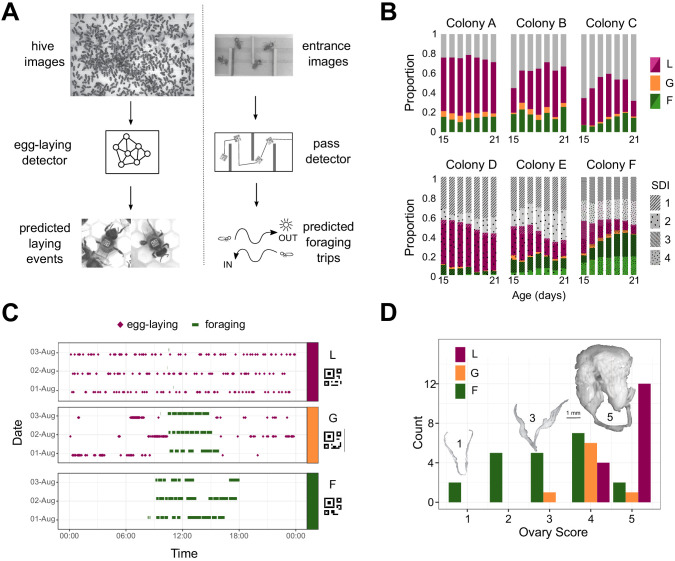
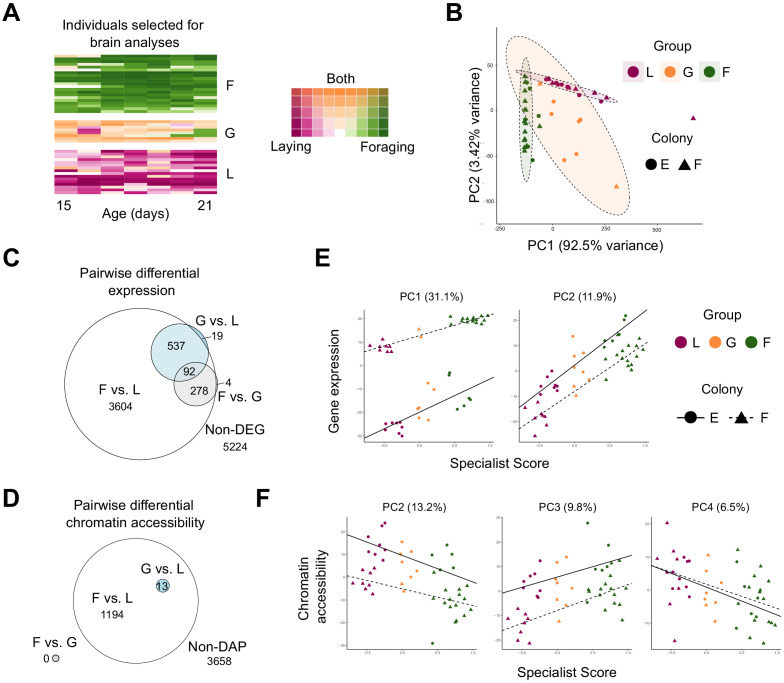
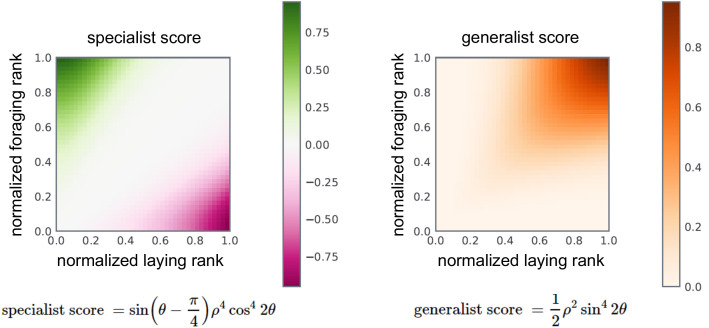
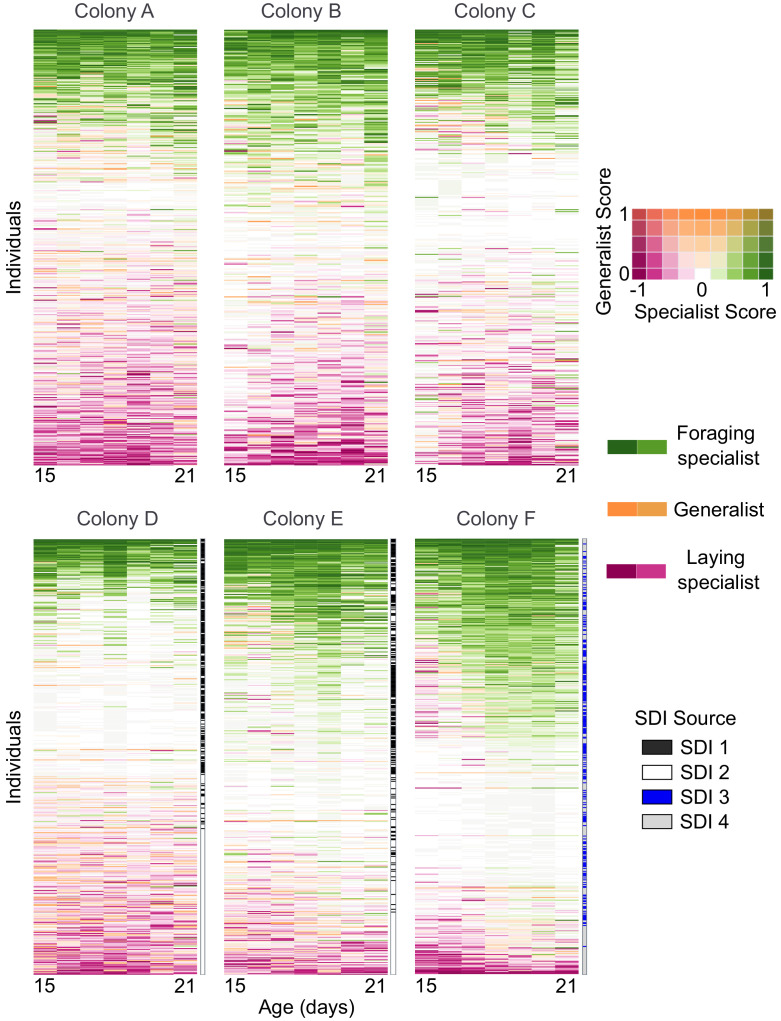
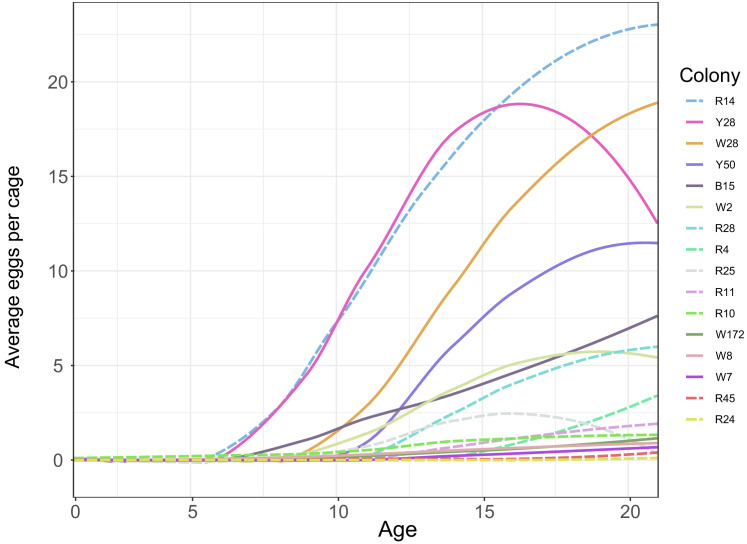
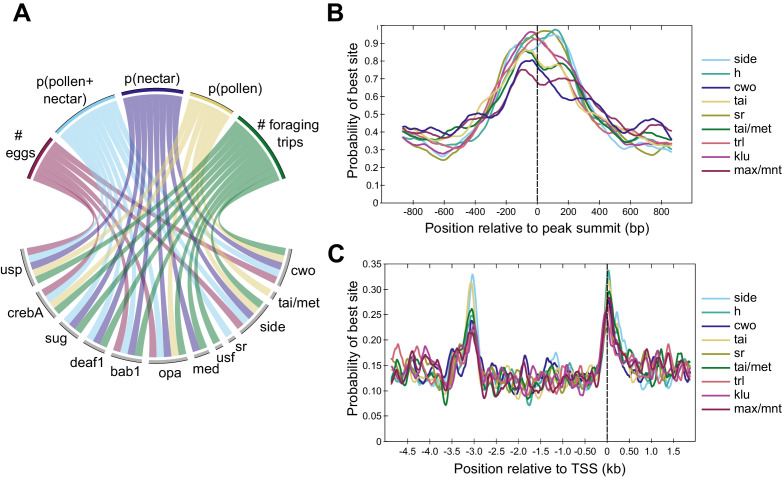
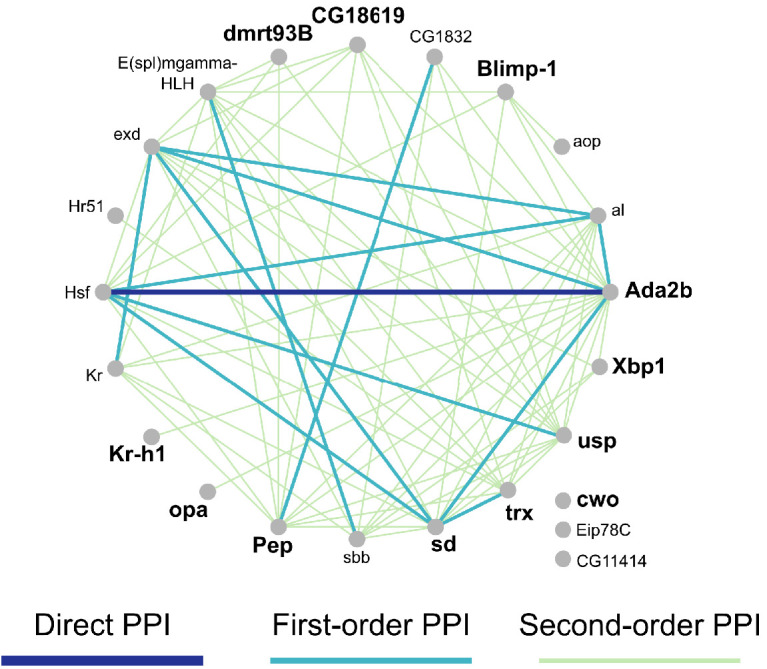
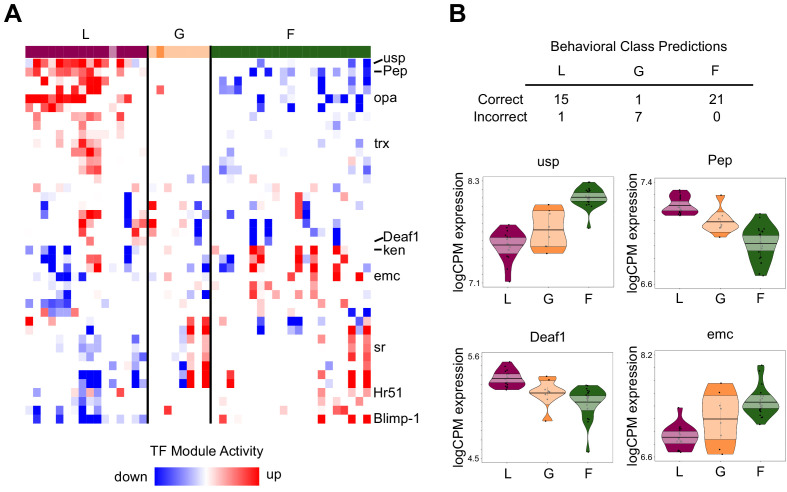
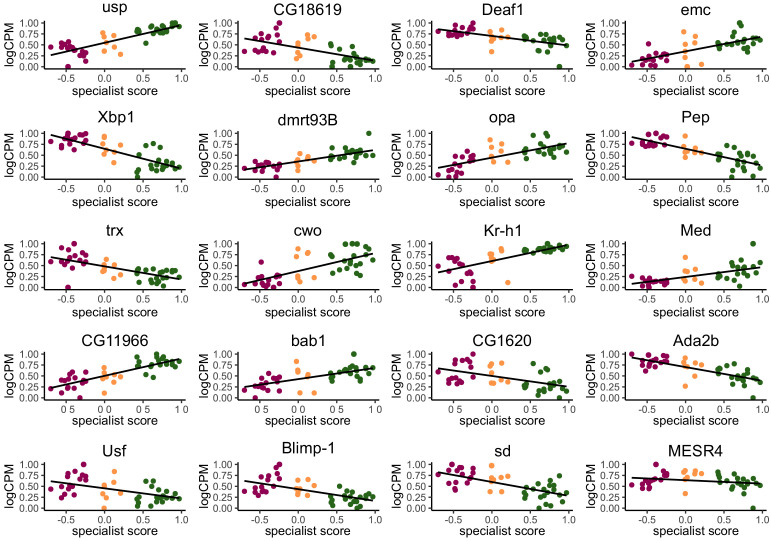
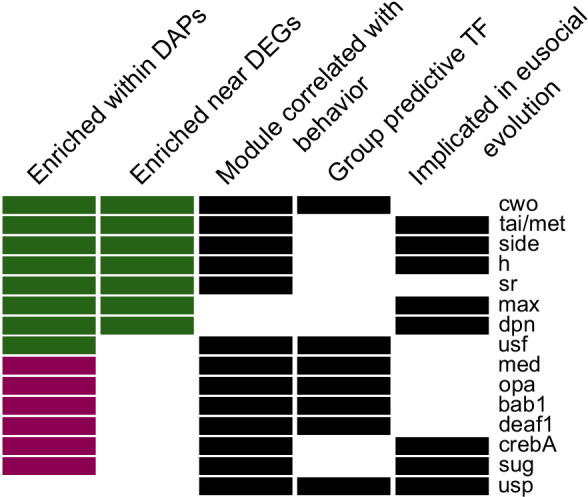
Understanding the regulatory architecture of phenotypic variation is a fundamental goal in biology, but connections between gene regulatory network (GRN) activity and individual differences in behavior are poorly understood. We characterized the molecular basis of behavioral plasticity in queenless honey bee (Apis mellifera) colonies, where individuals engage in both reproductive and non-reproductive behaviors. Using high-throughput behavioral tracking, we discovered these colonies contain a continuum of phenotypes, with some individuals specialized for either egg-laying or foraging and 'generalists' that perform both. Brain gene expression and chromatin accessibility profiles were correlated with behavioral variation, with generalists intermediate in behavior and molecular profiles. Models of brain GRNs constructed for individuals revealed that transcription factor (TF) activity was highly predictive of behavior, and behavior-associated regulatory regions had more TF motifs. These results provide new insights into the important role played by brain GRN plasticity in the regulation of behavior, with implications for social evolution.

Keywords: Apis mellifera; behavioral plasticity; ecology; gene regulation; genetics; genomics.


Conflict of interest statement

BJ, VR, TG, TJ, AC, BR, TC, SB, SH, CB, MM, SS, SC, GR No competing interests declared

Figures

Figure 1.
Figure 1.. Automated monitoring of behavior in queenless colonies of laying worker honey bees.
(A) Automatic behavior monitoring was performed inside the hive and at the hive entrance to predict egg-laying and foraging events in six colonies (N = 800 bees per colony at the start of each trial). Hive images were captured 1/s for 24 h/day, and entrance images 2/s for 12 h/day beginning when adult bees were 15 days old. (B) Proportion of bees alive each day categorized as layers (purple), foragers (green), generalists (orange), or others (gray). For colonies A-C, individuals were from single source colonies headed by a naturally mated queen. For colonies D-F, individuals from two source colonies headed by queens each inseminated by semen from a single different drone (single drone inseminated, SDI) were mixed. Different source colonies are indicated by pattern and hue. (C) Ethograms for three individuals selected for sequencing (bCodes shown below group labels) across three days of tracking. (D) Distribution of ovary scores for individuals selected for sequencing. Insets are images from bees with ovary scores of 1, 3, and 5. L: layer, G: generalist, F: forager.
Figure 2.
Figure 2.. Patterns of brain gene expression and chromatin accessibility are associated with behavior.
(A) Daily rank-normalized behavior of individuals (rows) selected for brain RNAseq and ATACseq analysis converted to 2D colorspace from specialist and generalist scores. (B) Principal Component Analysis (PCA) of behavioral variation for individuals chosen for brain RNAseq and ATACseq analysis. Metrics included number of eggs laid, number of foraging events, proportion of foraging trips with evidence of nectar collection, proportion of trips with evidence of pollen collection, and proportion of trips with evidence of both nectar and pollen collection. (C) Euler diagram for overlaps of pairwise differentially expressed genes (DEGs) between behavioral groups. Note that one gene was overlapping between F vs. G and G vs. L (but not F vs. L) and is not represented in the diagram due to graphical constraints. (D) Euler diagram for overlaps of genes proximal to pairwise differentially accessible chromatin peaks (DAPs) between behavioral groups. (E) PCs from PCA of brain transcriptomic profiles regressed against specialist score (PC1: R2 = 0.947, p<0.0001; PC2: R2 = 0.838, p<0.001). (F) PCs from PCA of brain chromatin accessibility regressed against specialist score (PC2: R2 = 0.584, p<0.001; PC3: R2 = 0.543, p<0.0001; PC4: R2 = 0.187, p<0.0045; PC1: p>0.05). L: layer, G: generalist, F: forager.
Figure 2—figure supplement 1.
Figure 2—figure supplement 1.. Formulae and color-space mapping for specialist (left) and generalist (right) behavioral scores.
Figure 2—figure supplement 2.
Figure 2—figure supplement 2.. Daily behaviors of individual bees (rows) across time in each colony.
Colored rectangles indicate specialist and generalist scores represented in 2D color space as shown in legend. Individuals are sorted by median lifetime specialist score. Single-drone inseminated (SDI) queen source is shown to the right of each row for colonies D-F, where workers were known offspring of two SDI queens per colony. In colonies A-C workers were offspring of naturally mated queens.
Figure 2—figure supplement 3.
Figure 2—figure supplement 3.. Smoothed average egg counts for laying workers in laboratory cages.
Solid lines indicate bees from source colonies headed by a naturally-mated queen, while dashed lines indicate bees from source colonies headed by queens instrumentally inseminated with semen from a single drone (SDI). Colonies used as sources for behavioral tracking included W28, W2, R25, and R45.
Figure 2—figure supplement 4.
Figure 2—figure supplement 4.. Histogram (bars) and density (lines) of normalized (logCPM) gene expression for genes with (dark gray) and without (light gray) nearby peaks of chromatin accessibility.
Distributions are significantly different (p<0.0001, Kolmogorov-Smirnov test).
Figure 3.
Figure 3.. Differences in TF activity and TF motif occurrence are associated with specific behavioral phenotypes.
(A) Circos plot representing a subset of significant correlations between behaviors (top) and expression of TF modules (bottom). Lines connecting behaviors with TF modules indicate significant associations. TF modules included are those mentioned in the main text or in other figures, and five of nine traits are included for simplicity. All significant correlations between behaviors and TF modules are given in Supplementary file 8. For behaviors, p indicates proportion (e.g. p(pollen) is the proportion of returning foraging trips where the bee carried pollen). (B) Motifs enriched within DAPs show maximum binding probabilities near peak summits. (C) Motifs enriched in promoter regions of forager >layer DEGs show elevated binding probabilities ~ 3 kb upstream of and overlapping TSSs. Motif names and sequences are from FlyFactor (Zhu et al., 2011) for Drosophila melanogaster.
Figure 3—figure supplement 1.
Figure 3—figure supplement 1.. Network of 23 TFs with module expression significantly correlated with nine behavioral and physiological metrics (see Supplementary file 2) measured across individuals.
Edges indicate known interactions based on MIST database for Drosophila melanogaster. First-order PPI indicates one intermediate protein between linked nodes, while second-order PPI indicates two intermediate proteins. PPI = protein protein interaction.
Figure 4.
Figure 4.. TF module activity and TF expression predict individual variation in behavior.
(A) TF modules (rows) with significant up/downregulation in at least 10 individuals, sorted by hierarchical clustering. Individuals (columns) are ordered by specialist score, with darkly colored blocks indicating correctly classified individuals based on TF expression prediction analysis and lightly colored blocks indicating incorrect classification. TF modules showed patterns of differentiation between L and F, while G were more variable in module activity. Labeled modules are those with TFs shown in panel (B) or discussed in text. (B) Class prediction analysis based on brain TF expression correctly classified all but one specialist (L: layer, F: forager) but only one generalist (G). Normalized expression (logCPM) of 4 of the top 20 informative TFs for class prediction analysis are shown (others in Figure 4—figure supplement 1). Median of points is represented by bold horizontal line within shaded 95% confidence interval, with length of shape and smoothed curve showing range and density of data, respectively.
Figure 4—figure supplement 1.
Figure 4—figure supplement 1.. Normalized expression (logCPM, scaled to a maximum of 1 to allow for comparison across TFs) of the top 20 most informative TFs for class prediction analysis plotted against individual specialist score.
Points are colored by behavioral group (Layer: purple, Generalist: orange, Forager: green). Although some of the top predictors individually show weak correlation with specialist score, the random forest machine-learning algorithm combined multiple weak predictors together in a single model to accurately classify the three behavioral groups, suggesting the TFs act combinatorially to influence behavior.
Figure 5.
Figure 5.. Fifteen candidate TFs predicted to regulate egg-laying and foraging behavior based on evidence across all analyses (descriptions of categories in Materials and methods).
Names given are for Drosophila melanogaster motifs (Zhu et al., 2011), with homology to honey bee genes as in Kapheim et al., 2015. Color of bar in first two columns indicates whether there was stronger enrichment among forager-biased (green) or layer-biased (purple) peaks or genes.

References

    1. Abadi M, Barham P, Chen J, Chen Z, Davis A, Dean J, Devin M, Ghemawat S, Irving G, Isard M, Kudlur M, Levenberg J, Monga R, Moore S, Murray DG, Steiner B, Tucker P, Vasudevan V, Warden P, Wicke M, Yu Y, Zheng X, Brain G, Osdi I, Barham P, Chen J, Chen Z, Davis A, Dean J, Devin M, Ghemawat S, Irving G, Isard M, Kudlur M, Levenberg J, Monga R, Moore S, Murray DG, Steiner B, Tucker P, Vasudevan V, Warden P, Wicke M, Yu Y, Zheng X. TensorFlow : a system for large-scale machine learning. OSDI. 2016;16:265–283. doi: 10.1126/science.aab4113.4. - DOI
    1. Adams J, Rothman ED, Kerr WE, Paulino ZL. Estimation of the number of sex alleles and queen matings from diploid male frequencies in a population of Apis mellifera. Genetics. 1977;86:583–596. - PMC - PubMed
    1. Alaux C, Le Conte Y, Adams HA, Rodriguez-Zas S, Grozinger CM, Sinha S, Robinson GE. Regulation of brain gene expression in honey bees by brood pheromone. Genes, Brain and Behavior. 2009;8:309–319. doi: 10.1111/j.1601-183X.2009.00480.x. - DOI - PubMed
    1. Ament SA, Wang Y, Chen CC, Blatti CA, Hong F, Liang ZS, Negre N, White KP, Rodriguez-Zas SL, Mizzen CA, Sinha S, Zhong S, Robinson GE. The transcription factor ultraspiracle influences honey bee social behavior and behavior-related gene expression. PLOS Genetics. 2012;8:e1002596. doi: 10.1371/journal.pgen.1002596. - DOI - PMC - PubMed
    1. Araya CL, Kawli T, Kundaje A, Jiang L, Wu B, Vafeados D, Terrell R, Weissdepp P, Gevirtzman L, Mace D, Niu W, Boyle AP, Xie D, Ma L, Murray JI, Reinke V, Waterston RH, Snyder M. Regulatory analysis of the C. elegans genome with spatiotemporal resolution. Nature. 2014;512:400–405. doi: 10.1038/nature13497. - DOI - PMC - PubMed

Publication types

Substances