

ANKRD26 recruits PIDD1 to centriolar distal appendages to activate the PIDDosome following centrosome amplification
- PMID: 33350495
- PMCID: PMC7883295
- DOI: 10.15252/embj.2020105106
ANKRD26 recruits PIDD1 to centriolar distal appendages to activate the PIDDosome following centrosome amplification
Abstract
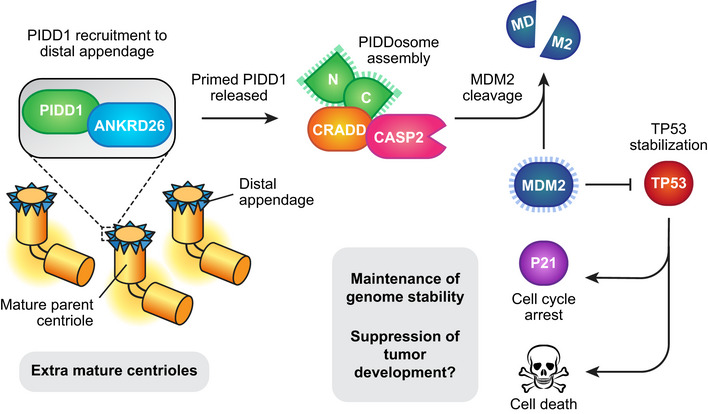
Centriole copy number is tightly maintained by the once-per-cycle duplication of these organelles. Centrioles constitute the core of centrosomes, which organize the microtubule cytoskeleton and form the poles of the mitotic spindle. Centrosome amplification is frequently observed in tumors, where it promotes aneuploidy and contributes to invasive phenotypes. In non-transformed cells, centrosome amplification triggers PIDDosome activation as a protective response to inhibit cell proliferation, but how extra centrosomes activate the PIDDosome remains unclear. Using a genome-wide screen, we identify centriole distal appendages as critical for PIDDosome activation in cells with extra centrosomes. The distal appendage protein ANKRD26 is found to interact with and recruit the PIDDosome component PIDD1 to centriole distal appendages, and this interaction is required for PIDDosome activation following centrosome amplification. Furthermore, a recurrent ANKRD26 mutation found in human tumors disrupts PIDD1 localization and PIDDosome activation in cells with extra centrosomes. Our data support a model in which ANKRD26 initiates a centriole-derived signal to limit cell proliferation in response to centrosome amplification.
Keywords: ANKRD26; PIDDosome; centriole; centriole amplification.
© 2020 The Authors.
Conflict of interest statement
The authors that they have no conflict of interest.
Figures
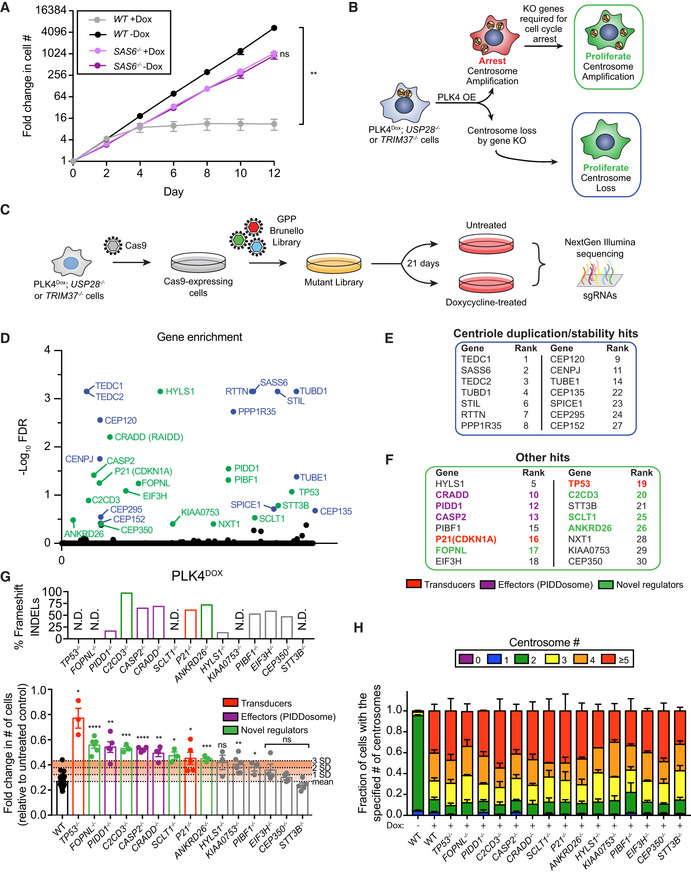
Growth assay of the indicated cells with and with out doxycycline‐inducible overexpression of PLK4. Experiments were performed in wild‐type or SAS6 monoclonal knockout cells. Data acquired across n = 3 biological replicates. Mean ± s.e.m.
Schematic overview of the screen design.
Schematic showing the procedure for a CRISPR/Cas9‐positive selection screen to identify gene knockouts that increase the proliferation of cells with extra centrosomes.
Top hits that emerged from the screens ranked by MaGeCK FDR value. Blue hits are genes required for centriole duplication or stability. Green hits are genes predicted to be required to arrest the growth of cells with extra centrosomes.
Hits with a known role in centriole duplication or stability.
Candidate hits responsible for arresting the proliferation of cells with centrosome amplification. Purple hits correspond to PIDDosome genes. Red hits correspond to downstream effectors. Green hits are novel regulators.
Top: Graph showing the efficiency of frameshifting INDELs measured using TIDE. N.D. = Not determined. Data shown are from n = 1 biological replicate. Bottom: Graph showing the relative growth of doxycycline‐treated PLK4Dox cells expressing an sgRNA targeting the indicated genes. Each dot displays measurements from a single experiment. Experiments were performed in polyclonal knockout cells. Data acquired across n ≥ 3 biological replicates. Mean ± s.e.m.
Quantification of centrosome number in PLK4Dox cells expressing an sgRNA targeting the indicated genes. Experiments were performed in polyclonal knockout cells. Data acquired across n ≥ 3 biological replicates. Mean ± s.e.m.
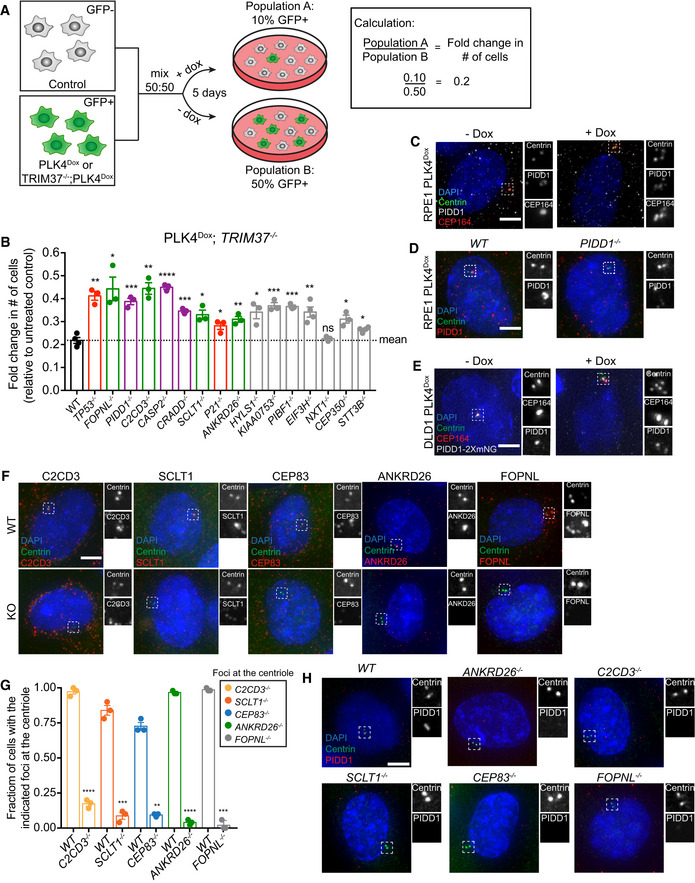
Schematic outlining the competition growth assay used to measure fold change in the number of GFP+ cells treated with doxycycline compared to control, untreated GFP− cells.
Graph showing the relative growth of doxycycline‐treated PLK4Dox; TRIM37 −/− cells expressing an sgRNA targeting the indicated genes. Each dot displays measurements from a single experiment. Experiments were performed in polyclonal knockout cells. Data acquired across n ≥ 3 biological replicates. Mean ± s.e.m.
Representative images of PLK4Dox RPE1 cells treated with and without doxycycline for two days and immunostained with the indicated antibodies. Scale bar = 5 µm.
Representative images of wild‐type and PIDD1 −/− PLK4Dox RPE1 cells treated with and without doxycycline for two days and immunostained with the indicated antibodies. Scale bar = 5 µm.
Representative images of PLK4Dox PIDD1‐mNeonGreen DLD1 cells treated with and without doxycycline for 2 days and immunostained with the indicated antibodies. Scale bar = 5 µm.
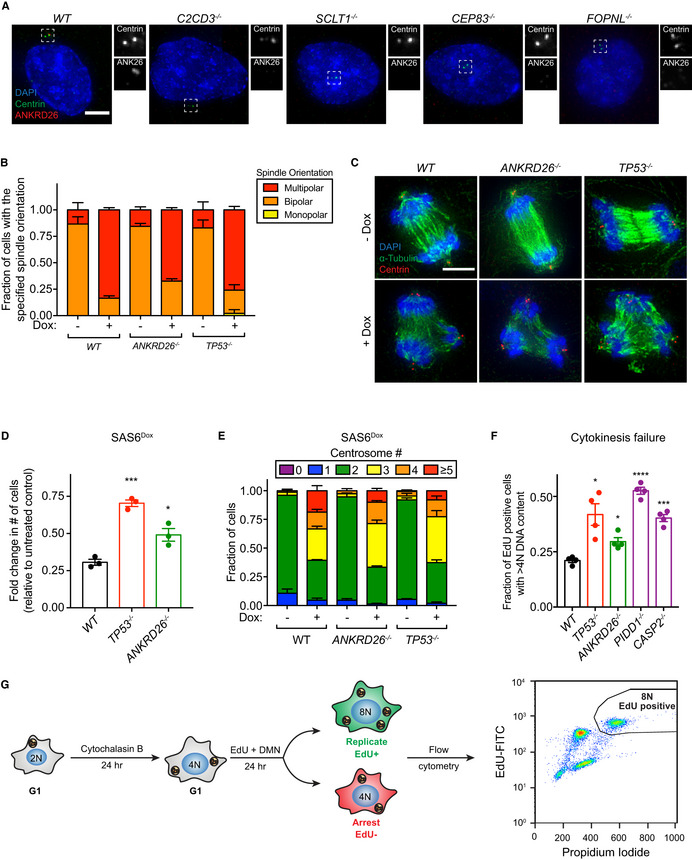
Representative images of WT or knockout PLK4Dox cells immunostained with the indicated antibodies. Experiments were performed in PLK4Dox monoclonal knockout cells. Scale bar = 5 µm.
Quantification of the fraction of cells with the indicated protein localized at the centriole. Experiments were performed in PLK4Dox monoclonal knockout cells. Data acquired across n = 3 biological replicates. Mean ± s.e.m.
Representative images of WT or knockout PLK4Dox cells immunostained with the indicated antibodies. Experiments were performed in PLK4Dox monoclonal knockout cells. Scale bar = 5 µm.
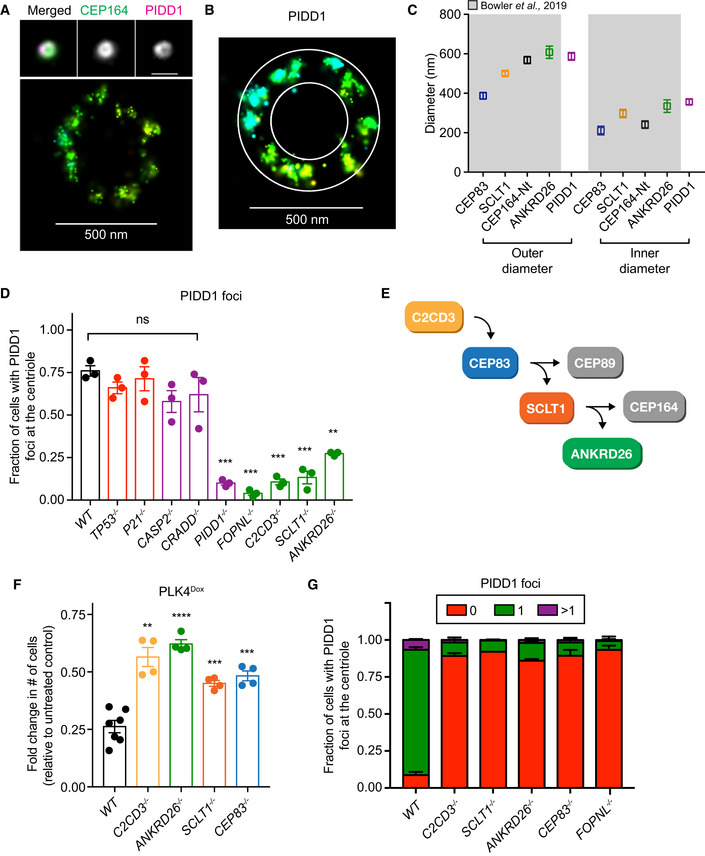
Top, wide‐field image showing the localization of CEP164 and PIDD1 at the mature mother centriole. Bottom: Representative 3D STORM image of the same centriole showing PIDD1 localization. STORM image colors correspond to the Z‐depth with red being the closest to the coverslip and blue being the most distant.
3D STORM image of PIDD1 at the mature mother centriole. The overlaid mask represents the inner and outer diameters of the PIDD1 signal.
Inner and outer diameter measurements for distal appendage proteins and PIDD1. Measurements in the shaded region were previously reported in Bowler et al (2019). Data displayed as box and whisker plots, where the box represents the upper and lower quartile and the whiskers represent the s.d. Scale bars: 1 μm for all wide‐field images of centrioles and 500 nm for STORM images. Data acquired across n ≥ 6 cells.
Quantification of the fraction of cells with PIDD1 localized to the mature mother centriole in PLK4Dox cells expressing an sgRNA targeting the indicated genes. A dot displays measurements from each experiment. Experiments were performed in PLK4Dox polyclonal knockout cells. Data acquired across n = 3 biological replicates. Mean ± s.e.m.
Schematic depicting the hierarchy of recruitment of distal appendage proteins.
Graph showing the relative growth of doxycycline‐treated PLK4Dox cells that were knocked out for the indicated genes. Each dot displays measurements from a single experiment. Experiments were performed in PLK4Dox monoclonal knockout cells. Data acquired across n ≥ 3 biological replicates. Mean ± s.e.m.
Quantification of the fraction of cells with PIDD1 localized at the mature mother centriole. Experiments were performed in PLK4Dox monoclonal knockout cells. Data acquired across n = 3 biological replicates. Mean ± s.e.m.
- A
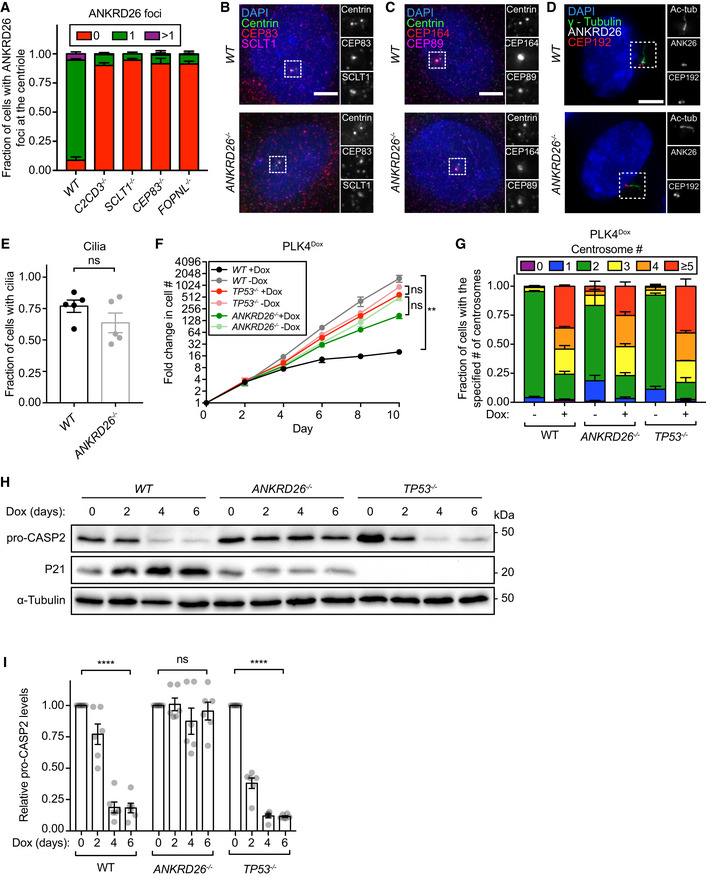
Quantification of the fraction of cells with ANKRD26 localized at the mature mother centriole. Experiments were performed in PLK4Dox monoclonal knockout cells. Data acquired across n = 3 biological replicates. Mean ± s.e.m.
- B–D
Representative images of WT or ANKRD26 −/− cells immunostained with the indicated antibodies. Scale bar = 5 µm.
- E
Quantification of the fraction of WT or ANKRD26 −/− hTERT RPE1 cells with cilia. Each dot displays measurements from a single experiment. Data acquired across n = 5 biological replicates. Mean ± s.e.m.
- F
Growth assay of the indicated cells with and without doxycycline‐inducible overexpression of PLK4. Experiments were performed in PLK4Dox monoclonal knockout cells. Data acquired across n = 3 biological replicates. Mean ± s.e.m.
- G
Quantification of centrosome number in PLK4Dox cells expressing an sgRNA targeting the indicated genes. Experiments were performed in PLK4Dox monoclonal knockout cells. Data acquired across n = 3 biological replicates. Mean ± s.e.m.
- H
Western blot showing expression of pro‐CASP2 and P21 following treatment with dox for the specified number of days. Experiments were performed in PLK4Dox monoclonal knockout cells.
- I
Quantification of pro‐CASP2 levels following treatment with dox for the specified number of days. Experiments were performed in PLK4Dox monoclonal knockout cells. Each dot displays measurements from a single experiment. Data acquired across n = 6 biological replicates. Mean ± s.e.m.
Representative images of monoclonal PLK4Dox knockout cells. Cells were stained with the indicated antibodies. Scale bar = 5 µm.
Quantification of the fraction of cells with the indicated mitotic spindle orientation following treatment with the centrosome declustering agent griseofulvin. Experiments were performed in monoclonal PLK4Dox knockout cells. Data acquired across n = 3 biological replicates. Mean ± s.e.m.
Representative images of PLK4Dox cells treated with and without doxycycline for two days then treated with griseofulvin for 24 h. Experiments were performed in monoclonal PLK4Dox knockout cells. Cells were immunostained with indicated antibodies. Scale bar = 5 µm.
Graph showing the relative growth of doxycycline‐treated SAS6Dox cells that were knocked out for the indicated genes. Experiments were performed in SAS6Dox monoclonal knockout cells. Each dot displays measurements from a single experiment. Data acquired across n = 3 biological replicates. Mean ± s.e.m.
Quantification of centrosome number in SAS6Dox cells expressing an sgRNA targeting the indicated genes. Experiments were performed in SAS6Dox monoclonal knockout cells. Data acquired across n = 3 biological replicates. Mean ± s.e.m.
Quantification of the fold change in cycling cells with a DNA content > 4N following cytokinesis failure. Experiments were performed in PLK4Dox monoclonal knockout cells. Each dot displays measurements from a single experiment. Data acquired across n = 4 biological replicates. Mean ± s.e.m.
Schematic showing the treatment regime for the cytokinesis failure assay shown in (F). Cells were treated with cytochalasin B for 24 h to induce cytokinesis failure followed by treatment with EdU and DMN to mark S‐phase cells and block progression through mitosis. The fraction of EdU+ cells with a DNA content > 4N was measured using flow cytometry.
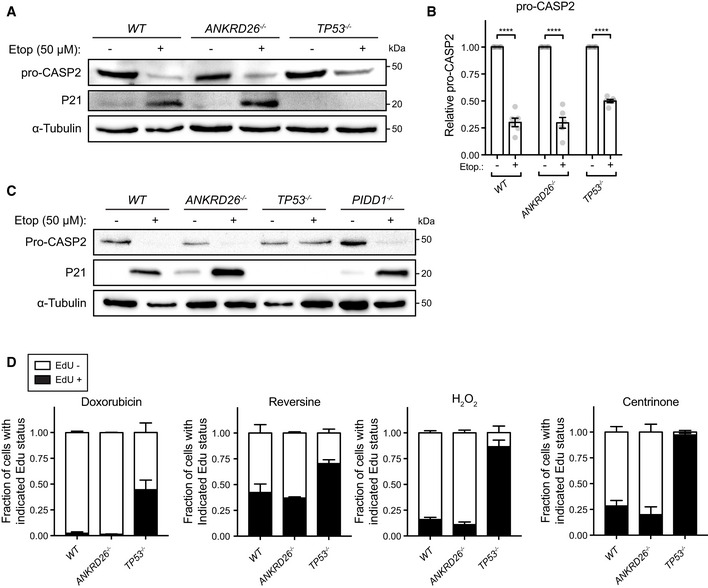
Western blot showing expression of pro‐CASP2 and P21 following treatment with etoposide. Experiments were performed in monoclonal PLK4Dox knockout cells.
Quantification of pro‐CASP2 levels following treatment with etoposide. Experiments were performed in monoclonal PLK4Dox knockout cells. Each dot displays measurements from a single experiment. Data acquired across n = 6 biological replicates. Mean ± s.e.m.
Western blot showing expression of pro‐CASP2 and P21 following treatment with etoposide. Experiments were performed in PLK4Dox cells knocked out for the indicated genes.
Quantification of the fraction of proliferating cells following treatment with the indicated drugs/reagents. Experiments were performed in monoclonal PLK4Dox knockout cells. Data acquired across n = 3 biological replicates. Mean ± s.e.m.
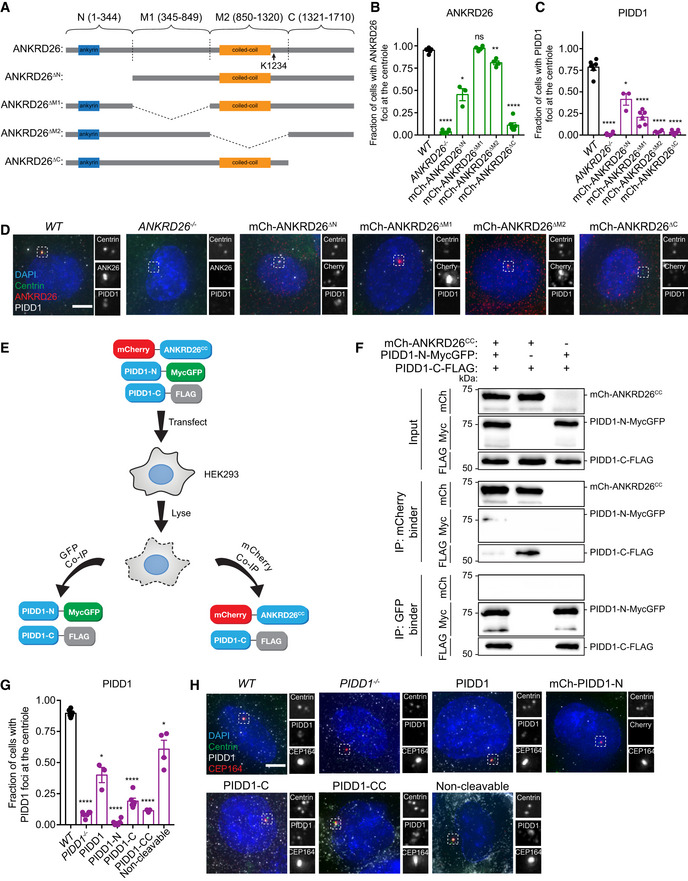
Schematic representation of wild‐type ANKRD26 and various mutants.
Quantification of the fraction of cells with ANKRD26 localized to the mature mother centriole in monoclonal ANKRD26 −/− PLK4Dox cells expressing the indicated mCherry‐ANKRD26 transgene. Each dot displays measurements from a single experiment. Data acquired across n ≥ 3 biological replicates. Mean ± s.e.m.
Quantification of the fraction of cells with PIDD1 localized to the mature mother centriole in monoclonal ANKRD26 −/− PLK4Dox cells expressing the indicated mCherry‐ANKRD26 transgene. Each dot displays measurements from a single experiment. Data acquired across n = 3 biological replicates. Mean ± s.e.m.
Representative images of monoclonal ANKRD26 −/− PLK4Dox cells expressing the indicated mCherry‐ANKRD26 transgene. Cells were immunostained with indicated antibodies. Scale bar = 5 µm.
Schematic of the co‐immunoprecipitation procedure performed in (F).
HEK293FT cells were transfected with the indicated constructs. Cell lysates were split and subjected to co‐immunoprecipitation with mCherry or GFP binder beads.
Quantification of the fraction of cells with PIDD1 localized to the mature mother centriole in monoclonal PIDD1 −/− PLK4Dox cells expressing the indicated PIDD1 transgene. Each dot displays measurements from a single experiment. Data acquired across n = 3 biological replicates. Mean ± s.e.m.
Representative images of monoclonal PIDD1 −/− PLK4Dox cells expressing the indicated PIDD1 transgene. Cells were immunostained with indicated antibodies. Scale bar = 5 µm.
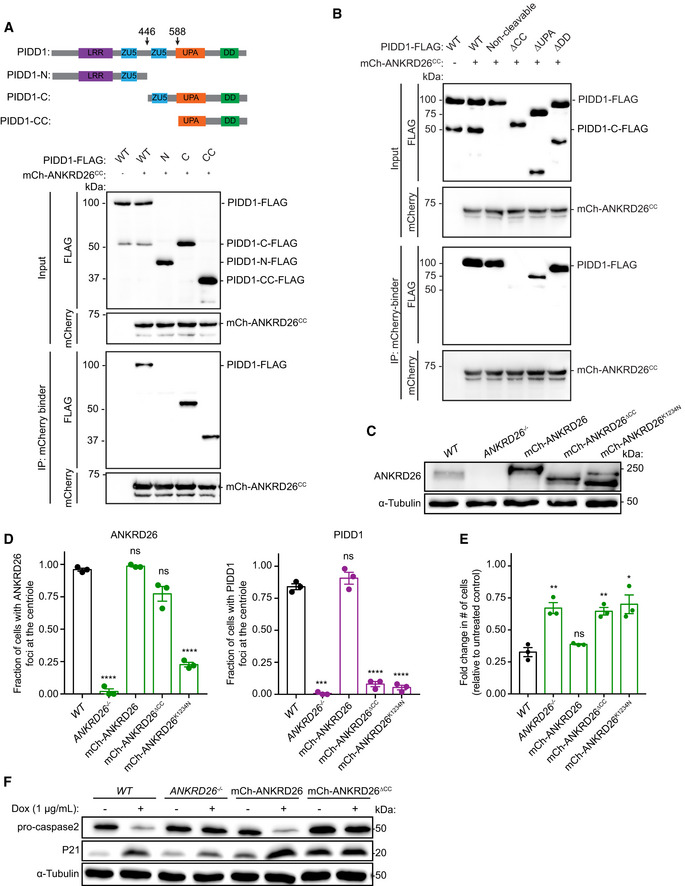
Top: schematic representation of PIDD1 and its cleavage products. Bottom: HEK293FT cells were transfected with the indicated constructs, subjected to co‐immunoprecipitation and immunoblotted with the indicated antibodies.
HEK293FT cells were transfected with the indicated constructs, subjected to co‐immunoprecipitation and immunoblotted with the indicated antibodies.
Western blot showing the expression of ANKRD26. Experiments were performed in monoclonal ANKRD26 −/− PLK4Dox cells expressing the indicated ANKRD26 transgenes.
Quantification of the fraction of cells with ANKRD26 (left) and PIDD1 (right) localized to the mature mother centriole in monoclonal ANKRD26 −/− PLK4Dox cells expressing the indicated transgenes. Each dot displays measurements from a single experiment. Data acquired across n = 3 biological replicates. Mean ± s.e.m.
Graph showing the relative growth of doxycycline‐treated, monoclonal ANKRD26 −/− PLK4Dox cells expressing the indicated ANKRD26 transgenes. Each dot displays measurements from a single experiment. Data acquired across n = 3 biological replicates. Mean ± s.e.m.
Western blot showing expression of pro‐CASP2 and P21 following treatment with dox for 4 days. Experiments were performed in monoclonal ANKRD26 −/− PLK4Dox cells expressing the indicated transgenes.
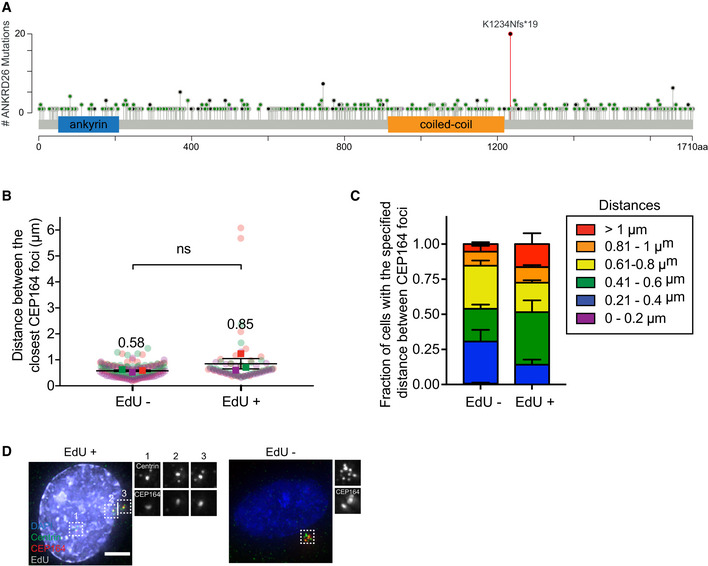
Schematic showing the location of the 533 mutations in ANKRD26 in human tumors. Black represents truncating mutations; green represents missense mutations; purple represents inframe mutations. The K1234Nfs*19 mutation is shown in red. Data from curated set of non‐redundant studies in cBioPortal (Cerami et al, 2012).
Plot showing the distance between the closest CEP164 rings in cycling (EdU+) and non‐cycling (EdU− cells). Squares show the mean for each biological replicate; colored circles show individual data points from each of the replicates. Data acquired across n = 3, biological replicates, each with > 20 cells. P values, unpaired two‐tailed t‐test. Mean ± s.e.m.
Stacked bar graphs of the same data shown in (B). Mean ± s.e.m.
Representative images of PLK4Dox RPE1 cells treated with and without doxycycline for two days and immunostained with the indicated antibodies. Scale bar = 5 µm.
Comment in
-
Centrosomes: Please keep your social distance!EMBO J. 2021 Feb 15;40(4):e107525. doi: 10.15252/embj.2020107525. Epub 2021 Jan 25. EMBO J. 2021. PMID: 33491191 Free PMC article.
Similar articles
-
Centriolar distal appendages activate the centrosome-PIDDosome-p53 signalling axis via ANKRD26.EMBO J. 2021 Feb 15;40(4):e104844. doi: 10.15252/embj.2020104844. Epub 2020 Dec 22. EMBO J. 2021. PMID: 33350486 Free PMC article.
-
Caspase-2 kills cells with extra centrosomes.Sci Adv. 2024 Nov;10(44):eado6607. doi: 10.1126/sciadv.ado6607. Epub 2024 Oct 30. Sci Adv. 2024. PMID: 39475598 Free PMC article.
-
The PIDDosome activates p53 in response to supernumerary centrosomes.Genes Dev. 2017 Jan 1;31(1):34-45. doi: 10.1101/gad.289728.116. Genes Dev. 2017. PMID: 28130345 Free PMC article.
-
Total recall: the role of PIDDosome components in neurodegeneration.Trends Mol Med. 2023 Dec;29(12):996-1013. doi: 10.1016/j.molmed.2023.08.008. Epub 2023 Sep 14. Trends Mol Med. 2023. PMID: 37716905 Review.
-
The resurrection of the PIDDosome - emerging roles in the DNA-damage response and centrosome surveillance.J Cell Sci. 2017 Nov 15;130(22):3779-3787. doi: 10.1242/jcs.203448. J Cell Sci. 2017. PMID: 29142064 Review.
Cited by
-
Bystanders or active players: the role of extra centrosomes as signaling hubs.Cancer Metastasis Rev. 2024 Nov 20;44(1):1. doi: 10.1007/s10555-024-10224-4. Cancer Metastasis Rev. 2024. PMID: 39570514 Free PMC article. Review.
-
Centriole structural integrity defects are a crucial feature of hydrolethalus syndrome.J Cell Biol. 2025 Apr 7;224(4):e202403022. doi: 10.1083/jcb.202403022. Epub 2025 Feb 26. J Cell Biol. 2025. PMID: 40009365
-
Centriolar subdistal appendages promote double-strand break repair through homologous recombination.EMBO Rep. 2023 Oct 9;24(10):e56724. doi: 10.15252/embr.202256724. Epub 2023 Sep 4. EMBO Rep. 2023. PMID: 37664992 Free PMC article.
-
Expanding roles of centrosome abnormalities in cancers.BMB Rep. 2023 Apr;56(4):216-224. doi: 10.5483/BMBRep.2023-0025. BMB Rep. 2023. PMID: 36945828 Free PMC article. Review.
-
PIDD1 in cell cycle control, sterile inflammation and cell death.Biochem Soc Trans. 2022 Apr 29;50(2):813-824. doi: 10.1042/BST20211186. Biochem Soc Trans. 2022. PMID: 35343572 Free PMC article. Review.
References
Publication types
MeSH terms
Substances
Grants and funding
LinkOut - more resources
Full Text Sources
Research Materials
Miscellaneous
