

Attenuated CSF-1R signalling drives cerebrovascular pathology
- PMID: 33350588
- PMCID: PMC7863388
- DOI: 10.15252/emmm.202012889
Attenuated CSF-1R signalling drives cerebrovascular pathology
Abstract
Cerebrovascular pathologies occur in up to 80% of cases of Alzheimer's disease; however, the underlying mechanisms that lead to perivascular pathology and accompanying blood-brain barrier (BBB) disruption are still not fully understood. We have identified previously unreported mutations in colony stimulating factor-1 receptor (CSF-1R) in an ultra-rare autosomal dominant condition termed adult-onset leucoencephalopathy with axonal spheroids and pigmented glia (ALSP). Cerebrovascular pathologies such as cerebral amyloid angiopathy (CAA) and perivascular p-Tau were some of the primary neuropathological features of this condition. We have identified two families with different dominant acting alleles with variants located in the kinase region of the CSF-1R gene, which confer a lack of kinase activity and signalling. The protein product of this gene acts as the receptor for 2 cognate ligands, namely colony stimulating factor-1 (CSF-1) and interleukin-34 (IL-34). Here, we show that depletion in CSF-1R signalling induces BBB disruption and decreases the phagocytic capacity of peripheral macrophages but not microglia. CSF-1R signalling appears to be critical for macrophage and microglial activation, and macrophage localisation to amyloid appears reduced following the induction of Csf-1r heterozygosity in macrophages. Finally, we show that endothelial/microglial crosstalk and concomitant attenuation of CSF-1R signalling causes re-modelling of BBB-associated tight junctions and suggest that regulating BBB integrity and systemic macrophage recruitment to the brain may be therapeutically relevant in ALSP and other Alzheimer's-like dementias.
Keywords: CSF-1; CSF-1R; IL-34; adult-onset leucoencephalopathy with axonal spheroids and pigmented glia (ALSP); blood; brain barrier.
© 2020 The Authors. Published under the terms of the CC BY 4.0 license.
Conflict of interest statement
The authors declare that they have no conflict of interest.
Figures
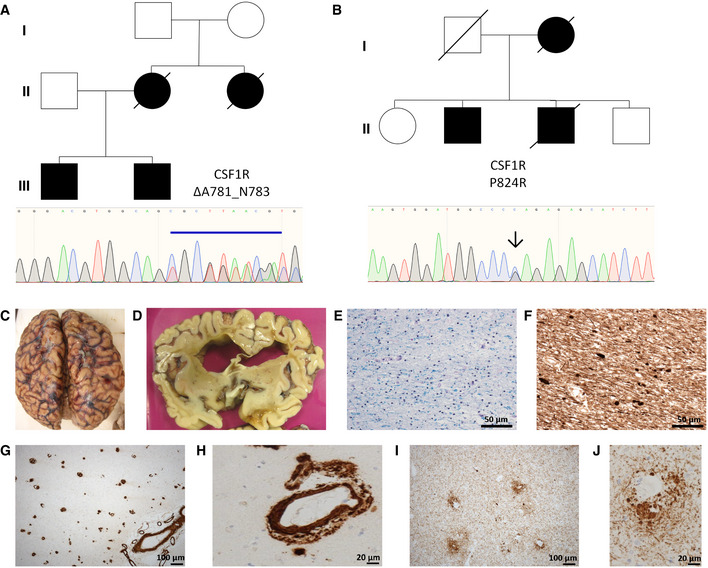
- A, B
Family pedigrees for CSF‐1R variants ΔA781_N783 and P824R, with Sanger sequencing confirmations for each variant below.
- C
Cystic encephalomalacia evident in the right inferior frontal lobe secondary to a historical intraparenchymal haemorrhage.
- D
Extensive atrophy evident in frontal lobe.
- E
Secondary de‐myelination observed with Luxol‐Fast Blue stain.
- F
Wallerian degeneration observed with spheroids apparent following phosphorylated neurofilament staining.
- G, H
Profound cerebral amyloid angiopathy (CAA), involving meningeal and intraparenchymal blood vessels.
- I, J
Extensive phospho‐tau staining displaying a perivascular pattern of deposition.
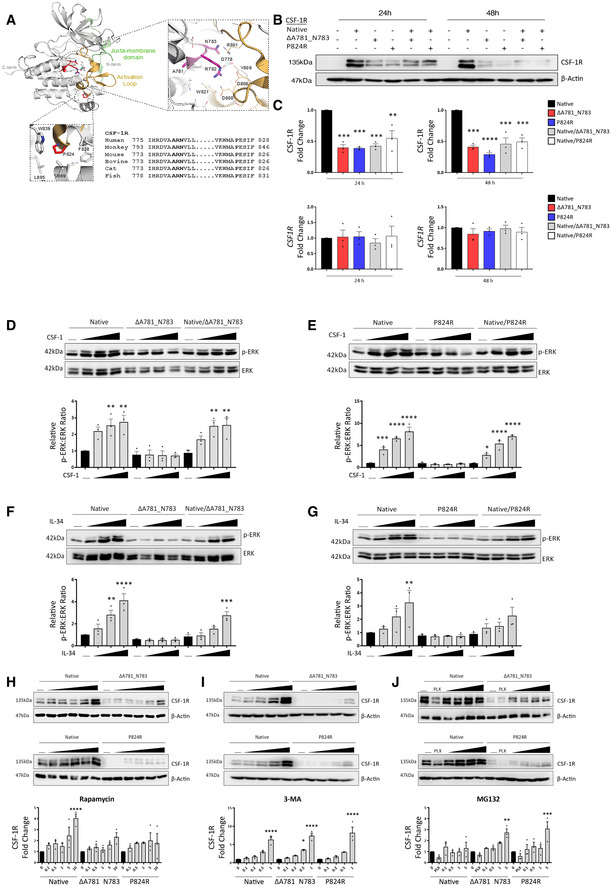
- A
Structure‐sequence analysis and context of the CSF‐1R ΔA781_N783 and P824R variants. Sequences used in the alignment correspond to Uniprot sequences for CSF‐1R as follows: Human P07333, Cynomolgus Monkey A0A2K5WG91, Mouse P09581, Bovine A7Z067, Cat P13369, Zebrafish Q9I8N6.
- B
Western blot for CSF‐1R and Actin in HEK293 cells transfected with native and variant CSF‐1R as indicated.
- C
Densitometry (top) and qPCR analysis of native and variant CSF‐1R expression in HEK293 cells relative to native‐transfected at 24 and 48 h (****P < 0.0001, ***P < 0.0005, , **P < 0.005 one‐way ANOVA with Sidak's post‐test for multiple comparison, n = 3 biological replicates, error bars indicate SEM).
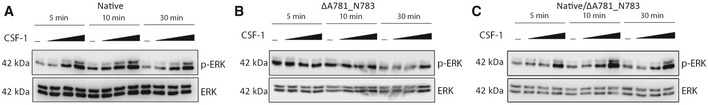
- D–G
Western blot for phosphorylated and total ERK in HEK293 cells transfected with native and ΔA781_N783 (left) or P824R (right) CSF‐1R and treated with CSF‐1 (D, E) or IL‐34 (F, G) for 10 min. Horizontal line indicates untreated cells, with increasing concentrations 10, 50 and 100 ng/ml. Corresponding densitometry displays the ratio of phospho‐ERK to total ERK, normalised to the ratio of the untreated control for the native receptor (****P < 0.0001, ***P < 0.0005, **P < 0.01, *P < 0.05, one‐way ANOVA with Sidak’s post‐test for multiple comparison, n = 3 biological replicates, , error bars indicate SEM).
- H
Western blot for CSF‐1R in HEK293 cells transfected with native and ΔA781_N783 (top) or P824R (bottom) CSF‐1R and treated with rapamycin. Horizontal line indicates untreated cells, with concentrations 0.1, 0.5, 1, 5, 10 μM. Corresponding densitometry (below) displays the fold change of CSF‐1R relative to the untreated control for each transfection (****P < 0.0001, one‐way ANOVA with Sidak's post‐test for multiple comparison to untreated, n = 3 biological replicates, error bars indicate SEM).
- I
Western blot for CSF‐1R in HEK293 cells transfected with native and ΔA781_N783 (top) or P824R (bottom) CSF‐1R and treated with 3‐methyladenosine. Horizontal line indicates untreated cells, with increasing concentrations 0.1, 0.2, 0.5, 1 mM. Corresponding densitometry (below) displays the fold change of CSF‐1R relative to the untreated control for each transfection (****P < 0.0001, *P = 0.0114, one‐way ANOVA with Sidak's post‐test for multiple comparison to untreated, n = 3 biological replicates, error bars indicate SEM).
- J
Western blot for CSF‐1R and Actin in HEK293 cells transfected with native and ΔA781_N783 (top) or P824R (bottom) CSF‐1R and treated with MG132 or PLX3397. Horizontal line indicates untreated cells, 20 μM PLX3397, with increasing concentrations 0.1, 0.5, 0.1, 5 μM. Corresponding densitometry (below) displays the fold change of CSF‐1R relative to the untreated control for each transfection (***P = 0.0002, **P = 0.002, one‐way ANOVA with Sidak's post‐test for multiple comparison to untreated, n = 3 biological replicates, error bars indicate SEM).
- A–C
qPCR of wild type (blue) or Csf1r +/− (red) endothelial cells treated with control, Csf1r +/+ MCM or Csf1r +/− MCM. Statistical analyses of inter‐genotype changes. (*P < 0.05, **P < 0.005, ***P < 0.0008, ****P < 0.0001. Scatter plots represent technical replicates of n = 2 independent primary cell isolations and microglia conditionings, two‐way ANOVA with multiple comparisons and Sidak’s post‐test, error bars indicate SEM).Western blot for phosphorylated and total ERK in HEK293 cells transfected with (A) native CSF‐1R, (B) ΔA781_N783 CSF‐1R or (C) both native and ΔA781_N783 CSF‐1R. Cells were treated with MG132 for 1 h, followed by treatment with CSF1 for 10 min. Horizontal line indicates untreated cells, with increasing concentrations 10, 50 and 100 ng/ml CSF1.
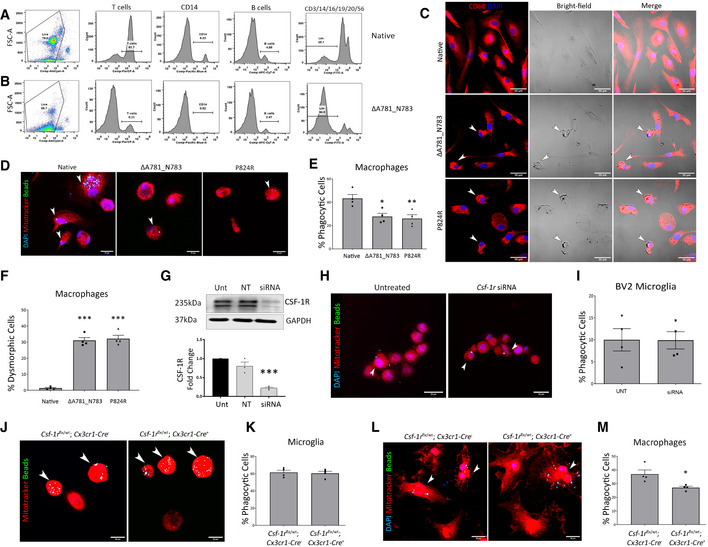
- A, B
FACS of control and ΔA781_N783 PBMCs using lineage markers for CD3 (T cells), CD14 (monocytes/macrophages), CD19 (B cells), CD16, CD20 and CD56. Cells negative for all 6 makers were determined to be lineage‐negative (Lin−).
- C
Immunocytochemistry of macrophages differentiated in vitro from control, ΔA781_N783 or P824R PBMCs. Cells were stained for DAPI (blue) and CD68 (red). White arrows indicate dysmorphic macrophages.
- D
Immunocytochemistry of macrophages differentiated in vitro from control, ΔA781_N783 or P824R PBMCs. Macrophages were stimulated with LPS and exposed to fluorescent opsonised latex beads for 1 h before fixation and quantification of bead+ cells via microscopy. Cells were stained using MitoTracker (red) and DAPI (blue).
- E
Quantification of phagocytic activity expressed as percentage bead+ cells. P values were calculated using (**P = 0.008, *P = 0.0141, one‐way ANOVA with Tukey’s multiple comparison test, n = 4 assays, error bars indicate SEM).
- F
Quantification of macrophages displaying an aberrant morphology as indicated in (c), displayed as percentage of dysmorphic cells per image (***P < 0.0005, one‐way ANOVA with Dunnett’s multiple comparison test, data representative of n = 2 independent differentiations, with two fields of view imaged per well, error bars indicate SEM).
- G
Western blot for CSF‐1R in untreated (Unt) BV2 microglia, or BV2 microglia transfected with non‐targeting or Csf‐1r targeting siRNA. Corresponding densitometry (below) representative of technical replicate of n = 3 blots (one‐way ANOVA with Dunnett’s multiple comparison, ***P = 0.0003, error bars indicate SEM).
- H
Immunocytochemistry of untreated and Csf‐1r siRNA treated BV2 microglia. BV2 microglia were stimulated with LPS and exposed to fluorescent opsonised latex beads for 1 h before fixation and quantification of bead+ cells via microscopy. Cells were stained using MitoTracker (red) and DAPI (blue). Arrowheads (white) indicate bead+ cells.
- I
Quantification of BV2 phagocytic activity expressed as percentage bead+ cells (data representative of n = 2 independent differentiations, with two fields of view imaged per well, error bars indicate SEM).
- J
Immunocytochemistry of microglia isolated from Csf‐1rflx / wt;Cx3cr1‐Cre − and Csf‐1rflx / wt;Cx3cr1‐Cre + P0 mouse pup brains. Microglia were stimulated with LPS and exposed to fluorescent opsonised latex beads for 1 h before fixation and quantification of bead+ cells via microscopy. Cells were stained using MitoTracker(red). Arrowheads (white) indicate bead+ cells.
- K
Quantification of mouse microglial phagocytic activity expressed as percentage bead+ cells (n = 4 assays, error bars indicate SEM).
- L
Immunocytochemistry of macrophages differentiated in vitro from Csf‐1rflx / wt;Cx3cr1‐Cre − and Csf‐1rflx / wt;Cx3cr1‐Cre + mouse bone marrow. Macrophages were stimulated with LPS and exposed to fluorescent opsonised latex beads for 1 h before fixation and quantification of bead + cells via microscopy. Cells were stained using MitoTracker (red) and DAPI (blue). Arrowheads (white) indicate bead+ cells.
- M
Quantification of mouse macrophage phagocytic activity expressed as percentage bead+ cells. (*P = 0.024, Student’s t‐test with Welch’s correction, n = 4 assays, error bars indicate SEM).
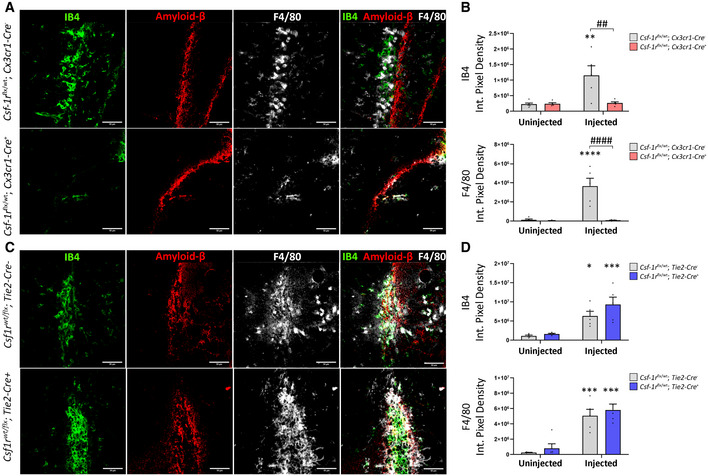
Immunohistochemistry of Csf‐1rflx / wt;Cx3cr1‐Cre − (top) and Csf‐1rflx / wt;Cx3cr1‐Cre + (bottom) mice unilaterally injected with Aβ1‐42 in the hippocampus and stained for IB4 (green), F4/80 (white) and Aβ (red). Scale bars indicate 50 μm.
Quantification of F4/80 and IB4 immunopositivity following intrahippocampal injection of Aβ1‐42. Quantification of immunopositivity in both injected and uninjected hippocampi of Csf‐1rflx / wt;Cx3cr1‐Cre − and Csf‐1rflx / wt;Cx3cr1‐Cre + mice. (Two‐way ANOVA with Sidak’s test for multiple comparisons. Asterisks (*) indicate comparison to immunopositivity values of the uninjected hippocampus, obliques (#) indicate comparison between Csf‐1rflx / wt;Cx3cr1‐Cre − and Csf‐1rflx / wt;Cx3cr1‐Cre + mice, ## or **P < 0.003, #### or ****P < 0.0001, n = 5 mice per group, error bars indicate SEM.)
Immunohistochemistry of Csf‐1rflx / wt; Tie2‐Cre − (top) and Csf‐1rflx / wt;Tie2‐Cre + mice (bottom) mice unilaterally injected with Aβ1‐42 in the hippocampus and stained for IB4 (green), F4/80 (white) and Aβ (red).
Quantification of F4/80 and IB4 immunopositivity following intrahippocampal injection of Aβ1‐42. Quantification of immunopositivity in both injected and uninjected hippocampi of Csf‐1rflx / wt;Tie2‐Cre − and Csf‐1rflx / wt;Tie2‐Cre + mice. (n = 5 mice per group. Two‐way ANOVA with Sidak’s test for multiple comparisons. Asterisks (*) indicate comparison to immunopositivity values of the uninjected hippocampus, *P < 0.01, ***P < 0.0005, error bars indicate SEM).
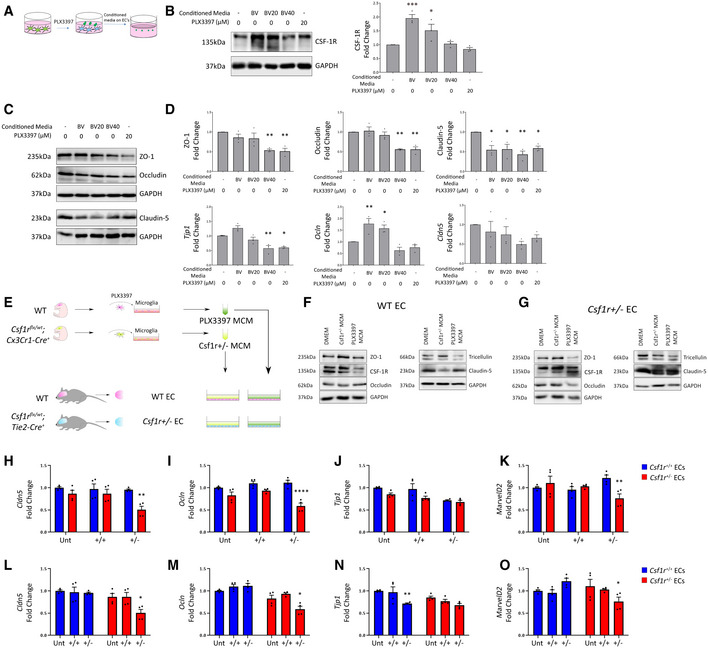
- A
Schematic for experimental design.
- B
Western blot for CSF‐1R in b.End3 cells treated with different BV2 conditioned media or PLX3397, with corresponding densitometry (right). (n = 3 independent BV2 media conditionings and b.End3 treatments, one‐way ANOVA with Dunnett’s post‐test for multiple comparisons, *P < 0.05, ***P < 0.0005, error bars indicate SEM).
- C
Western blot for tight junction proteins in b.End3 cells treated with unconditioned, microglia conditioned media or PLX3397.
- D
Densitometry of tight junction protein changes (top) and transcriptional changes in Tjp1, Ocln and Cld5 (bottom) following conditioned media treatments or 20 μM PLX3397. (n = 3 independent BV2 media conditionings and b.End3 treatments, one‐way ANOVA with Dunnett’s post‐test for multiple comparisons, *P < 0.05, **P < 0.009, error bars indicate SEM).
- E
Schematic for experimental design.
- F
Western blot of WT endothelial cells treated with unconditioned or microglia conditioned media (MCM) produced from Csf‐1r +/− or PLX3397‐inhibited microglia.
- G
Western blot of Csf‐1r +/− endothelial cells treated with unconditioned, Csf‐1r +/− MCM or PLX3397 MCM.
- H–K
qPCR of wild type (blue) or Csf‐1r +/− (red) endothelial cells treated with control, Csf‐1r +/+ MCM or Csf‐1r +/− MCM. Statistical analyses of inter‐genotype changes. (****P < 0.0001, **P < 0.005, Scatter plots represent technical replicates of n = 2 independent primary cell isolations and microglia conditionings, Two‐way ANOVA with multiple comparisons and Sidak’s post‐test, error bars indicate SEM).
- L–O
qPCR of wild type (blue) or Csf‐1r +/− (red) endothelial cells treated with control, Csf‐1r +/+ MCM or Csf‐1r +/− MCM. Statistical analyses of changes relative to respective untreated Control. (**P < 0.005, *P < 0.05. Scatter plots represent technical replicates of n = 2 independent primary cell isolations and microglia conditionings, two‐way ANOVA with multiple comparisons and Sidak’s post‐test, error bars indicate SEM).
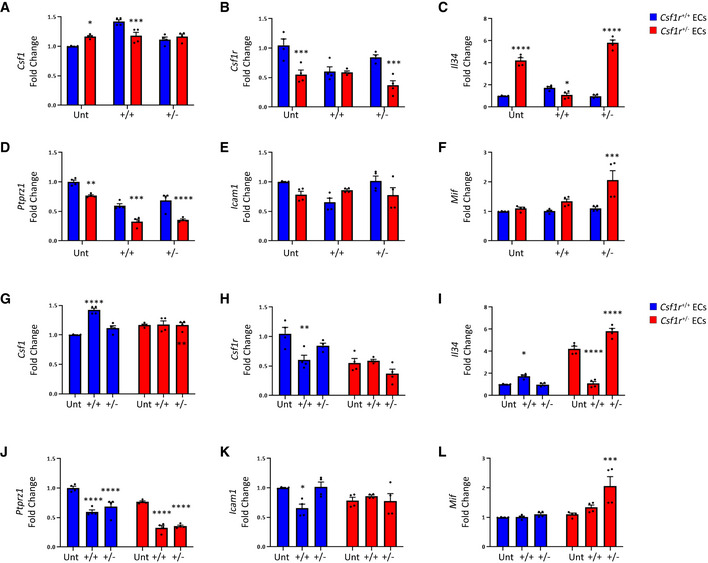
- A–F
qPCR of wild type (blue) or Csf1r +/− (red) endothelial cells treated with control, Csf1r +/+ MCM or Csf1r +/− MCM. Statistical analyses of inter‐genotype changes. (*P < 0.05, **P < 0.005, ***P < 0.0008, ****P < 0.0001. Scatter plots represent technical replicates of n = 2 independent primary cell isolations and microglia conditionings, two‐way ANOVA with multiple comparisons and Sidak’s post‐test, error bars indicate SEM).
- G–L
qPCR of wild type (blue) or Csf1r +/− (red) endothelial cells treated with control, Csf1r +/+ MCM or Csf1r +/− MCM. Statistical analyses of changes relative to respective untreated control. (*P < 0.05, **P < 0.008, ***P < 0.0008, ****P < 0.0001. Scatter plots represent technical replicates of n = 2 independent primary cell isolations and microglia conditionings, two‐way ANOVA with multiple comparisons and Sidak’s post‐test, error bars indicate SEM).
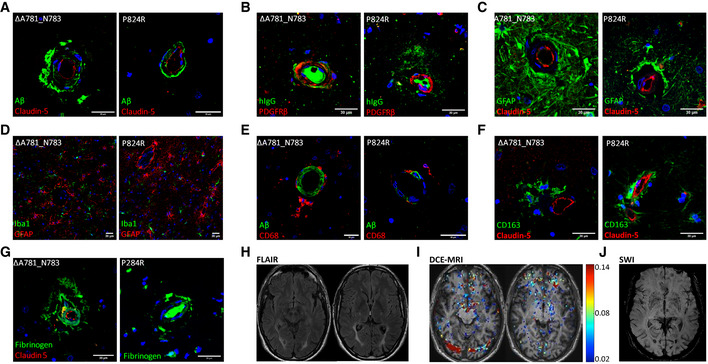
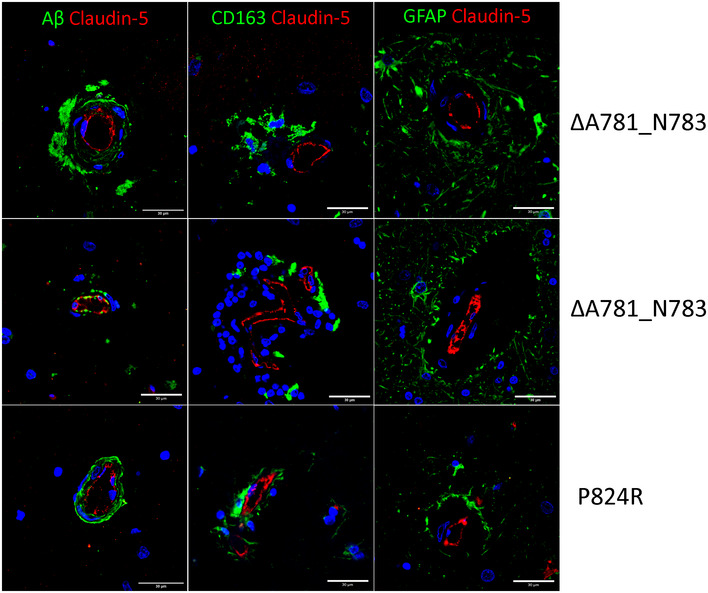
- A–C
(A) IHC of ALSP patient post‐mortem tissue for amyloid‐β (green) and CLD5 (red), (B) human IgG (green) and PDGFRβ (red), (C) GFAP (green) and CLD5 (red). ΔA781_N783 and P824R indicate the CSF‐1R variant present.
- D–H
(D) Iba1 (green) and GFAP (red), (E) amyloid‐β (green) and CD68 (red), (F) CD163 (green) and CLD5 (red), (G) fibrinogen (green) and CLD5 (red) and (H) FLAIR imaging of an ALSP patient with the ΔA781_N783 CSF‐1R variant. ΔA781_N783 and P824R indicate the CSF‐1R variant present.
- I
T1‐weighted DCE‐MRI of an ALSP patient with the ΔA781_N783 CSF‐1R variant. Colormetric scale indicates the slope of the quantified Gd‐BOPTA accumulation, as an indicator of BBB permeability.
- J
Susceptibility weighted imaging (SWI) of an ALSP patient with the ΔA781_N783 CSF‐1R variant showing iron deposition.
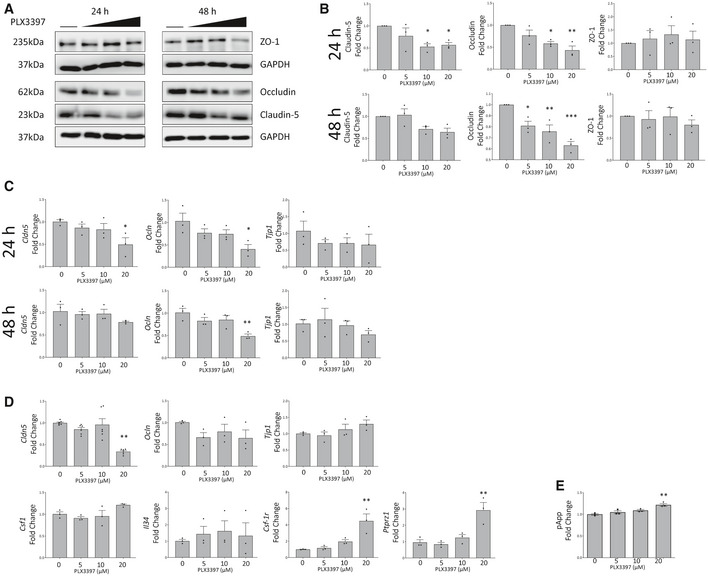
- A, B
Western blot of lysates from PLX3397 treated b.End3 cells for tight junction proteins ZO‐1, Occludin and Claudin‐5 (A). The horizontal line indicates untreated cells, with increasing PLX3397 concentrations (5, 10, 20 μM). Corresponding densitometry is given in (B). (One‐way ANOVA with Dunnett’s post‐test for multiple comparisons, *P < 0.05, **P < 0.005, ***P < 0.0005, n = 3 independent experiments, error bars indicate SEM)
- C
Gene expression changes at 24 (top) and 48 (bottom) h in PLX3397 treated b.End3 cells shown by qPCR for Tjp1, Ocln and Cldn5 (*P < 0.05, **P < 0.006, n = 3 independent experiments one‐way ANOVA with Dunnett’s post‐test, error bars indicate SEM).
- D
qPCR analysis of tight junction and CSF‐1R pathway gene expression changes at 24 h in PLX3397 treated MBECs (one‐way ANOVA with Dunnett’s post‐test for multiple comparisons, **P < 0.009, n = 3 independent experiments, error bars indicate SEM).
- E
FITC‐4kDA transwell permeability assay of primary mouse microvascular endothelial cells (MBECs) treated for 24 h with PLX3397 at indicated doses (one‐way ANOVA with Dunnett’s correction, n = 3 technical replicates for flux assay, one‐way ANOVA with Dunnett’s post‐test for multiple comparisons, **P = 0.0012, error bars indicate SEM).
References
-
- Adams SJ, Kirk A, Auer RN (2018) Adult‐onset leukoencephalopathy with axonal spheroids and pigmented glia (ALSP): Integrating the literature on hereditary diffuse leukoencephalopathy with spheroids (HDLS) and pigmentary orthochromatic leukodystrophy (POLD). J Clin Neurosci 48: 42–49 - PubMed
-
- Axelsson R, Roytta M, Sourander P, Akesson HO, Andersen O (1984) Hereditary diffuse leucoencephalopathy with spheroids. Acta Psychiatr Scand Suppl 314: 1–65 - PubMed
-
- Van Bogaert LNR (1936) Le type tardif de la leukodystrophie progressive familiale. Rev Neurol 65: 21–45
Publication types
MeSH terms
Substances
LinkOut - more resources
Full Text Sources
Research Materials
Miscellaneous
