Review
. 2021 Feb;298(2):248-260.
doi: 10.1148/radiol.2020202747. Epub 2020 Dec 22.

MRI-guided Radiation Therapy: An Emerging Paradigm in Adaptive Radiation Oncology

Affiliations
Review

MRI-guided Radiation Therapy: An Emerging Paradigm in Adaptive Radiation Oncology

Ricardo Otazo et al. Radiology. 2021 Feb.

Abstract

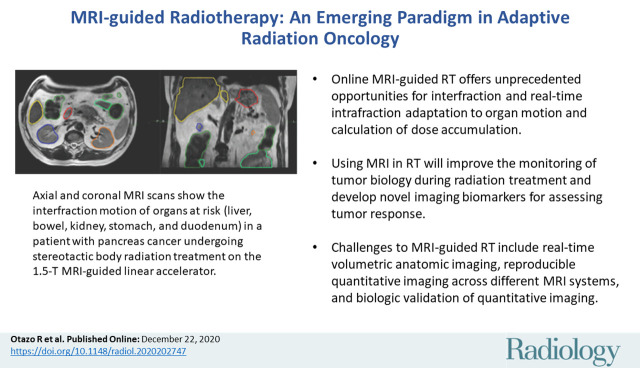
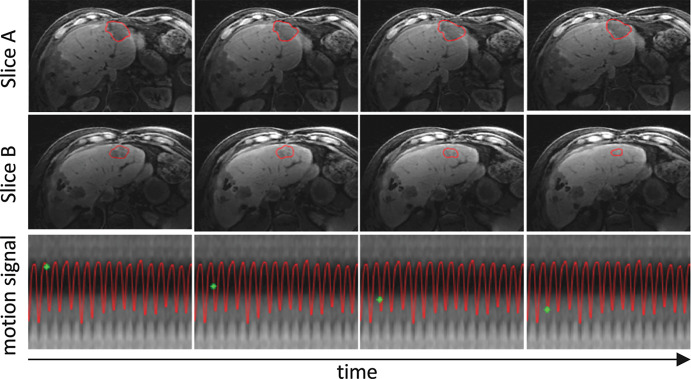
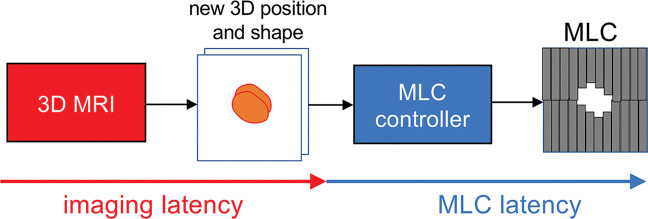
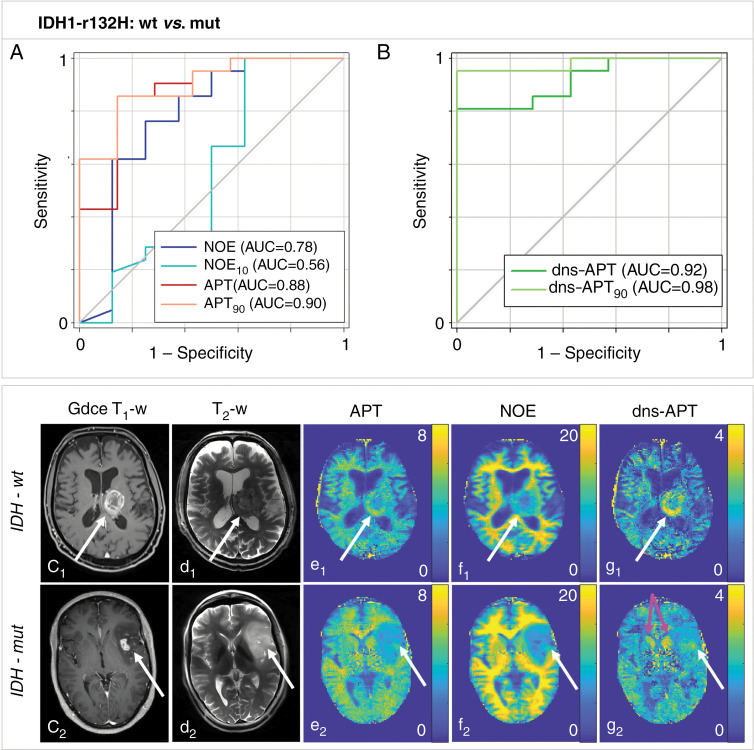
Radiation therapy (RT) continues to be one of the mainstays of cancer treatment. Considerable efforts have been recently devoted to integrating MRI into clinical RT planning and monitoring. This integration, known as MRI-guided RT, has been motivated by the superior soft-tissue contrast, organ motion visualization, and ability to monitor tumor and tissue physiologic changes provided by MRI compared with CT. Offline MRI is already used for treatment planning at many institutions. Furthermore, MRI-guided linear accelerator systems, allowing use of MRI during treatment, enable improved adaptation to anatomic changes between RT fractions compared with CT guidance. Efforts are underway to develop real-time MRI-guided intrafraction adaptive RT of tumors affected by motion and MRI-derived biomarkers to monitor treatment response and potentially adapt treatment to physiologic changes. These developments in MRI guidance provide the basis for a paradigm change in treatment planning, monitoring, and adaptation. Key challenges to advancing MRI-guided RT include real-time volumetric anatomic imaging, addressing image distortion because of magnetic field inhomogeneities, reproducible quantitative imaging across different MRI systems, and biologic validation of quantitative imaging. This review describes emerging innovations in offline and online MRI-guided RT, exciting opportunities they offer for advancing research and clinical care, hurdles to be overcome, and the need for multidisciplinary collaboration.


Figures

None
Graphical abstract
Evolution of image-guided radiation therapy (RT) methods (in blue shades) and corresponding imaging technique used for guidance (yellow, orange, red). IGRT = image-guided RT, IMRT = intensity-modulated RT, MLC = multileaf collimator, MRI-Linac = MRI-guided linear accelerator, SBRT = stereotactic body RT, 3D = three-dimensional, 2D = two-dimensional.
Figure 1:
Evolution of image-guided radiation therapy (RT) methods (in blue shades) and corresponding imaging technique used for guidance (yellow, orange, red). IGRT = image-guided RT, IMRT = intensity-modulated RT, MLC = multileaf collimator, MRI-Linac = MRI-guided linear accelerator, SBRT = stereotactic body RT, 3D = three-dimensional, 2D = two-dimensional.
Schematic description of interfraction and intrafraction adaptation to organ motion by using online MRI-guided radiation therapy with a hybrid MRI-guided linear accelerator system. For interfraction adaptation, treatment is adjusted according to the image of the day (dashed lines show the position of the tumor and organ at risk for fraction 1). Intrafraction adaptation uses real-time imaging to adjust treatment according to continuous and/or sporadic organ motion within each fraction (dotted lines show the position of the tumor and organ at risk for the first point of real-time imaging).
Figure 2:
Schematic description of interfraction and intrafraction adaptation to organ motion by using online MRI-guided radiation therapy with a hybrid MRI-guided linear accelerator system. For interfraction adaptation, treatment is adjusted according to the image of the day (dashed lines show the position of the tumor and organ at risk for fraction 1). Intrafraction adaptation uses real-time imaging to adjust treatment according to continuous and/or sporadic organ motion within each fraction (dotted lines show the position of the tumor and organ at risk for the first point of real-time imaging).
Offline MRI-guided RT of a patient with prostate cancer. The axial T2-weighted (T2w) image is used for diagnostic purposes, and the modified Dixon (mDixon) in-phase image is used for treatment planning. A synthetic CT image is created with an artificial intelligence algorithm from the mDixon image and is then used to compute the dose distribution. Figure adapted, with permission, from Dr Neelam Tyagi, Memorial Sloan-Kettering Cancer Center.
Figure 3:
Offline MRI-guided RT of a patient with prostate cancer. The axial T2-weighted (T2w) image is used for diagnostic purposes, and the modified Dixon (mDixon) in-phase image is used for treatment planning. A synthetic CT image is created with an artificial intelligence algorithm from the mDixon image and is then used to compute the dose distribution. Figure adapted, with permission, from Dr Neelam Tyagi, Memorial Sloan-Kettering Cancer Center.
Interfraction adaptive treatment of a patient with rectal cancer on the Elekta 1.5T MRI-guided linear accelerator. Tumor contour for fraction 1 is shown in red and tumor contours for other fractions are shown in green. The ability to adapt treatment to the exact location and size of the tumor improved outcome and resulted in tumor remission. Figure adapted, with permission, from Drs Martijn Intven and Bas Raaymakers, University Medical Center Utrecht.
Figure 4:
Interfraction adaptive treatment of a patient with rectal cancer on the Elekta 1.5T MRI-guided linear accelerator. Tumor contour for fraction 1 is shown in red and tumor contours for other fractions are shown in green. The ability to adapt treatment to the exact location and size of the tumor improved outcome and resulted in tumor remission. Figure adapted, with permission, from Drs Martijn Intven and Bas Raaymakers, University Medical Center Utrecht.
Interfraction motion of organs at risk (liver, bowel, kidney, stomach, and duodenum) in a patient with pancreas cancer undergoing five-fraction stereotactic body radiation treatment (10 Gy × 5) on the Elekta 1.5-T MRI-guided linear accelerator. The ability to adapt treatment according to the position of the organs at risk increased safety of the procedure. Figure used, with permission, from Dr Neelam Tyagi, Memorial Sloan-Kettering Cancer Center.
Figure 5:
Interfraction motion of organs at risk (liver, bowel, kidney, stomach, and duodenum) in a patient with pancreas cancer undergoing five-fraction stereotactic body radiation treatment (10 Gy × 5) on the Elekta 1.5-T MRI-guided linear accelerator. The ability to adapt treatment according to the position of the organs at risk increased safety of the procedure. Figure used, with permission, from Dr Neelam Tyagi, Memorial Sloan-Kettering Cancer Center.
Single-fraction motion-gated lung stereotactic ablative radiation therapy by using the ViewRay 0.35-T MRI-guided linear accelerator system. A, Treatment plan for the first three patients, where one fraction of 34 Gy is delivered to the planning target volume (red). The planning target volume is created by adding a 5-mm isotropic margin to the breath-hold gross tumor volume (purple). B, Real-time two-dimensional motion tracking of the gross tumor volume (green) in one of the patients, which is performed by using two-dimensional images acquired in sagittal orientation every 250 msec and deformable image registration. During delivery, the beam is automatically turned off when a specified proportion of the gross tumor volume is outside the gating window (red). In B, on the left-hand image the full gross tumor volume is contained within the gating window, whereas on the right-hand image, about 75% of the gross tumor volume is outside the gating window. Modified, with permission, from reference 30.
Figure 6:
Single-fraction motion-gated lung stereotactic ablative radiation therapy by using the ViewRay 0.35-T MRI-guided linear accelerator system. A, Treatment plan for the first three patients, where one fraction of 34 Gy is delivered to the planning target volume (red). The planning target volume is created by adding a 5-mm isotropic margin to the breath-hold gross tumor volume (purple). B, Real-time two-dimensional motion tracking of the gross tumor volume (green) in one of the patients, which is performed by using two-dimensional images acquired in sagittal orientation every 250 msec and deformable image registration. During delivery, the beam is automatically turned off when a specified proportion of the gross tumor volume is outside the gating window (red). In B, on the left-hand image the full gross tumor volume is contained within the gating window, whereas on the right-hand image, about 75% of the gross tumor volume is outside the gating window. Modified, with permission, from reference .
Real-time volumetric liver tumor motion tracking by using the MR Signature Matching technique for two representative sections. The tumor contour is shown in red. The motion-signal row shows the temporal location (green point) in the respiratory motion signal. Total imaging latency including data acquisition and image reconstruction for each three-dimensional image is about 250 msec. Access to real-time volumetric motion information would in principle allow continuous adaptation of the radiation beam to the tumor motion.
Figure 7:
Real-time volumetric liver tumor motion tracking by using the MR Signature Matching technique for two representative sections. The tumor contour is shown in red. The motion-signal row shows the temporal location (green point) in the respiratory motion signal. Total imaging latency including data acquisition and image reconstruction for each three-dimensional image is about 250 msec. Access to real-time volumetric motion information would in principle allow continuous adaptation of the radiation beam to the tumor motion.
General idea for real-time three-dimensional MRI-guided intrafraction adaptive-to-shape treatment. A fast three-dimensional (3D) MRI technique will provide the volumetric position and shape of the target, which will be streamed to the multileaf collimator (MLC) controller. The MLC controller will adapt to the volumetric position and shape by moving the multiple leaves. The tracking latency (ie, the time from the start of image acquisition to the end of multileaf collimator movement) is provided by the sum of imaging latency (including acquisition, reconstruction, and segmentation) and multileaf collimator latency. Developments in fast three-dimensional MRI are aimed at minimizing the imaging latency for real-time three-dimensional adaptation.
Figure 8:
General idea for real-time three-dimensional MRI-guided intrafraction adaptive-to-shape treatment. A fast three-dimensional (3D) MRI technique will provide the volumetric position and shape of the target, which will be streamed to the multileaf collimator (MLC) controller. The MLC controller will adapt to the volumetric position and shape by moving the multiple leaves. The tracking latency (ie, the time from the start of image acquisition to the end of multileaf collimator movement) is provided by the sum of imaging latency (including acquisition, reconstruction, and segmentation) and multileaf collimator latency. Developments in fast three-dimensional MRI are aimed at minimizing the imaging latency for real-time three-dimensional adaptation.
Chemical exchange saturation transfer (CEST) MRI can noninvasively help to predict histopathologic characteristics to help identify patients who are more radiosensitive and can therefore potentially be used to adapt treatment. For example, CEST helped to predict the status of isocitrate dehydrogenase (IDH) mutation in patients with recently diagnosed untreated glioma. A, B, Amide proton transfer (APT) and downfield nuclear Overhauser effect (NOE)-suppressed (dns) APT (dns-APT) CEST metrics allowed prediction of isocitrate dehydrogenase mutation status with highest area under the curve (AUC) for the dns APT90 metric (metric, 0.98) and a test sensitivity and specificity of 0.95 (95% CI: 0.77, 1.00) and 1.00 (95% CI: 0.59, 1.00), respectively (P < .001). Two example patients with newly diagnosed glioblastoma IDH-wt (c1–g1) and IDH-mut (c2–g2) are shown. C1 shows gadolinium contrast-enhanced (Gdce) T1-weighted (T1-w) MRI scans, and d1 shows T2-weighted (T2-w; turbo spin echo), relaxation-compensated multipool CEST MRI at 7.0-T with (e1) separated APT, NOE (f1), and dns-APT (g1) effects. A ring-like hyperintensity can be delineated in the periphery of the IDH-wt glioblastoma at dns-APT imaging (g1, white arrow), whereas the IDH-mut glioblastoma appears barely hyperintense at dns-APT (g2, white arrow). The head of the caudate nucleus also appears hyperintense on dns-APT images (g2, pink arrows). White arrows indicate the location of the tumor. Reprinted, with permission, from reference 62.
Figure 9:
Chemical exchange saturation transfer (CEST) MRI can noninvasively help to predict histopathologic characteristics to help identify patients who are more radiosensitive and can therefore potentially be used to adapt treatment. For example, CEST helped to predict the status of isocitrate dehydrogenase (IDH) mutation in patients with recently diagnosed untreated glioma. A, B, Amide proton transfer (APT) and downfield nuclear Overhauser effect (NOE)-suppressed (dns) APT (dns-APT) CEST metrics allowed prediction of isocitrate dehydrogenase mutation status with highest area under the curve (AUC) for the dns APT90 metric (metric, 0.98) and a test sensitivity and specificity of 0.95 (95% CI: 0.77, 1.00) and 1.00 (95% CI: 0.59, 1.00), respectively (P < .001). Two example patients with newly diagnosed glioblastoma IDH-wt (c1–g1) and IDH-mut (c2–g2) are shown. C1 shows gadolinium contrast-enhanced (Gdce) T1-weighted (T1-w) MRI scans, and d1 shows T2-weighted (T2-w; turbo spin echo), relaxation-compensated multipool CEST MRI at 7.0-T with (e1) separated APT, NOE (f1), and dns-APT (g1) effects. A ring-like hyperintensity can be delineated in the periphery of the IDH-wt glioblastoma at dns-APT imaging (g1, white arrow), whereas the IDH-mut glioblastoma appears barely hyperintense at dns-APT (g2, white arrow). The head of the caudate nucleus also appears hyperintense on dns-APT images (g2, pink arrows). White arrows indicate the location of the tumor. Reprinted, with permission, from reference .

References

    1. Thompson MK, Poortmans P, Chalmers AJ, et al. Practice-changing radiation therapy trials for the treatment of cancer: where are we 150 years after the birth of Marie Curie? Br J Cancer 2018;119(4):389–407. - PMC - PubMed
    1. Tyagi N, Fontenla S, Zelefsky M, et al. Clinical workflow for MR-only simulation and planning in prostate. Radiat Oncol 2017;12(1):119. - PMC - PubMed
    1. Chen AM, Hsu S, Lamb J, et al. MRI-guided radiotherapy for head and neck cancer: initial clinical experience. Clin Transl Oncol 2018;20(2):160–168. - PubMed
    1. Hunt A, Hansen VN, Oelfke U, Nill S, Hafeez S. Adaptive Radiotherapy Enabled by MRI Guidance. Clin Oncol (R Coll Radiol) 2018;30(11):711–719. - PubMed
    1. Mutic S, Dempsey JF. The ViewRay system: magnetic resonance-guided and controlled radiotherapy. Semin Radiat Oncol 2014;24(3):196–199. - PubMed

Publication types

MeSH terms