. 2020 Dec 22:9:e64389.
doi: 10.7554/eLife.64389.

In vitro reconstitution of dynamically interacting integral membrane subunits of energy-coupling factor transporters

Affiliations

In vitro reconstitution of dynamically interacting integral membrane subunits of energy-coupling factor transporters

Inda Setyawati et al. Elife. .

Abstract

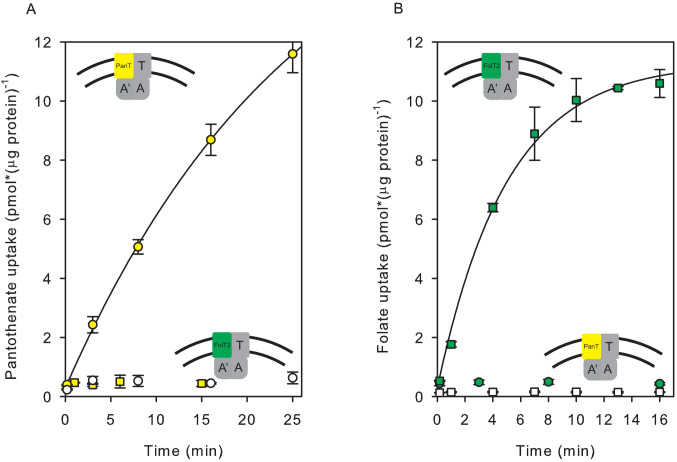
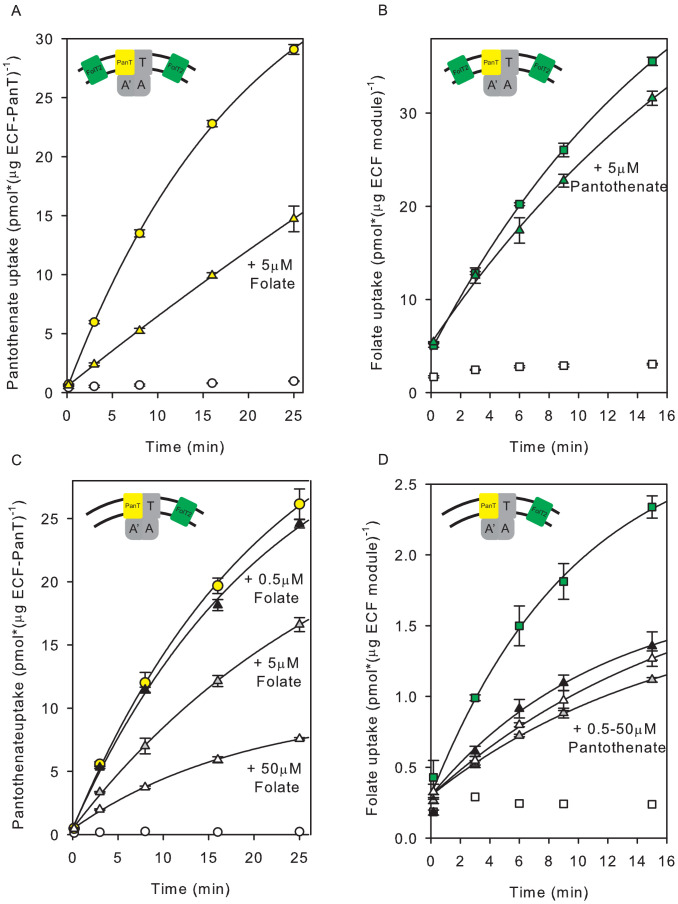
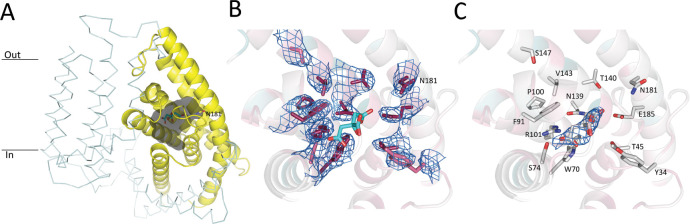
Energy-coupling factor (ECF) transporters mediate import of micronutrients in prokaryotes. They consist of an integral membrane S-component (that binds substrate) and ECF module (that powers transport by ATP hydrolysis). It has been proposed that different S-components compete for docking onto the same ECF module, but a minimal liposome-reconstituted system, required to substantiate this idea, is lacking. Here, we co-reconstituted ECF transporters for folate (ECF-FolT2) and pantothenate (ECF-PanT) into proteoliposomes, and assayed for crosstalk during active transport. The kinetics of transport showed that exchange of S-components is part of the transport mechanism. Competition experiments suggest much slower substrate association with FolT2 than with PanT. Comparison of a crystal structure of ECF-PanT with previously determined structures of ECF-FolT2 revealed larger conformational changes upon binding of folate than pantothenate, which could explain the kinetic differences. Our work shows that a minimal in vitro system with two reconstituted transporters recapitulates intricate kinetics behaviour observed in vivo.

Keywords: ABC transporter; Lactobacillus delbrueckii; biochemistry; chemical biology; membrane transport; molecular biophysics; structural biology; vitamin uptake.


Conflict of interest statement

IS, WS, MM, LS, EP, JS, AG, DS No competing interests declared

Figures

Figure 1.
Figure 1.. Transport of [3H]pantothenate and [3H]folate into proteoliposomes.
(A) Yellow and white circles: Pantothenate uptake by ECF-PanT into proteoliposomes containing 10 mM Mg2+-ATP or Mg2+-ADP in the lumen, respectively; Yellow squares: Pantothenate uptake by ECF-FolT2 into proteoliposomes containing 10 mM Mg-ATP in the lumen. (B) Green and white squares: Folate uptake by ECF-FolT2 into proteoliposomes containing 10 mM Mg2+-ATP or Mg2+-ADP in the lumen, respectively; Green circles: Folate uptake by ECF-PanT into proteoliposomes containing 10 mM Mg2+-ATP in the lumen. Error bars indicate standard deviation of triplicate measurements. The insets show schematic representations of the reconstituted systems used. FolT2 and PanT are coloured in green and yellow, respectively. The shared ECF module is shown in grey. The membrane boundaries are indicated by the two black lines. In Figures 3–5 we use similar cartoons, and yellow and green symbols indicating pantotenate and folate uptake, respectively, with circles and squares indicating that the uptake was mediated by ECF-PanT and ECF-FolT2, respectively.
Figure 2.
Figure 2.. Determination of apparent Km and Vmax values for pantothenate and folate transport.
(A,C) Initial rates of pantothenate transport by ECF-PanT into proteoliposomes as function of the pantothenate concentration (panel A, Mg2+-ATP concentration 5 mM) or the ATP concentration (panel C, pantothenate concentration 100 nM). The apparent Km and Vmax values in the pantothenate-dependent measurements are 46 ± 11 nM and 2.2 ± 0.12 nmol/mg/min, respectively. For the ATP-dependent measurements 5.6 ± 1.0 mM and 4.4 ± 0.5 nmol/mg/min, respectively. (B,D) Initial rates of folate transport by ECF-FolT2 into proteoliposomes as function of the folate concentration (panel B, Mg2+-ATP concentration 10 mM) or the ATP concentration (panel D, folate concentration 100 nM). The apparent Km and Vmax values in the folate-dependent measurements are 82 ± 20 nM and 0.93 ± 0.1 nmol/mg/min, respectively. For the ATP- dependent measurements 5.6 ± 1.7 mM and 0.5 ± 0.1 nmol/mg/min, respectively. Error bars indicate standard deviation of triplicate measurements.
Figure 3.
Figure 3.. Exchanges of S-components in proteoliposomes reconstituted with complete and incomplete transporters.
(A) Folate uptake into proteoliposomes reconstituted with FolT2 alone (green circles), or FolT2 in combination with ECF-PanT (green squares, molar ratio 26:1). (B) Pantothenate uptake into proteoliposomes reconstituted with PanT alone (yellow inverted triangles), or PanT in combination with ECF-FolT2 (Yellow circles). Since PanT was not very stable in detergent solution, the exact molar ratio in the combined reconstitution is unknown but likely to be much lower than in the experiment presented in panel A. The low amount of PanT could explain the reduced uptake rate. In all cases, 10 mM Mg2+-ATP was present in the lumen. Error bars indicate standard deviation of triplicate measurements, apart from panel B, where the experiment was done in duplicate.
Figure 3—figure supplement 1.
Figure 3—figure supplement 1.. Pantothenate uptake into proteoliposomes reconstituted with FolT2 in combination with ECF-PanT.
Figure 4.
Figure 4.. Transport of pantothenate and folate into proteoliposomes co-reconstituted with two full complexes one of which contained an ECF module with E-to-Q mutations in the Walker B motifs.
In the cartoon insets, red crosses indicate the mutated ECF modules. (A) Folate uptake into proteoliposomes co-reconstituted with ECF-PanT and ECF(E-to-Q)-FolT2, containing 10 mM Mg2+-ATP (green squares) or Mg2+-ADP in the lumen (white squares), respectively; Green inverted triangles: Folate uptake into proteoliposomes reconstituted with only ECF(E-to-Q)-FolT2, containing 10 mM Mg2+-ATP in the lumen, respectively;. (B) Pantothenate uptake into proteoliposomes co-reconstituted with ECF-FolT2 and ECF(E-to-Q)-PanT, containing 10 mM Mg2+-ATP (yellow circles) or Mg2+-ADP (white circles) in the lumen, respectively; Yellow inverted triangles: Pantothenate uptake by into proteoliposomes reconstituted with only ECF(E-to-Q)-PanT, containing 10 mM Mg2+-ATP in the lumen. Error bars indicate standard deviation of triplicate measurements.
Figure 4—figure supplement 1.
Figure 4—figure supplement 1.. Control experiments for the ones shown in Figure 4, now with the two substrates swapped.
(A) Pantothonate uptake into proteoliposomes co-reconstituted with ECF-PanT and ECF(E-to-Q)-FolT2, containing 10 mM Mg2+-ATP (yellow circles) or Mg2+-ADP in the lumen (white circles), respectively. (B) Folate uptake by into proteoliposomes co-reconstituted with ECF-FolT2 and ECF(E-to-Q)-PanT, containing 10 mM Mg2+-ATP (green squares) or Mg2+-ADP (white circles) in the lumen, respectively. Error bars indicate standard deviation of triplicate measurements.
Figure 5.
Figure 5.. Inhibition of pantothenate uptake by folate and vice versa in proteoliposomes co-reconstituted with ECF-PanT and FolT2.
(A, B) Uptake of radiolabelled pantothenate (A) and folate (B) into proteoliposomes co-reconstituted with ECF-PanT in protein-to-lipid ratio 1:1000 (w:w) and solitary FolT2 in ratio 1:250 (w:w), and loaded with 10 mM Mg2+-ATP (coloured symbols) or Mg2+-ADP (white symbols). Triangles: same as the conditions used for the black circles, but in the presence of 5 µM unlabelled folate (panel A) or pantothenate (panel B) as competing substrate. (C, D) same as panels A,B, but with reduced amount of FolT2 reconstituted (protein-to-lipid ratio 1:1000 (w:w) for both solitary FolT2 and ECF-PanT). The competing substrates were added at three different concentrations: 50 µM (white triangles), 5 µM (grey triangles) and 0.5 µM (black triangles). Error bars indicate standard deviation of triplicate measurements.
Figure 5—figure supplement 1.
Figure 5—figure supplement 1.. Lack of inhibition of radiolabelled pantothenate uptake by unlabelled folate in proteoliposomes containing only ECF-PanT.
Yellow and white circles: Pantothenate uptake by ECF-PanT into proteoliposomes containing 10 mM Mg2+-ATP or Mg2+-ADP in the lumen (as in Figure 1), respectively; yellow and white triangles: same in the presence of unlabelled folate.
Figure 6.
Figure 6.. Crystal structure of nanobody-bound ECF-PanT.
(A) Overall structure with two ECF-PanT complexes (in surface representation) bridged by the nanobody (in secondary structure cartoon representation). EcfA in orange, EcfA’ in light pink, EcfT in cyan, PanT in yellow, nanobody 81 in green. (B) Comparison of the conformations of the membrane domains of EcfT in the structures of ECF-PanT (same colours as in panel A), and ECF-FolT2 (in grey, PDB 5JSZ). The structures were aligned on the ATPase domains which are not shown for clarity, see Figure 6—figure supplements 3 and 4. EcfT proteins are shown in secondary structure cartoon representation, the S-components in surface representation. (C and D) Comparison of the conformations of the S-components in the structures of ECF-PanT (PanT in rainbow from blue at the N-terminus to red at the C-terminus), and ECF-FolT2 (FolT2 in grey). EcfT from the ECF-PanT structure is shown in ribbon representation. The approximate positions of the membrane boundaries are indicated. Membrane helices are numbered, the ones from FolT2 with an added prime. The differences in membrane orientation of helix 3 (panel C) and helix 5 (panel D) are indicated by the dashed lines.
Figure 6—figure supplement 1.
Figure 6—figure supplement 1.. Crystal packing of nanobody-bound ECF-PanT.
The nanobody is represented in green secondary structure cartoon representation, and the two ECF-PanT complexes in the centre in colourful surface representation with EcfA (orange), EcfA’ (light pink), EcfT (cyan), and PanT (yellow). The surrounding ECF-PanT molecules are in grey surface. It is highlighted that the nanobodies play a role in forming contacts within the asymmetric unit instead of forming crystal contacts. The crystal contacts are mediated by EcfA’ and EcfT interactions.
Figure 6—figure supplement 2.
Figure 6—figure supplement 2.. Shifted elution volume of ECF-PanT in gel filtration chromatography, black and blue traces are in the absence and presence of nanobody, respectively.
Figure 6—figure supplement 3.
Figure 6—figure supplement 3.. Structural alignment of nanobody-bound ECF-PanT and ECF-FolT2 (PDB 5JSZ).
Colours: EcfA (orange), EcfA’ (light pink), EcfT (cyan), and PanT (yellow), nanobody (green), ECF-FolT2 (grey).
Figure 6—figure supplement 4.
Figure 6—figure supplement 4.. Structural alignment of the ATPase subunits in ECF-PanT (EcfA in orange), (EcfA’ in light pink) and ECF-FolT2 (grey, PDB 5JSZ).
The ATPases are in an open conformation, as discussed in previous work (Swier et al., 2016).
Figure 6—figure supplement 5.
Figure 6—figure supplement 5.. Structural alignment of the coupling helices in ECF-PanT and ECF-FolT2 (PDB 5JSZ).
Colours: EcfA (orange), EcfA’ (light pink), EcfT (cyan), and PanT (yellow), nanobody (green), ECF-FolT2 (grey). Coupling helices in secondary structure cartoon representation, rest of the structures in transparent surface representation.
Figure 7.
Figure 7.. Pantothenate binding pocket in ECF-PanT.
(A) Binding pocket (grey) of the PanT (yellow, secondary structure cartoon) EcfT is shown in ribbon representation, ATPases are not shown for clarity. The approximate positions of the membrane boundaries are indicated. The modelled citrate molecule is shown in stick representation. (B) Electron 2Fo-Fc density contoured at 1.0 σ for conserved residues in the binding pocket. Colouring of the side chains according to conservation as calculated by the Consurf server (Landau et al., 2005). Dark purple indicates highly conserved residues. The modelled citrate molecule is shown in stick representation with carbon atoms in cyan and oxygen atoms in red. (C) Electron 2Fo-Fc density contoured at 1.0 σ for modelled citrate molecule in the binding pocket.

References

    1. Adams PD, Afonine PV, Bunkóczi G, Chen VB, Davis IW, Echols N, Headd JJ, Hung LW, Kapral GJ, Grosse-Kunstleve RW, McCoy AJ, Moriarty NW, Oeffner R, Read RJ, Richardson DC, Richardson JS, Terwilliger TC, Zwart PH. PHENIX: a comprehensive Python-based system for macromolecular structure solution. Acta Crystallographica Section D Biological Crystallography. 2010;66:213–221. doi: 10.1107/S0907444909052925. - DOI - PMC - PubMed
    1. Berntsson RP, ter Beek J, Majsnerowska M, Duurkens RH, Puri P, Poolman B, Slotboom DJ. Structural divergence of paralogous S components from ECF-type ABC transporters. PNAS. 2012;109:13990–13995. doi: 10.1073/pnas.1203219109. - DOI - PMC - PubMed
    1. Birkner JP, Poolman B, Koçer A. Hydrophobic gating of mechanosensitive channel of large conductance evidenced by single-subunit resolution. PNAS. 2012;109:12944–12949. doi: 10.1073/pnas.1205270109. - DOI - PMC - PubMed
    1. Casadaban MJ, Cohen SN. Analysis of gene control signals by DNA fusion and cloning in Escherichia coli. Journal of Molecular Biology. 1980;138:179–207. doi: 10.1016/0022-2836(80)90283-1. - DOI - PubMed
    1. Chen C, Malek AA, Wargo MJ, Hogan DA, Beattie GA. The ATP-binding cassette transporter cbc (choline/betaine/carnitine) recruits multiple substrate-binding proteins with strong specificity for distinct quaternary ammonium compounds. Molecular Microbiology. 2010;75:29–45. doi: 10.1111/j.1365-2958.2009.06962.x. - DOI - PMC - PubMed

Publication types

MeSH terms

Substances

LinkOut - more resources