. 2021 Jan 21;21(2):435-446.
doi: 10.1039/d0lc00981d. Epub 2020 Dec 22.

A 3D human adipose tissue model within a microfluidic device

Affiliations

A 3D human adipose tissue model within a microfluidic device

Feipeng Yang et al. Lab Chip. .

Abstract

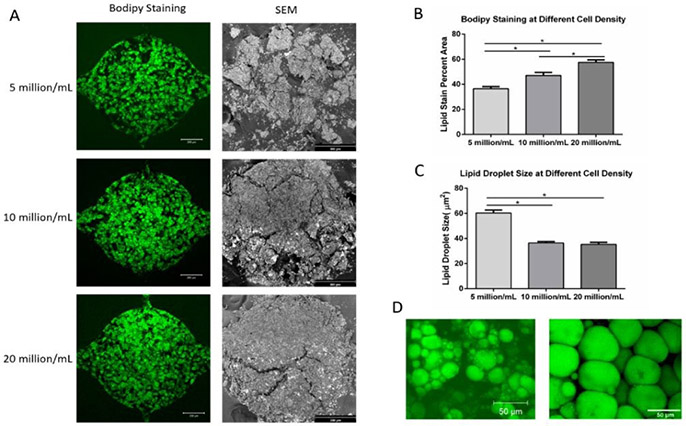
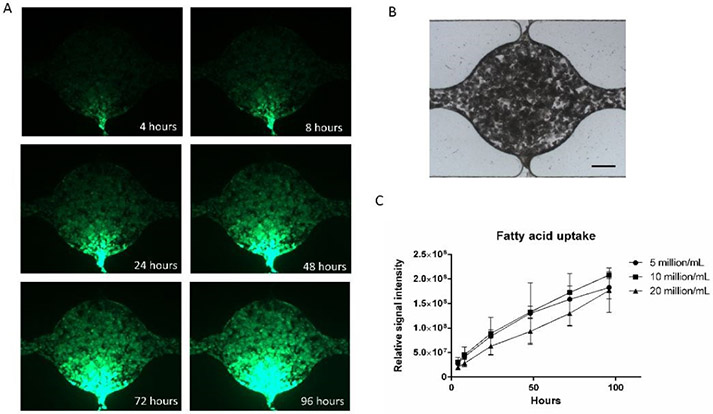
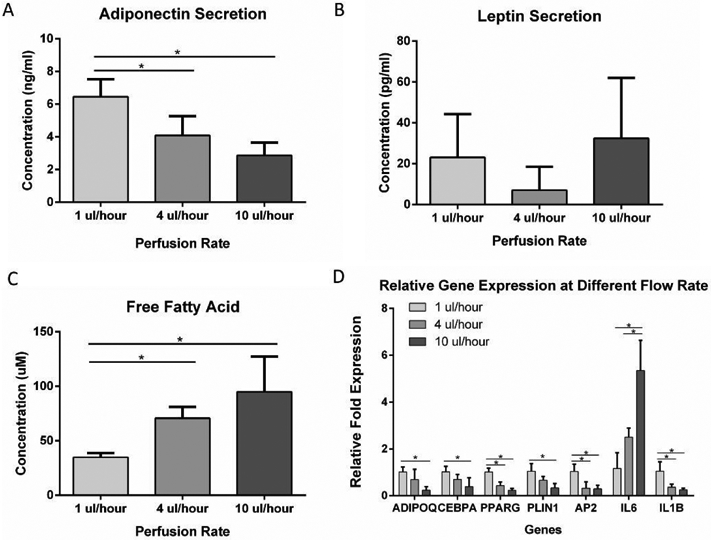
An accurate in vitro model of human adipose tissue could assist in the study of adipocyte function and allow for better tools for screening new therapeutic compounds. Cell culture models on two-dimensional surfaces fall short of mimicking the three-dimensional in vivo adipose environment, while three-dimensional culture models are often unable to support long-term cell culture due, in part, to insufficient mass transport. Microfluidic systems have been explored for adipose tissue models. However, current systems have primarily focused on 2D cultured adipocytes. In this work, a 3D human adipose microtissue was engineered within a microfluidic system. Human adipose-derived stem cells (ADSCs) were used as the cell source for generating differentiated adipocytes. The ADSCs differentiated within the microfluidic system formed a dense lipid-loaded mass with the expression of adipose tissue genetic markers. Engineered adipose tissue showed a decreased adiponectin secretion and increased free fatty acid secretion with increasing shear stress. Adipogenesis markers were downregulated with increasing shear stress. Overall, this microfluidic system enables the on-chip differentiation and development of a functional 3D human adipose microtissue supported by the interstitial flow. This system could potentially serve as a platform for in vitro drug testing for adipose tissue-related diseases.


Conflict of interest statement

Conflicts of interest

There are no conflicts to declare.

Figures

Figure 1.
Figure 1.. Microfluidic system design and assembly.
(A) Microfluidic device consists of two fluidic channels (port a-b, c-d) separated by 5 cell culture chambers (e-f). (B) Assembly of the microfluidic device. (C) Assembled microfluidic device with four reservoirs. (D) Dimensions of the cell culture chamber and fluidic channels measured from microscopic image.
Figure 2.
Figure 2.. Simulation modeling results from the microfluidic device.
(A) Overview of flow direction and velocity distribution in both the side channels and central chambers using the syringe pump setup. (B) Colormap of the flow velocity distribution in cell culture chambers with 1 μl/hour medium input. (C) Flow velocities in the central chamber cross-section at different syringe pump volumetric flow rates. (D) Velocity in the X-direction in cell culture chambers. (E) Hydrostatic pressure in the X-direction. (F) Top view flow velocity in the five chambers at different syringe pump volumetric flow rates. (G) Velocity in the Z-direction in cell culture chambers. (H) Hydrostatic pressure in the Z-direction across the 5 cell culture chambers.
Figure 3.
Figure 3.. Live/Dead assay of ADSCs in the microfluidic device.
(A) Cell viability at 2 hours, 2 days, 4 days, and 6 days after loading to cell culture chambers. (B) Live cell ratio at different time points. Values are means ± SD, n = 10 or 14. One-way ANOVA followed by Tukey’s multiple comparisons test was performed.
Figure 4.
Figure 4.. ADSCs differentiation within the microfluidic device.
(A) Brightfield and BODIPY staining images of cells at week 1 through week 3. (B) BODIPY staining quantification showed increased lipid loading through the course of 3 weeks. Values are means ± SD, n = 9 or 10. (C) Lipid droplet size at different time points during adipogenic differentiation. Values are means ± SD, n = 5. (D) Gene expression of adipocytes in microfluidic chambers at different time points. Values are means ± SD, n = 4 or 5. (E) Gene expression of adipocytes in microfluidic chambers with different densities. Values are means ± SD, n = 3 to 5. For all datasets, one-way ANOVA followed by Tukey’s multiple comparisons test was performed. *denotes significant difference (p < 0.05) between the marked groups.
Figure 5.
Figure 5.. BODIPY staining and SEM imaging of adipose tissue in the microfluidic device.
(A) BODIPY staining (left column, scale bar: 200 μm) and SEM images (right column, scale bar: 300 μm) of adipose tissue formed in the microfluidic devices at 4 weeks under three different cell densities. (B) BODIPY stain percent area of adipose tissue under different cell densities. (C) Lipid droplet size at different cell densities. (D) Lipid content of the adipocytes in microfluidic device (left) and of native adipose tissue (right, modified from Aubin, K et al. 2015). For all datasets, values are means ± SD, n = 5. One-way ANOVA followed by Tukey’s multiple comparisons test was performed. *denotes significant difference (p < 0.05) between the marked groups.
Figure 6.
Figure 6.. Adipose tissue fatty acid uptake in the microfluidic device.
(A) Fluorescent images of fatty acid uptake at different time points. (B) Bright-field image of the cell culture chamber (scale bar: 200 μm). (C) Quantification of fatty acid uptake at different ADSCs densities. Values are means ± SD, n = 5. One-way ANOVA followed by Tukey’s multiple comparisons test was performed.
Figure 7.
Figure 7.. Adipose tissue response to different shear stresses.
(A) Adiponectin secretion from adipose tissue in the microfluidic device at different perfusion rates. (B) Leptin secretion from adipose tissue in the microfluidic device at different perfusion rates. (C) Free fatty acid secretion from adipose tissue in the microfluidic device at different perfusion rates. (D) Gene expression of adipose tissue in the microfluidic device in response to different perfusion rates. For all datasets, values are means ± SD, n = 5. One-way ANOVA followed by Tukey’s multiple comparisons test was performed. *denotes significant difference (p < 0.05) between the marked groups.

References

    1. Luo L and Liu M, J. Endocrinol, 2016, 231, R77–R99. - PMC - PubMed
    1. Prieto-Hontoria PL, Pérez-Matute P, Fernández-Galilea M, Bustos M, Martínez JA and Moreno-Aliaga MJ, Biochim. Biophys. Acta - Bioenerg, 2011, 1807, 664–678. - PubMed
    1. Rosen ED and Spiegelman BM, Nature, 2006, 444, 847–853. - PMC - PubMed
    1. Percik R and Stumvoll M, Exp. Clin. Endocrinol. Diabetes, 2009, 117, 563–566. - PubMed
    1. Ungefroren H, Gieseler F, Fliedner S and Lehnert H, Horm. Mol. Biol. Clin. Investig, 2015, 21, 5–15. - PubMed

Publication types

LinkOut - more resources