

Variation in US Hospital Mortality Rates for Patients Admitted With COVID-19 During the First 6 Months of the Pandemic
- PMID: 33351068
- PMCID: PMC7756246
- DOI: 10.1001/jamainternmed.2020.8193
Variation in US Hospital Mortality Rates for Patients Admitted With COVID-19 During the First 6 Months of the Pandemic
Abstract
Importance: It is unknown how much the mortality of patients with coronavirus disease 2019 (COVID-19) depends on the hospital that cares for them, and whether COVID-19 hospital mortality rates are improving.
Objective: To identify variation in COVID-19 mortality rates and how those rates have changed over the first months of the pandemic.
Design, setting, and participants: This cohort study assessed 38 517 adults who were admitted with COVID-19 to 955 US hospitals from January 1, 2020, to June 30, 2020, and a subset of 27 801 adults (72.2%) who were admitted to 398 of these hospitals that treated at least 10 patients with COVID-19 during 2 periods (January 1 to April 30, 2020, and May 1 to June 30, 2020).
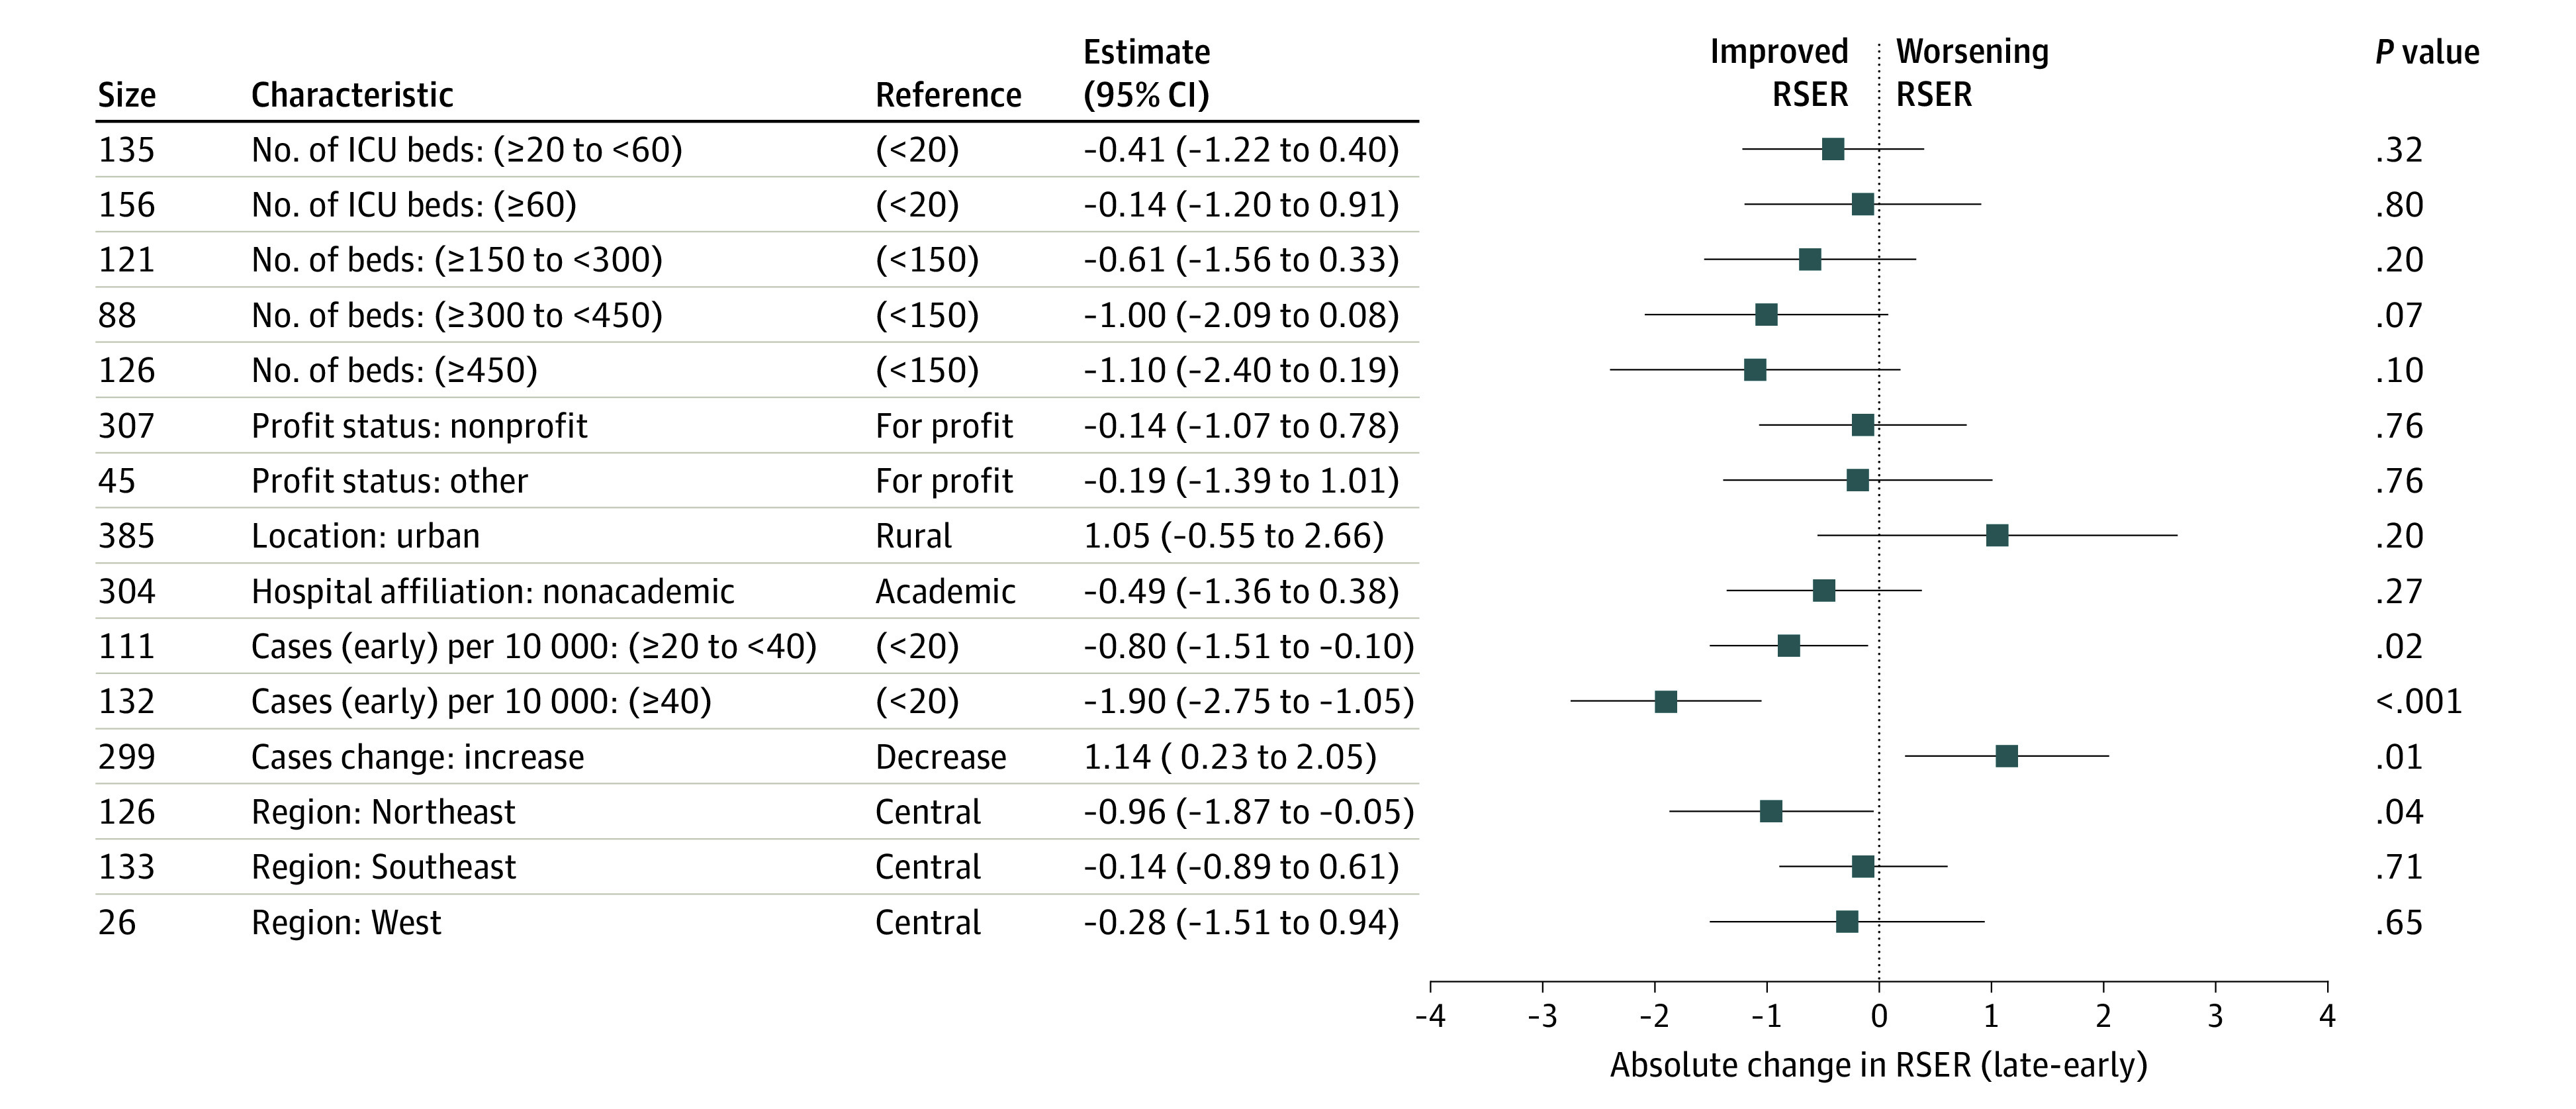
Exposures: Hospital characteristics, including size, the number of intensive care unit beds, academic and profit status, hospital setting, and regional characteristics, including COVID-19 case burden.
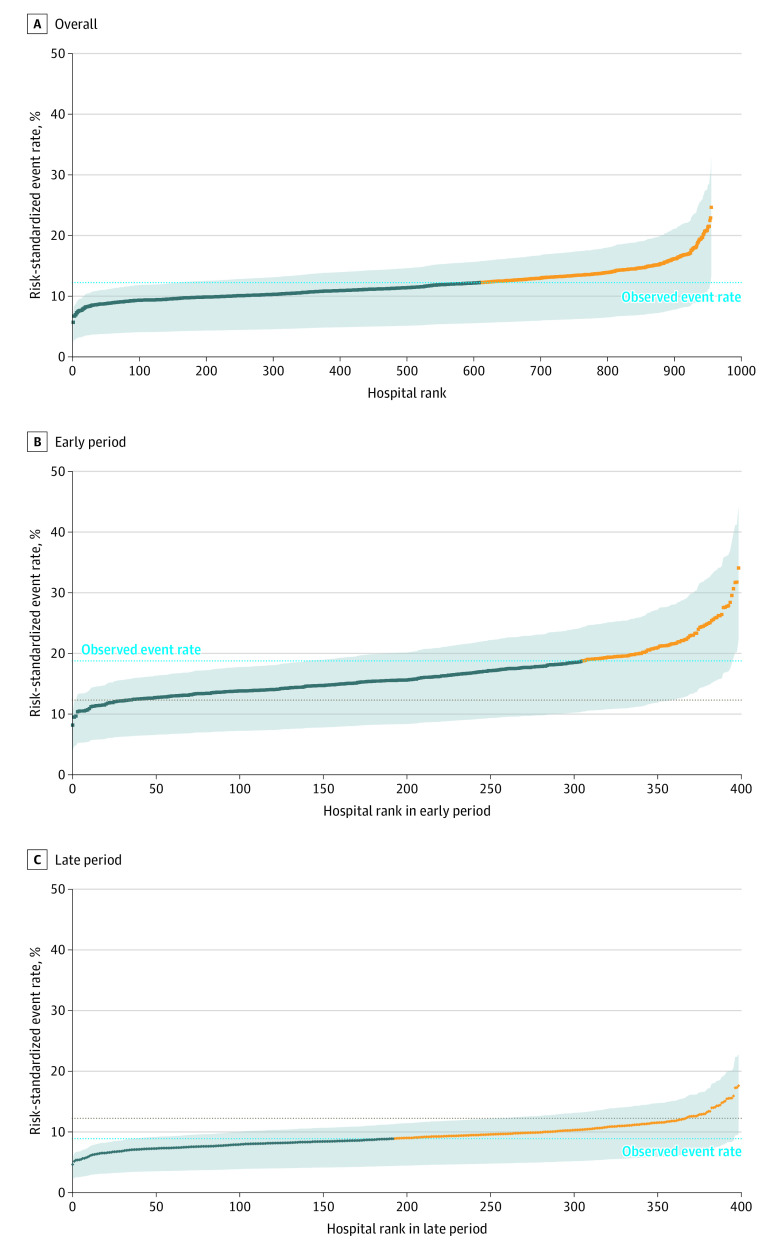
Main outcomes and measures: The primary outcome was the hospital's risk-standardized event rate (RSER) of 30-day in-hospital mortality or referral to hospice adjusted for patient-level characteristics, including demographic data, comorbidities, community or nursing facility admission source, and time since January 1, 2020. We examined whether hospital characteristics were associated with RSERs or their change over time.
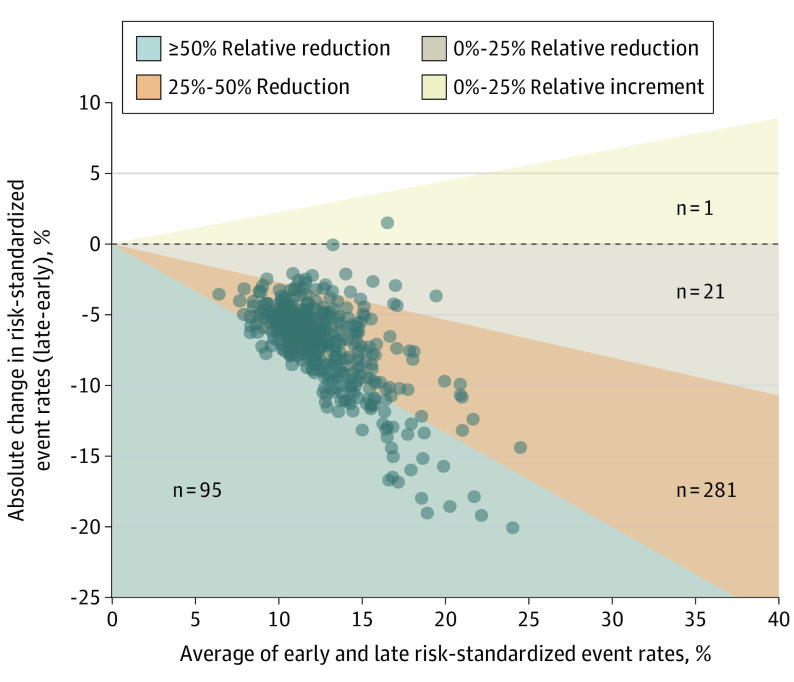
Results: The mean (SD) age among participants (18 888 men [49.0%]) was 70.2 (15.5) years. The mean (SD) hospital-level RSER for the 955 hospitals was 11.8% (2.5%). The mean RSER in the worst-performing quintile of hospitals was 15.65% compared with 9.06% in the best-performing quintile (absolute difference, 6.59 percentage points; 95% CI, 6.38%-6.80%; P < .001). Mean RSERs in all but 1 of the 398 hospitals improved; 376 (94%) improved by at least 25%. The overall mean (SD) RSER declined from 16.6% (4.0%) to 9.3% (2.1%). The absolute difference in rates of mortality or referral to hospice between the worst- and best-performing quintiles of hospitals decreased from 10.54 percentage points (95% CI, 10.03%-11.05%; P < .001) to 5.59 percentage points (95% CI, 5.33%-5.86%; P < .001). Higher county-level COVID-19 case rates were associated with worse RSERs, and case rate declines were associated with improvement in RSERs.
Conclusions and relevance: Over the first months of the pandemic, COVID-19 mortality rates in this cohort of US hospitals declined. Hospitals did better when the prevalence of COVID-19 in their surrounding communities was lower.
Conflict of interest statement
Figures
Comment in
-
Decreased COVID-19 Mortality-A Cause for Optimism.JAMA Intern Med. 2021 Apr 1;181(4):478-479. doi: 10.1001/jamainternmed.2020.8438. JAMA Intern Med. 2021. PMID: 33351074 No abstract available.
-
COVID-19 Mortality and Stress to the Hospital System From High Patient Load.JAMA Intern Med. 2021 Aug 1;181(8):1134. doi: 10.1001/jamainternmed.2021.0599. JAMA Intern Med. 2021. PMID: 33843959 No abstract available.
References
-
- American Hospital Association . AHA annual survey database. Accessed July 29, 2020. https://www.ahadata.com/aha-annual-survey-database
-
- US Centers for Medicare & Medicaid Services . FY 2020 final rule and correction notice data files. Accessed June 29, 2020. https://www.cms.gov/Medicare/Medicare-Fee-for-Service-Payment/AcuteInpat...
-
- US Centers for Medicare & Medicaid Services . 2019 POS file. Accessed September 4, 2020. https://www.cms.gov/research-statistics-data-systems/provider-services-c...
-
- New York Times . Date, county, state, fips, cases, deaths. Accessed November 1, 2020. https://raw.githubusercontent.com/nytimes/covid-19-data/master/us-counti...
-
- National Quality Forum . Measure evaluation criteria and guidance for evaluating measures for endorsement. Accessed September 1, 2019. http://www.qualityforum.org/docs/measure_evaluation_criterias.aspx
MeSH terms
Grants and funding
LinkOut - more resources
Full Text Sources
Medical
Miscellaneous
