. 2021 Jan 4;220(1):e202001116.
doi: 10.1083/jcb.202001116.

A selective transmembrane recognition mechanism by a membrane-anchored ubiquitin ligase adaptor

Affiliations

A selective transmembrane recognition mechanism by a membrane-anchored ubiquitin ligase adaptor

Felichi Mae Arines et al. J Cell Biol. .

Abstract

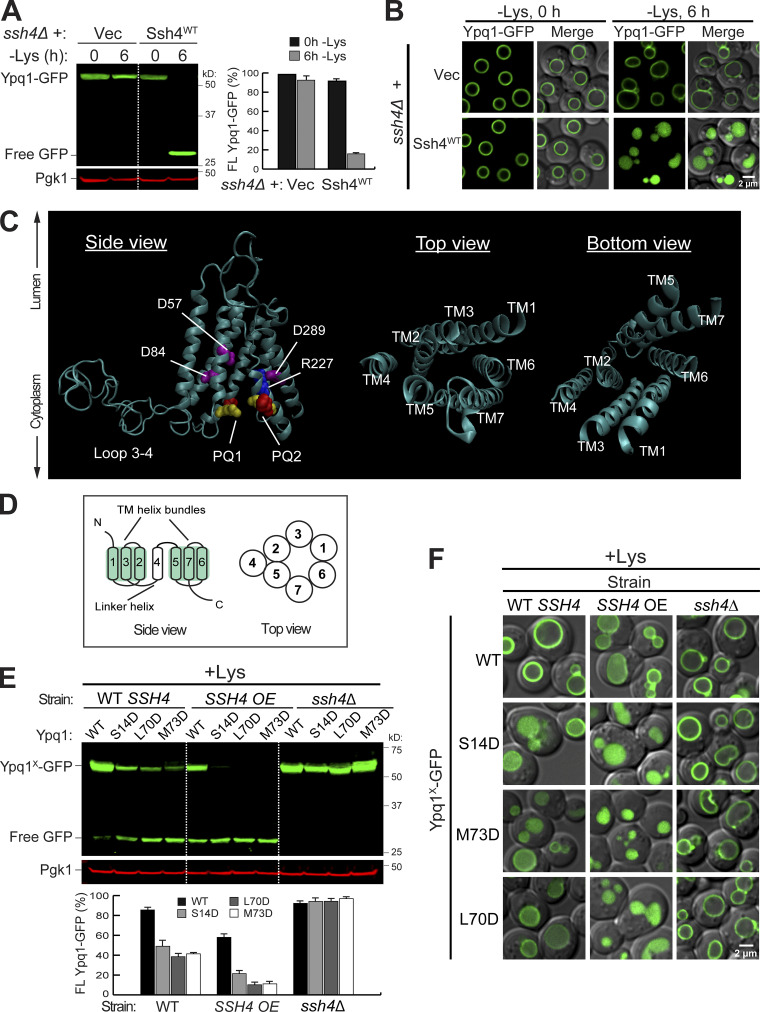
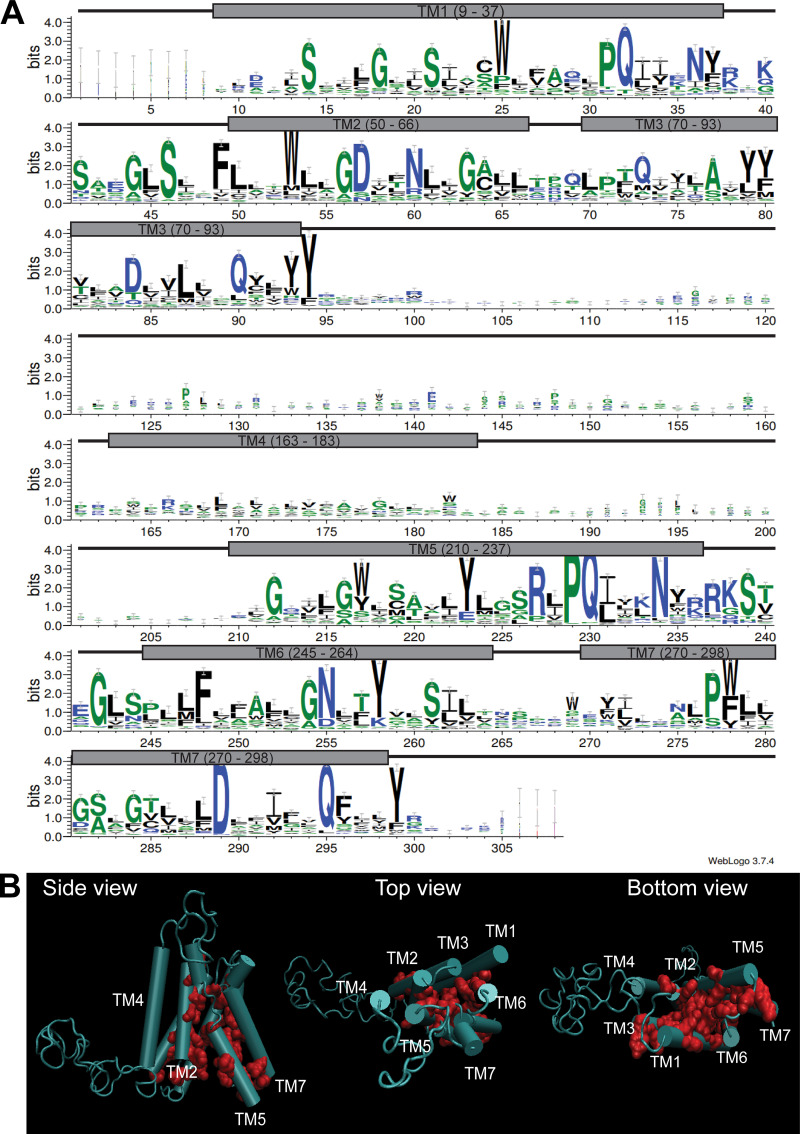
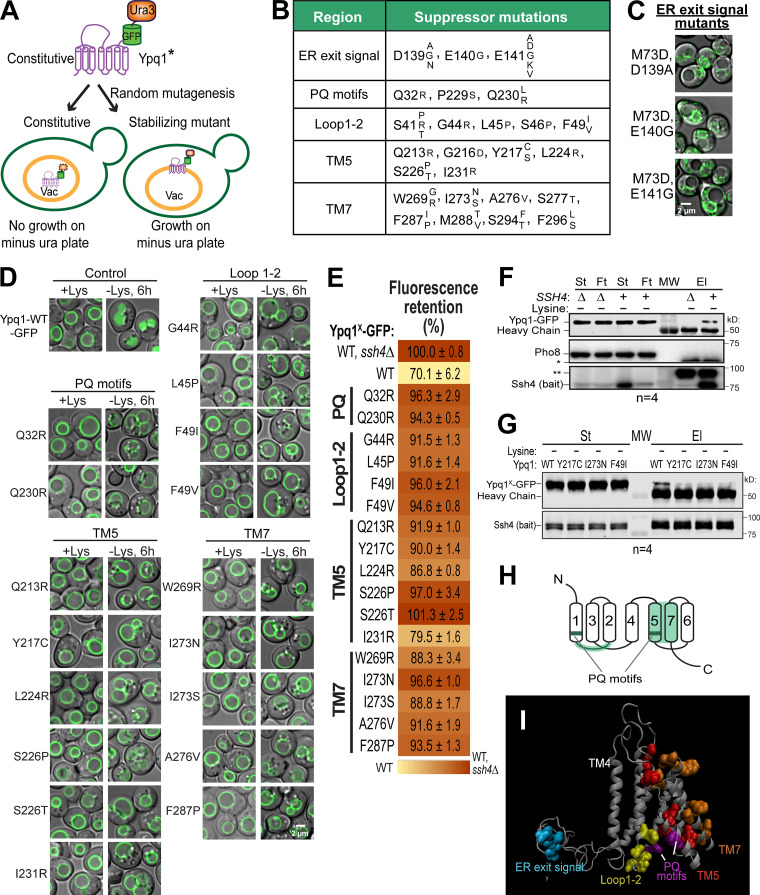
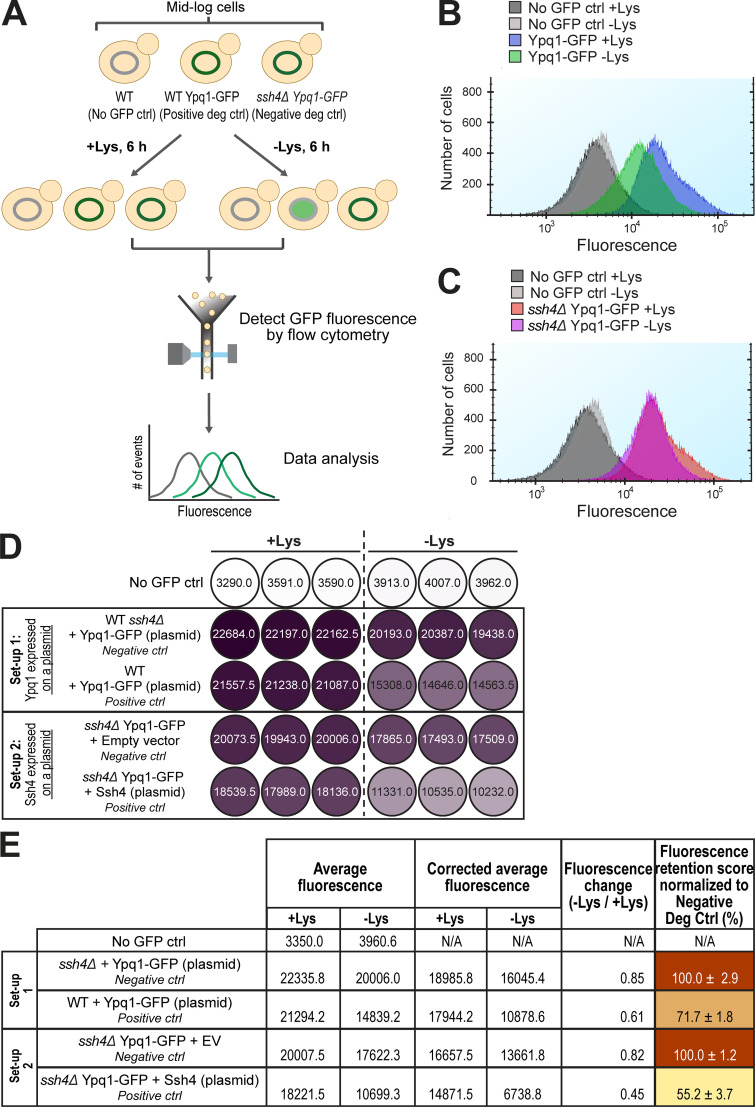
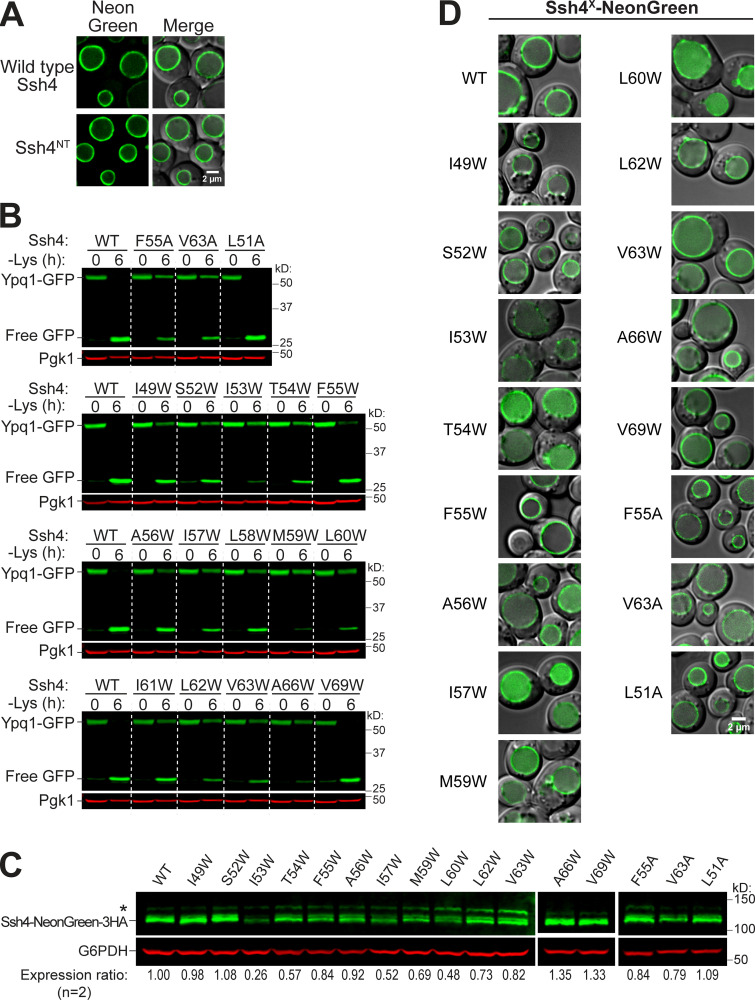
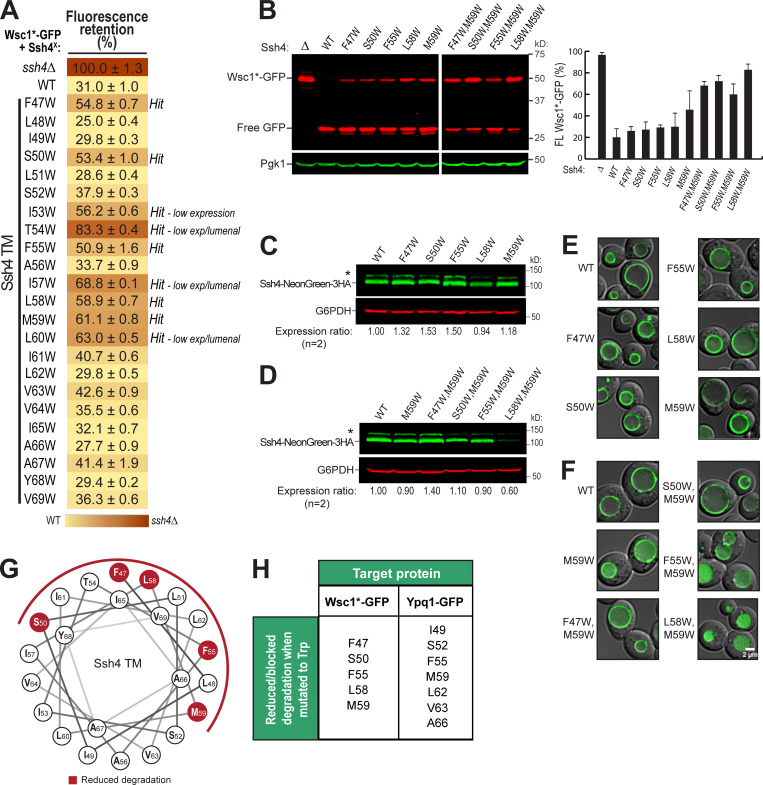
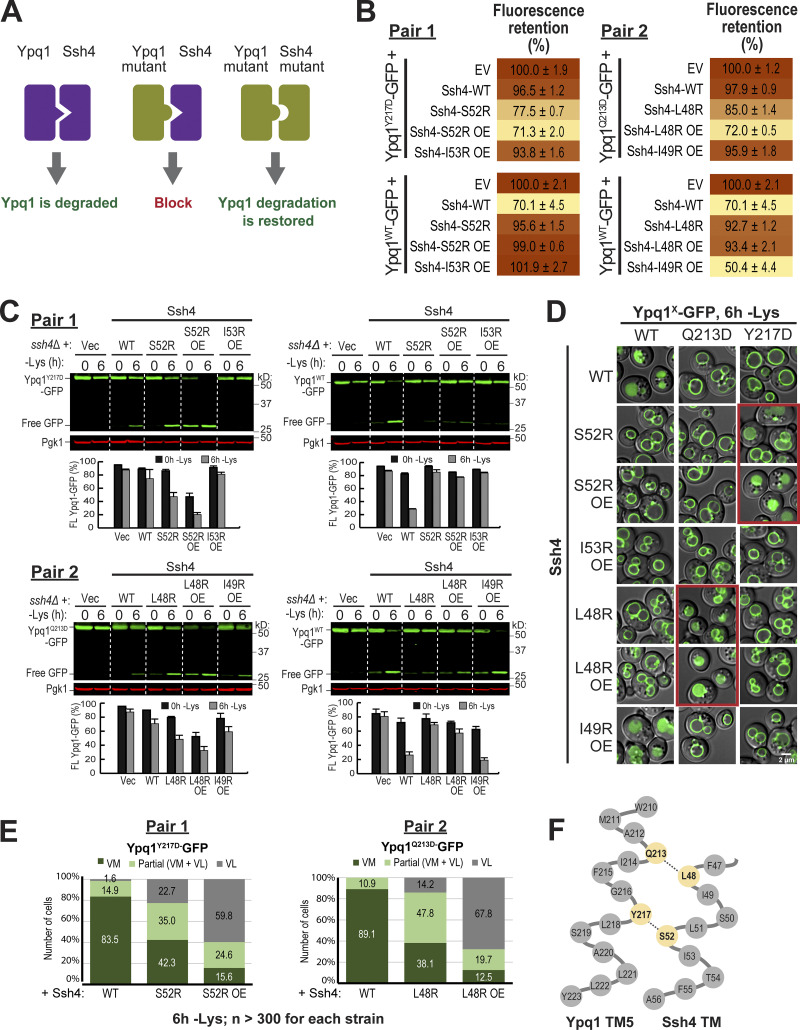
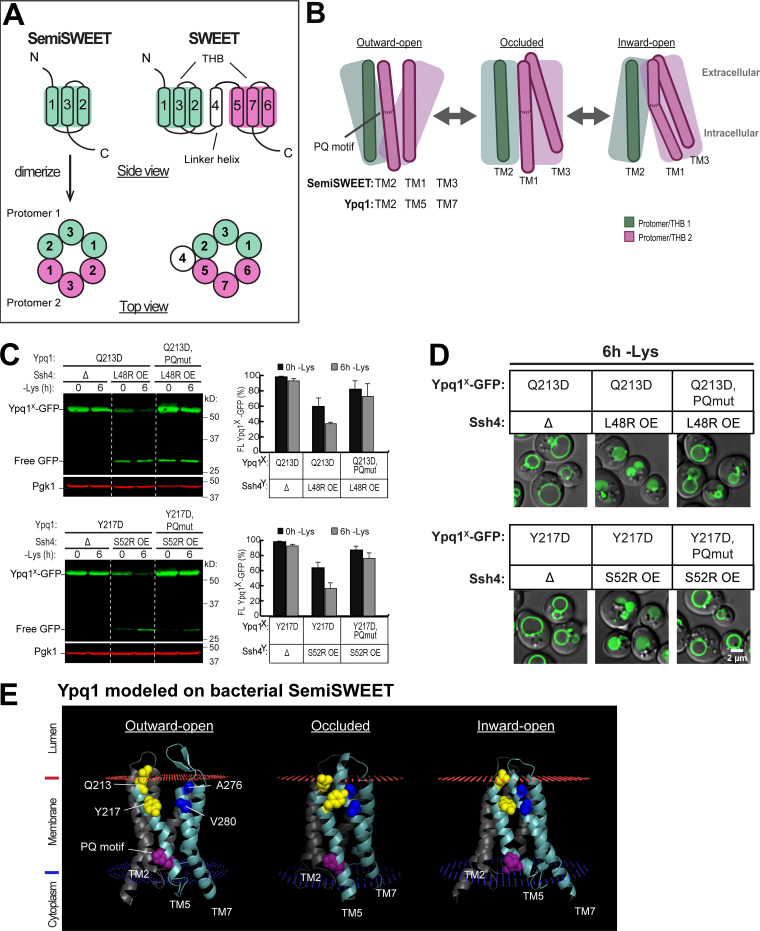
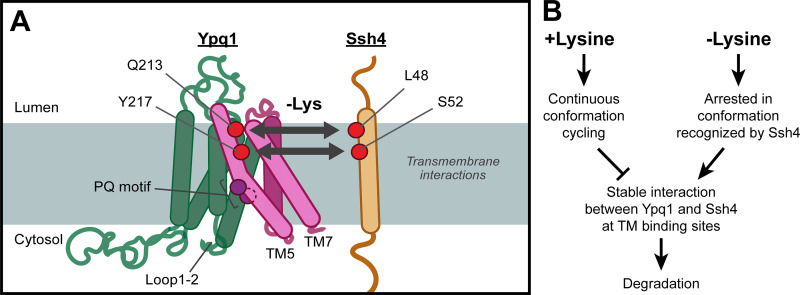
While it is well-known that E3 ubiquitin ligases can selectively ubiquitinate membrane proteins in response to specific environmental cues, the underlying mechanisms for the selectivity are poorly understood. In particular, the role of transmembrane regions, if any, in target recognition remains an open question. Here, we describe how Ssh4, a yeast E3 ligase adaptor, recognizes the PQ-loop lysine transporter Ypq1 only after lysine starvation. We show evidence of an interaction between two transmembrane helices of Ypq1 (TM5 and TM7) and the single transmembrane helix of Ssh4. This interaction is regulated by the conserved PQ motif. Strikingly, recent structural studies of the PQ-loop family have suggested that TM5 and TM7 undergo major conformational changes during substrate transport, implying that transport-associated conformational changes may determine the selectivity. These findings thus provide critical information concerning the regulatory mechanism through which transmembrane domains can be specifically recognized in response to changing environmental conditions.


Figures

Figure 1.
Figure 1.
Isolation of constitutively degrading Ypq1 mutants. (A) Left: Western blot showing degradation of Ypq1-GFP before (0 h) or after (6 h) Lys starvation. Vec, Empty vector. Pgk1, loading control. Right: Protein levels were quantified as FL Ypq1-GFP/(FL Ypq1-GFP + free GFP). The error bars represent SD (n = 3). FL, full-length. (B) Subcellular localization of Ypq1-GFP before and after Lys starvation. Scale bar, 2 µm. (C) Predicted structure of Ypq1 showing PQ motifs and charged residues within the translocation tunnel. In top and bottom views, loops have been removed for clarity. (D) General architecture of eukaryotic PQ-loop family members. (E) Top: Degradation of constitutive Ypq1 mutants under different expression levels of Ssh4: endogenous (WT SSH4), overexpression (SSH4 OE), and deletion (ssh4Δ). Bottom: Quantification (±SD, n = 3). (F) Subcellular localization of Ypq1-GFP mutants. Scale bar, 2 µm.
Figure S1.
Figure S1.
Validation of homology model using GREMLIN. Related to Fig. 1. (A) WebLogo representation of conserved residues on Ypq1 based on covariation analysis of 420 related eukaryotic sequences using GREMLIN. Gray boxes correspond to transmembrane helices, and black connecting lines correspond to loops. (B) Conserved residues mapped on the homology model of Ypq1.
Figure 2.
Figure 2.
A suppressor screen identified clusters on Ypq1 that are important in its degradation. (A) Design of the suppressor screen using constitutively degrading Ypq1 (*, S14D, L70D, or M73D). Vac, vacuole; Ura, uracil. (B) Summary of the genuine suppressor residues and their corresponding mutations. (C) Subcellular localization of Ypq1M73D-GFP-Ura3 with mutations on 139DEE141. Scale bar, 2 µm. (D) The suppressor mutations also blocked the Lys withdrawal-triggered Ypq1-GFP internalization. Scale bar, 2 µm. (E) Heat map of mutant Ypq1-GFP degradation defect based on flow cytometry. Negative control, Ypq1WT-GFP in ssh4Δ strain, defined as 100%. Positive control, Ypq1WT-GFP in WT strain. (F) CoIP of WT Ypq1-GFP with overexpressed PPxY mutant Ssh4 (bait) in Lys-starved conditions. Pho8, negative control; St, starting material; Ft, flow-through; El, elution; MW, molecular weight marker; * and **, nonspecific bands. (G) CoIP of Ypq1-GFP mutants with overexpressed PPxY mutant Ssh4 in Lys-starved conditions. (H) Critical regions on Ypq1 based on suppressor screen mapped on the conserved architecture of PQ-loop proteins. (I) Critical residues mapped on the 3D model of Ypq1. TM4 shown as a reference point.
Figure S2.
Figure S2.
Suppressor residues and flow cytometry-based method to quantify Ypq1-GFP degradation. Related to Fig. 2. (A) Workflow of flow cytometry–based degradation assay. Shown are several degradation controls (deg ctrl). (B) Fluorescence histogram of cells expressing Ypq1-GFP grown in the presence or absence of Lys. No GFP ctrl: WT SEY6210. (C) Fluorescence histogram of cells expressing Ypq1-GFP but lacking Ssh4 in the presence or absence of Lys. No GFP ctrl: WT SEY6210. (D) Heat map showing fluorescence (arbitrary units) in three replicates of no GFP control, negative control, and positive control in two experimental setups. Setup 1: Ypq1-GFP expressed in a plasmid, Ssh4 from the genomic locus. Setup 2: Ypq1 was chromosomally tagged with GFP and Ssh4 expressed in a plasmid. Darker colors correspond to higher fluorescence. (E) Step-by-step calculation used to generate heat map in Fig. 2 E. First column: Fluorescence values from three replicates were averaged. Second column: Fluorescence values were corrected by subtracting average fluorescence values of no GFP control strain. Third column: FC values were calculated by dividing the CAF at −Lys by the CAF at +Lys. Fourth column: Final FR scores were calculated by dividing the FC value of the sample with the FC value of the negative control. This sets the value of the negative control as 100%. Setup 1 had higher FR scores, possibly because the host strain contained the endogenous Ypq1 that might have “diluted” the degradation. N/A, not applicable.
Figure S3.
Figure S3.
CoIP of Ypq1 and Ssh4 in the presence of an Rsp5 mutant. Related to Fig. 2. (A) Degradation of Ypq1-GFP before (0 h) or after (6 h) Lys starvation in the presence of WT Rsp5 or rsp5G747E. (B) CoIP of Ypq1-GFP with WT Ssh4 (bait) expressed under its native promoter (PSSH4) or an overexpression promoter (PCYC1) in a weak Rsp5 mutant (rsp5G747E) background. IP, immunoprecipitation.
Figure S4.
Figure S4.
Degradation analysis of Ypq1 TM5 and TM7 Ala scanning mutants. Related to Fig. 3. (A–C) Heat map showing the degradation defect of all Ypq1 mutants. Mutants with at least 80% (*) or 90% (**) FR scores are highlighted. (D) Top: Degradation of Ypq1 TM5 Ala mutants before (0 h) or after (6 h) Lys starvation. WT and L218A are nonblocking controls. Bottom: Quantification (±SD, n = 2). (E) Top: Degradation of Ypq1 TM7 Ala mutants before (0 h) or after (6 h) Lys starvation. WT and F287A are nonblocking controls. Bottom: Quantification (±SD, n = 2).
Figure 3.
Figure 3.
Mutagenesis scanning confirms the importance of TM5 and TM7 in Ypq1 degradation. (A) Heat map showing the degradation defect of strong blocking Ypq1 mutants (cutoff = 90%). (B) Number of residues within TM5, TM7, and TM3 that conferred a strong degradation block when mutated to Ala. (C) Subcellular localization of Ypq1-GFP mutants after 6 h Lys starvation. WT, L218A, and F287A are positive degradation controls. Scale bar, 2 µm. (D) Helical wheel projections of Ypq1 TM5, TM7, and TM3 showing residues that blocked degradation when mutated to Ala (red).
Figure 4.
Figure 4.
The transmembrane helix of Ssh4 is important for Ypq1 degradation. (A) Conceptual model of competition assay. Full-length Ssh4 can interact with and ubiquitinate Ypq1, whereas Ssh4NT can only interact but not ubiquitinate. Ub, ubiquitin. (B) Left: Ypq1-GFP degradation kinetics after Ssh4NT overexpression. Right: Quantification (±SD, n = 3). Vec, empty vector. (C) Ypq1-GFP degradation conferred by Ssh4 TM Ala (A) or Trp (W) mutants based on Western blot. Red bar set at 50% as cutoff for strong blocking mutants. WT, L51A, and V69W are nonblockers (±SD, n = 3). Also see Fig. S4, D and E, for blots. (D) Degradation phenotype of Ypq1-GFP when Ssh4 TM residues were mutated to Ala (blue) or Trp (red), based on quantitative Western blots (n = 3). ─, normal degradation; +, partial block; ++, strong block; n/a, not mutated. (E) Heat map showing Ypq1-GFP degradation in the presence of Ssh4 mutants. Degradation-blocking mutants are noted as "Hits." Ssh4 mutants that had low expression levels or were lumenal are also noted. (F) Helical wheel of Ssh4 TM showing residues conferring a strong block when mutated to Ala or Trp. (G) Predicted structure of Ssh4 TM showing critical residues (red).
Figure S5.
Figure S5.
Expression and localization of Ssh4 mutants. Related to Fig. 4. (A) Subcellular localization of NeonGreen-3HA-tagged WT Ssh4 and Ssh4NT. Scale bar, 2 µm. (B) Ypq1-GFP degradation when combined with representative Ssh4 Ala (A) or Trp (W) mutants. Quantification shown in Fig. 4 C. (C) Protein levels of NeonGreen-3HA-tagged Ssh4 mutants. G6PDH, loading control; *, nonspecific band. (D) Subcellular localization of NeonGreen-3HA-tagged Ssh4 mutants. Scale bar, 2 µm.
Figure S6.
Figure S6.
The Ssh4 transmembrane domain is important in Wsc1*-GFP degradation. Related to Fig. 4. (A) Flow cytometry heat map showing the degradation defect on Wsc1-EQSPLL-GFP (hereafter, Wsc1*-GFP) imparted by Ssh4 transmembrane domain mutants (cutoff = 50%). Degradation-blocking mutants are noted as "Hits." Ssh4 mutants that had low expression (low exp) levels or were lumenal are also noted. (B) Left: Western blot showing degradation of Wsc1*-GFP in the presence of single-residue and double-residue Ssh4 mutants. Right: Quantification (±SD, n = 3). (C and D) Protein levels of NeonGreen-3HA-tagged single-residue and double-residue Ssh4 mutants. (E and F) Subcellular localization of NeonGreen-3HA-tagged single-residue and double-residue Ssh4 mutants. Scale bar, 2 µm. (G) Helical wheel showing the position of residues conferring partial degradation block when mutated to Trp. (H) Summary of Ssh4 TM residues that reduce/block Wsc1*-GFP or Ypq1-GFP degradation when mutated to Trp.
Figure 5.
Figure 5.
Charge complementation pairs support a transmembrane interaction between Ypq1 and Ssh4. (A) Conceptual model of charge complementation. (B) Flow cytometry–based quantification of Ypq1-GFP degradation within complementation pairs. EV, empty vector; OE, overexpression. (C) Top: Degradation of Ypq1-GFP within complementation pairs. Bottom: Quantification (±SD, n = 3). Vec, empty vector. (D) Subcellular localization of Ypq1-GFP coexpressed with Ssh4 mutants after 6 h Lys starvation. Scale bar, 2 µm. (E) Cell counts from D. No degradation (VM, vacuole membrane); complete degradation (vacuole lumen, VL); partial degradation (partial, VL + VM). n > 300 for each strain. (F) A model of the binding interface between Ypq1 TM5 and Ssh4 TM.
Figure 6.
Figure 6.
Ypq1 and Ssh4 transmembrane interaction is regulated by the PQ motif. (A) Architecture of prokaryotic SemiSWEET and eukaryotic SWEETs, which are the most well-studied members of the PQ-loop protein family. SemiSWEET protomers and SWEET THBs are colored in pink and green. (B) Cartoon showing key helices in SemiSWEET transitioning from the outward-open to occluded to inward-open conformations. TM1 and TM3 in the second protomer of the SemiSWEET transporter unit corresponds to TM5 and TM7, respectively, in Ypq1. Major helical movements are influenced by the PQ motif. (C) Left: The effect of PQ motif mutation on Ypq1-GFP complementation pairs. Right: Quantification (±SD, n = 3). OE, overexpression. PQmut, P229S,Q230R. (D) The effect of PQ motif mutation on Ypq1-GFP subcellular localization. Scale bar, 2 µm. (E) Predicted structure of Ypq1 modeled on three conformations of SemiSWEET. Membrane interfaces are shown in red and blue, as predicted by the Positioning of Membranes in Proteins server (https://opm.phar.umich.edu/ppm_server).
Figure 7.
Figure 7.
Model of transmembrane interaction between Ypq1 and Ssh4 after Lys starvation. (A) Lys starvation-mediated recognition of Ypq1 relies on Ypq1 TMs 5 and TM7 and Ssh4 TM. Transmembrane interaction occurs at a site that includes the identified critical residues. (B) Proposed model for Ypq1 recognition. When Lys is present, constant conformation cycling of Ypq1 prevents the stable exposure of its transmembrane recognition sites. Absence of Lys arrests Ypq1 in a conformation recognized by Ssh4 and leads to Ypq1 degradation.

Comment in

References

    1. Amick J., Tharkeshwar A.K., Talaia G., and Ferguson S.M.. 2020. PQLC2 recruits the C9orf72 complex to lysosomes in response to cationic amino acid starvation. J. Cell Biol. 219:e201906076 10.1083/jcb.201906076 - DOI - PMC - PubMed
    1. Bonifacino J.S., Cosson P., Shah N., and Klausner R.D.. 1991. Role of potentially charged transmembrane residues in targeting proteins for retention and degradation within the endoplasmic reticulum. EMBO J. 10:2783–2793. 10.1002/j.1460-2075.1991.tb07827.x - DOI - PMC - PubMed
    1. Bräuer P., Parker J.L., Gerondopoulos A., Zimmermann I., Seeger M.A., Barr F.A., and Newstead S.. 2019. Structural basis for pH-dependent retrieval of ER proteins from the Golgi by the KDEL receptor. Science. 363:1103–1107. 10.1126/science.aaw2859 - DOI - PMC - PubMed
    1. Brender J.R., and Zhang Y.. 2015. Predicting the Effect of Mutations on Protein-Protein Binding Interactions through Structure-Based Interface Profiles. PLOS Comput. Biol. 11:e1004494 10.1371/journal.pcbi.1004494 - DOI - PMC - PubMed
    1. Crapeau M., Merhi A., and André B.. 2014. Stress conditions promote yeast Gap1 permease ubiquitylation and down-regulation via the arrestin-like Bul and Aly proteins. J. Biol. Chem. 289:22103–22116. 10.1074/jbc.M114.582320 - DOI - PMC - PubMed

Publication types

MeSH terms

Substances