. 2021 Feb 8;6(3):e140644.
doi: 10.1172/jci.insight.140644.

Tregs facilitate obesity and insulin resistance via a Blimp-1/IL-10 axis

Affiliations

Tregs facilitate obesity and insulin resistance via a Blimp-1/IL-10 axis

Lisa Y Beppu et al. JCI Insight. .

Abstract

Interleukin-10 (IL-10) is a critical cytokine used by immune cells to suppress inflammation. Paradoxically, immune cell-derived IL-10 can drive insulin resistance in obesity by suppressing adipocyte energy expenditure and thermogenesis. However, the source of IL-10 necessary for the suppression of adipocyte thermogenesis is unknown. We show here that CD4+Foxp3+ regulatory T cells (Tregs) are a substantial source of IL-10 and that Treg-derived IL-10 can suppress adipocyte beiging. Unexpectedly, Treg-specific loss of IL-10 resulted in increased insulin sensitivity and reduced obesity in high-fat diet-fed male mice. Mechanistically, we determined that Treg-specific loss of the transcription factor Blimp-1, a driver of IL-10 expression by Tregs, phenocopied the Treg-specific IL-10-deficient mice. Loss of Blimp-1 expression in Tregs resulted in reduced ST2+KLRG1+, IL-10-secreting Tregs, particularly in the white adipose tissue. Blimp-1-deficient mice were protected from glucose intolerance, insulin resistance, and diet-induced obesity, through increased white adipose tissue browning. Taken together, our data show that Blimp-1-regulated IL-10 secretion by Tregs represses white adipose tissue beiging to maintain adipose tissue homeostasis.

Keywords: Adipose tissue; Cytokines; Endocrinology; Immunology; T cells.


Conflict of interest statement

Conflict of interest: The authors have declared that no conflict of interest exists.

Figures

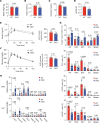
Figure 1
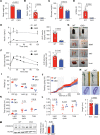
Figure 1. Loss of IL-10 expression by Tregs protects mice from DIO.
Male Foxp3-YFP-Cre+ (WT) and IL-10fl/fl mice crossed to Foxp3-YFP-Cre+ (conditional knockout, CKO) were placed on 60% HFD for 18–20 weeks prior to metabolic analysis. (A) Bar graph indicating body weight of 28-week-old HFD-fed WT and CKO mice. (B) Bar graph showing fasting plasma insulin levels in WT and CKO mice. (C) Bar graph showing fasting blood glucose levels in WT and CKO mice. (D) Bar graph showing the homeostatic model assessment of insulin resistance (HOMA-IR) in WT and CKO mice. (E and F) An i.p. glucose tolerance test (GTT) was performed on WT and CKO mice. The graphs indicate plasma insulin and blood glucose levels in mice over time after i.p. glucose injection. Bar graphs indicate the area under the curve (AUC) for both groups. (G) Gross appearance, inguinal WAT (iWAT), epididymal visceral WAT (VAT), and livers of 28-week-old HFD-fed WT and CKO mice. (H) Photographs and quantification of the colon length in WT and CKO mice after 18–20 weeks on HFD. Histology showing H&E staining of colon sections from the WT and CKO mice. (I) Graph showing body weight (BW) and lean and fat mass in grams of WT and CKO mice as measured by EchoMRI. (JL) Food intake in grams per kilogram lean mass (LM), total activity in meters, and respiratory exchange ratio (RER) in light, dark, and total as measured by Promethion Multiplexed Metabolic Cage System during 48-hour total duration. (M) Western blots showing PRDM16 expression in total iWAT from WT and CKO mice fed HFD for 18–20 weeks. Each lane represents 1 mouse. β-Actin loading control is shown. Data are presented as means ± SEM and are from 3 independent experiments with 3–8 mice per group, where each dot represents 1 mouse, and an unpaired 2-tailed Student’s t test or 1-way ANOVA was performed to determine significance. *P value of less than 0.05.
Figure 2
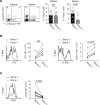
Figure 2. Blimp-1 expression in Tregs from the VAT and spleen.
Cells were isolated from the spleen or VAT of 15-week-old male mice expressing Blimp-1–YFP and Foxp3-RFP. (A) Flow cytometry plots and bar graphs indicating the frequency of CD4+ gated Blimp-1+ and Blimp-1Foxp3+ Tregs from the indicated tissues. Each dot represents 1 animal. (B) Histograms and graphs indicating ST2 and KLRG1 expression on gated CD4+Foxp3+ aTregs that were either Blimp-1+ (gray line) or Blimp-1 (black line). (C) Histograms and graphs indicating CD25 expression on gated CD4+Foxp3+ aTregs that were either Blimp-1+ (gray line) or Blimp-1 (black line). Data are presented as means ± SEM for n = 11 mice per group (A) or n = 6 mice per group (B and C), pooled from 4 independent experiments. A paired 2-tailed Student’s t test was performed to determine significance and the P values are indicated on the graphs (n.s., not significant).
Figure 3
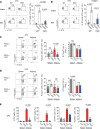
Figure 3. Loss of Blimp-1 expression in VAT Tregs decreases IL-10 secretion and Treg differentiation.
Male Foxp3-YFP-Cre+ (WT) and Blimp-1fl/fl mice crossed to Foxp3-YFP-Cre+ (CKO) were placed on SFD or 60% HFD at 8 weeks of age for 18–20 weeks prior to VAT Treg analysis. (A) Flow cytometry plots and bar graphs showing expression of IL-10 by gated CD4+Foxp3+ cells that were unstimulated (unstim) or stimulated (stim) for 5 hours with PMA and ionomycin from the VAT of SFD-fed WT and CKO mice. (B) Flow cytometry plots and bar graphs showing expression of IL-10 by gated CD4+Foxp3+ cells that were unstimulated (unstim) or stimulated (stim) for 5 hours with PMA and ionomycin from the VAT of HFD-fed WT and CKO mice. (C) Flow cytometry plots and bar graphs showing the frequency and number of CD4+Foxp3+ cells in the indicated tissue from SFD-fed WT and CKO mice. (D) Flow cytometry plots and bar graphs showing the frequency and number of CD4+Foxp3+ cells in the indicated tissue from HFD-fed WT and CKO mice. (E) Bar graphs showing expression of ST2, CCR2, GITR, and KLRG1 on gated CD4+Foxp3+ cells in the indicated tissue from WT and CKO mice on SFD. Each dot represents 1 animal. Data are presented as means ± SEM and are from 2–3 independent experiments with 4–14 mice. An unpaired 2-tailed Student’s t test or 1-way ANOVA was performed to determine significance, and the P values are indicated on the graphs (n.s., not significant).
Figure 4
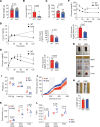
Figure 4. Loss of Blimp-1 expression by Tregs decreases fat mass and increases insulin sensitivity.
Male Foxp3-YFP-Cre+ (WT) and Blimp-1fl/fl mice crossed to Foxp3-YFP-Cre+ (CKO) were placed on SFD and analyzed at 26–28 weeks of age. (A) Bar graphs indicating BW of 26- to 28-week-old SFD-fed WT and CKO mice. (B) Bar graph showing fasting plasma insulin levels in SFD-fed WT and CKO mice. (C) Bar graph showing fasting blood glucose levels in SFD-fed WT and CKO mice. (D and E) An i.p. GTT was performed on WT and CKO mice. The graphs indicate plasma insulin and blood glucose levels in mice over time after glucose injection. Bar graphs indicate the AUC for both groups. (F) An i.p. ITT was performed on WT and CKO mice. The graph indicates blood glucose levels in mice over time after i.p. insulin injection. Bar graph indicates the AUC for both groups. (G) Gross appearance, iWAT, epididymal VAT, and livers of SFD-fed WT and CKO mice. (H) Photographs and quantification of the colon length in WT and CKO mice. (I) Graph showing BW and lean and fat mass in grams of WT and CKO mice as measured by EchoMRI. (JL) Food intake in grams per kilogram LM, total activity in meters, and RER in light, dark, and total as measured by Promethion Multiplexed Metabolic Cage System during 48-hour total duration. Data are presented as means ± SEM and are from 2–3 independent experiments with 3–29 mice, where each dot represents 1 mouse, and an unpaired 2-tailed Student’s t test or 1-way ANOVA was performed to determine significance. *P value of less than 0.05.
Figure 5
Figure 5. Loss of Blimp-1 expression by Tregs increases adipocyte beiging in WAT.
Male Foxp3-YFP-Cre+ (WT) and Blimp-1fl/fl mice crossed to Foxp3-YFP-Cre+ (CKO) were placed on SFD and analyzed at 26–28 weeks of age. (A) Bar graphs showing relative mRNA expression of the indicated gene from total iWAT, VAT, and BAT from 26- to 28-week-old SFD-fed WT and CKO mice. Values were normalized to β-actin. (B) Western blots and bar graphs showing UCP1 and PRDM16 expression from total iWAT from SFD-fed WT and CKO mice. Each lane represents 1 biological replicate. β-Actin loading control is shown. (C) Graph showing Ucp1 mRNA expression from in vitro differentiated beige adipocyte cell lines and treated with IL-10 for 48 hours. Each dot represents a technical replicate and is representative of 2 independent experiments. (D) Graph indicating energy expenditure (EE) in kcal per hour by WT and CKO mice on SFD. (E) Bar graph indicating rectal temperature in WT and CKO mice. Data from A, D, and E are presented as means ± SEM and are from 2–3 independent experiments with 3–16 mice, where each dot represents 1 mouse and an unpaired 2-tailed Student’s t test or 1-way ANOVA was performed to determine significance.
Figure 6
Figure 6. Blimp-1 deficiency on short-term HFD is protective and increases beige gene expression in adipocytes.
Eight-week-old male Foxp3-YFP-Cre+ (WT) and Blimp-1fl/fl mice crossed to Foxp3-YFP-Cre+ (CKO) were placed on 60% HFD for 3 weeks prior to metabolic analysis. (A) Bar graphs indicating body weight of 11-week-old HFD-fed WT and CKO mice. (B) Bar graph showing fasting plasma insulin levels in WT and CKO mice. (C) Bar graph showing fasting blood glucose levels in WT and CKO mice. (D) Bar showing the HOMA-IR in WT and CKO mice. (E and F) An i.p. GTT was performed on WT and CKO mice. The graphs indicate plasma insulin and blood glucose levels in mice over time after glucose injection. Bar graphs indicate the AUC for both groups. (G) Bar graphs indicating the percentage of CD4+Foxp3+ cells in the VAT, iWAT, BAT, inguinal lymph nodes (iLNs), and spleen from short-term HFD-fed WT and CKO mice. Bar graphs also showing expression of ST2, CCR2, and KLRG1 on gated CD4+Foxp3+ cells in the indicated tissue from WT and CKO mice. (H) Bar graph showing relative mRNA expression of the indicated gene from total iWAT and VAT from short-term HFD-fed WT and CKO mice. Values were normalized to β-actin. Each dot represents 1 animal. Data are presented as means ± SEM and are representative of 2 experiments with 2–3 mice per group. An unpaired 2-tailed Student’s t test or 1-way ANOVA was performed to determine significance, and the P values are indicated on the graphs.
Figure 7
Figure 7. Loss of Blimp-1 expression by Tregs protects mice from DIO.
Eight-week-old male Foxp3-YFP-Cre+ (WT) and Blimp-1fl/fl mice crossed to Foxp3-YFP-Cre+ (CKO) were placed on 60% HFD for 18–20 weeks prior to metabolic analysis. (A) Bar graphs indicating body weight of 26- to 28-week-old HFD-fed WT and CKO mice. (B) Bar graph showing fasting plasma insulin levels in WT and CKO mice. (C) Bar graph showing fasting blood glucose levels in WT and CKO mice. (D) Bar graph showing the HOMA-IR in WT and CKO mice. (E and F) An i.p. GTT was performed on WT and CKO mice. The graphs indicate plasma insulin and blood glucose levels in mice over time after glucose injection. Bar graphs indicate the AUC for both groups. (G) Gross appearance, iWAT, epididymal VAT, and livers of 28-week-old HFD-fed WT and CKO mice. (H) Photographs and quantification of the colon length in 28-week-old WT and CKO mice after HFD. H&E staining showing cross section of the colon from WT and CKO mice. (I) Graph showing BW and lean and fat mass in grams of WT and CKO mice as measured by EchoMRI. (JL) Food intake in grams per kilogram LM, total activity in meters, and RER in light, dark, and total as measured by Promethion Multiplexed Metabolic Cage System during 48-hour total duration. (M) Western blots and bar graph showing UCP1 expression from total iWAT from 26- to 28-week-old HFD-fed WT and CKO mice. Each lane represents 1 biological replicate. β-Actin loading control is shown. All data are presented as means ± SEM and are from 2–3 independent experiments with 3–12 mice, where each dot represents 1 mouse, and an unpaired 2-tailed Student’s t test or 1-way ANOVA was performed to determine significance. *P value of less than 0.05.

References

    1. Chouchani ET, et al. New advances in adaptive thermogenesis: UCP1 and beyond. Cell Metab. 2019;29(1):27–37. doi: 10.1016/j.cmet.2018.11.002. - DOI - PubMed
    1. Puigserver P, et al. A cold-inducible coactivator of nuclear receptors linked to adaptive thermogenesis. Cell. 1998;92(6):829–839. doi: 10.1016/S0092-8674(00)81410-5. - DOI - PubMed
    1. Wang W, Seale P. Control of brown and beige fat development. Nat Rev Mol Cell Biol. 2016;17(11):691–702. - PMC - PubMed
    1. Villarroya F, et al. Toward an understanding of how immune cells control brown and beige adipobiology. Cell Metab. 2018;27(5):954–961. - PubMed
    1. Lee MW, et al. Activated type 2 innate lymphoid cells regulate beige fat biogenesis. Cell. 2015;160(1-2):74–87. - PMC - PubMed

Publication types

MeSH terms

Substances