. 2020 Dec 22;16(12):e1008498.
doi: 10.1371/journal.pcbi.1008498. eCollection 2020 Dec.

CHOmics: A web-based tool for multi-omics data analysis and interactive visualization in CHO cell lines

Affiliations

CHOmics: A web-based tool for multi-omics data analysis and interactive visualization in CHO cell lines

Dongdong Lin et al. PLoS Comput Biol. .

Abstract

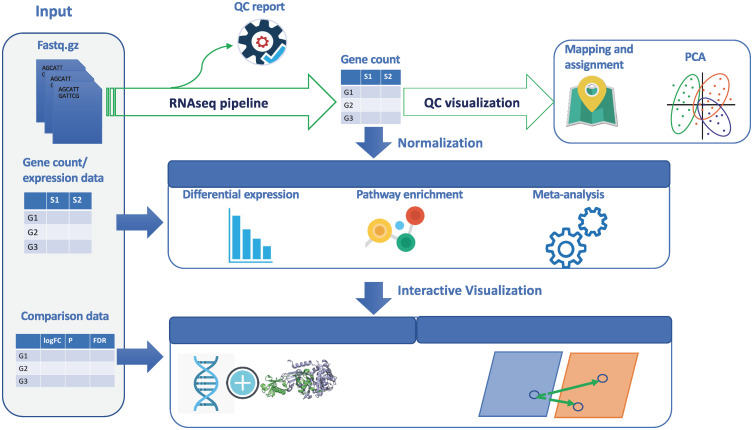
Chinese hamster ovary (CHO) cell lines are widely used in industry for biological drug production. During cell culture development, considerable effort is invested to understand the factors that greatly impact cell growth, specific productivity and product qualities of the biotherapeutics. While high-throughput omics approaches have been increasingly utilized to reveal cellular mechanisms associated with cell line phenotypes and guide process optimization, comprehensive omics data analysis and management have been a challenge. Here we developed CHOmics, a web-based tool for integrative analysis of CHO cell line omics data that provides an interactive visualization of omics analysis outputs and efficient data management. CHOmics has a built-in comprehensive pipeline for RNA sequencing data processing and multi-layer statistical modules to explore relevant genes or pathways. Moreover, advanced functionalities were provided to enable users to customize their analysis and visualize the output systematically and interactively. The tool was also designed with the flexibility to accommodate other types of omics data and thereby enabling multi-omics comparison and visualization at both gene and pathway levels. Collectively, CHOmics is an integrative platform for data analysis, visualization and management with expectations to promote the broader use of omics in CHO cell research.


Conflict of interest statement

The authors have declared that no competing interests exist.

Figures

Fig 1
Fig 1. The schematic view of CHOmics platform.
Different modules in the platform are shown encapsulating different functionalities like data input, data analysis using RNA-Seq pipeline, statistical analysis, and visualization.
Fig 2
Fig 2. Visualization of raw data processing output.
Gene mapping and expression distribution plots are shown (A) to check the sequencing reads processing quality and distribution. The samples can be (B) clustered based on their expression profiling or (C) subjected to principle component analysis to visualize expressional similarity among samples.
Fig 3
Fig 3. The outputs from differential gene expression and pathway enrichment analysis.
(A) Differential expression analysis identified DEGs from the comparison between group D108 and D72 and are plotted in (B) heatmap and (C) volcano chart. (D) Pathway enrichment analysis showed the top 10 significant pathways from multiple databases enriched by DEGs.
Fig 4
Fig 4. The visualization of gene expression.
(A) Box plot of a gene or (B) Heatmap of a list of genes from different conditions and omics. (C) DEGs of interest can be visualized across comparisons and omics in a bubble plot.
Fig 5
Fig 5. Visualization of pathway enrichment across omics and comparisons.
By selecting comparisons, CHOmics can plot (A) heatmap for pathway enrichment across comparisons and (B) pathway diagram to show gene expression pattern from a specific pathway when involving multiple comparisons where the two colors in each node represent RNA and protein changes, respectively.

References

    1. Stolfa G, Smonskey MT, Boniface R, Hachmann A-B, Gulde P, Joshi AD, et al. CHO-Omics Review: The Impact of Current and Emerging Technologies on Chinese Hamster Ovary Based Bioproduction. Biotechnol J, 2018. 13(3): p. e1700227 10.1002/biot.201700227 - DOI - PubMed
    1. Clarke C, Gallagher C, Kelly RM, Henry M, Meleady P, Frye CC, et al. Transcriptomic analysis of IgG4 Fc-fusion protein degradation in a panel of clonally-derived CHO cell lines using RNASeq. Biotechnology and bioengineering, 2019. 116(6): p. 1556–1562. 10.1002/bit.26958 - DOI - PubMed
    1. Lewis AM, Croughan WD, Aranibar N, Lee AG, Warrack B, Abu-Absi NR, et al. Understanding and Controlling Sialylation in a CHO Fc-Fusion Process. PLoS One, 2016. 11(6): p. e0157111 10.1371/journal.pone.0157111 - DOI - PMC - PubMed
    1. Baik JY, Lee MS, An SR, Yoon SK, Joo EJ, Kim YH, et al. Initial transcriptome and proteome analyses of low culture temperature-induced expression in CHO cells producing erythropoietin. Biotechnol Bioeng, 2006. 93(2): p. 361–71. 10.1002/bit.20717 - DOI - PubMed
    1. Bedoya-López A, Estrada K, Sanchez-Flores A, Ramírez OT, Altamirano C, Segovia L, et al. Effect of temperature downshift on the transcriptomic responses of Chinese hamster ovary cells using recombinant human tissue plasminogen activator production culture. PloS one, 2016. 11(3). 10.1371/journal.pone.0151529 - DOI - PMC - PubMed

Publication types

Substances