

Public policy and economic dynamics of COVID-19 spread: A mathematical modeling study
- PMID: 33351835
- PMCID: PMC7755180
- DOI: 10.1371/journal.pone.0244174
Public policy and economic dynamics of COVID-19 spread: A mathematical modeling study
Abstract
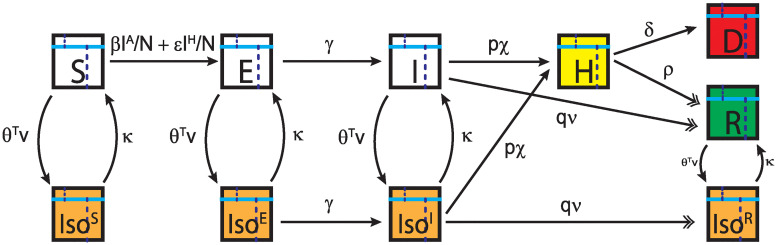
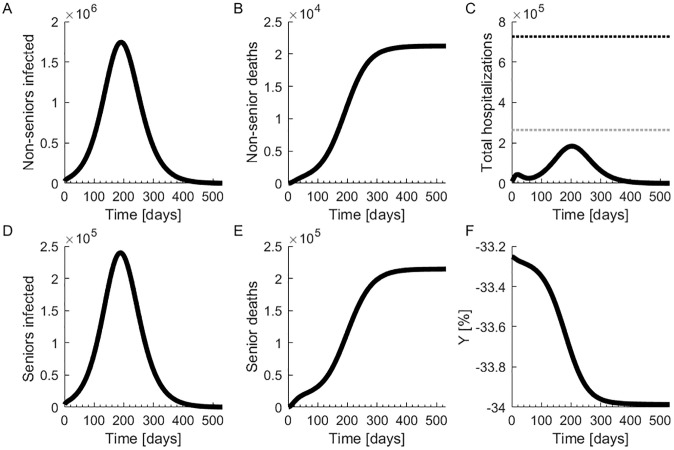
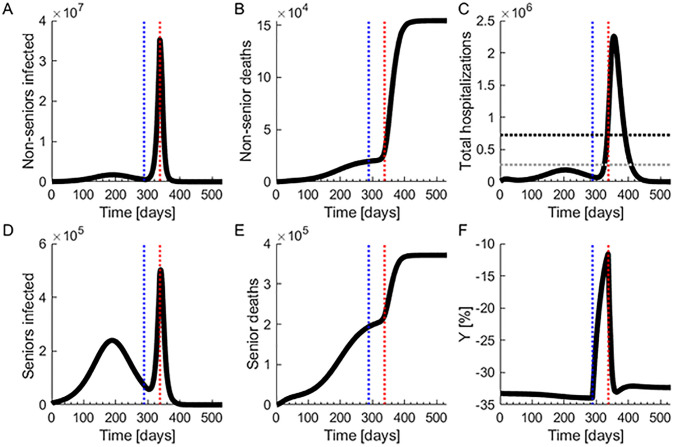
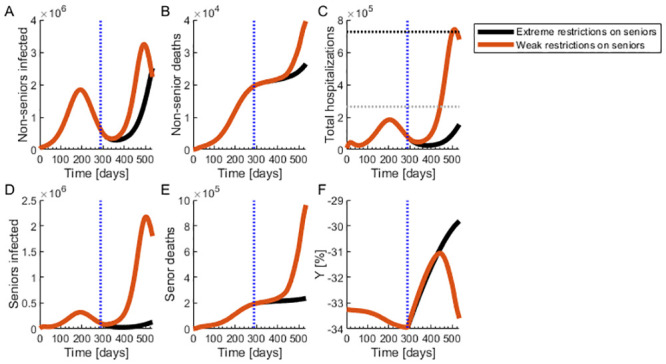
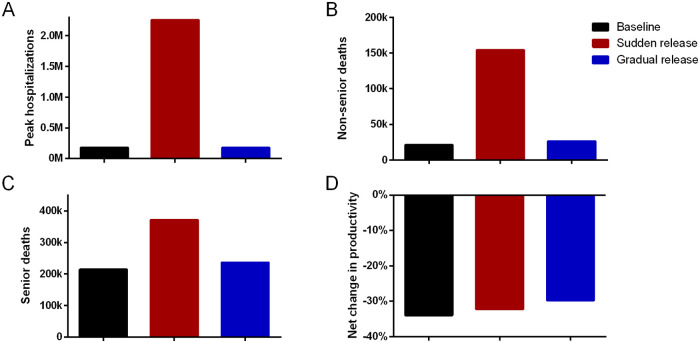
With the COVID-19 pandemic infecting millions of people, large-scale isolation policies have been enacted across the globe. To assess the impact of isolation measures on deaths, hospitalizations, and economic output, we create a mathematical model to simulate the spread of COVID-19, incorporating effects of restrictive measures and segmenting the population based on health risk and economic vulnerability. Policymakers make isolation policy decisions based on current levels of disease spread and economic damage. For 76 weeks in a population of 330 million, we simulate a baseline scenario leaving strong isolation restrictions in place, rapidly reducing isolation restrictions for non-seniors shortly after outbreak containment, and gradually relaxing isolation restrictions for non-seniors. We use 76 weeks as an approximation of the time at which a vaccine will be available. In the baseline scenario, there are 235,724 deaths and the economy shrinks by 34.0%. With a rapid relaxation, a second outbreak takes place, with 525,558 deaths, and the economy shrinks by 32.3%. With a gradual relaxation, there are 262,917 deaths, and the economy shrinks by 29.8%. We also show that hospitalizations, deaths, and economic output are quite sensitive to disease spread by asymptomatic people. Strict restrictions on seniors with very gradual lifting of isolation for non-seniors results in a limited number of deaths and lesser economic damage. Therefore, we recommend this strategy and measures that reduce non-isolated disease spread to control the pandemic while making isolation economically viable.
Conflict of interest statement
The authors have declared that no competing interests exist.
Figures

Similar articles
-
The 5% of the Population at High Risk for Severe COVID-19 Infection Is Identifiable and Needs to Be Taken Into Account When Reopening the Economy.J Psychiatr Pract. 2020 May;26(3):219-227. doi: 10.1097/PRA.0000000000000475. J Psychiatr Pract. 2020. PMID: 32421292 Free PMC article.
-
The unique features of SARS-CoV-2 transmission: Comparison with SARS-CoV, MERS-CoV and 2009 H1N1 pandemic influenza virus.Rev Med Virol. 2021 Mar;31(2):e2171. doi: 10.1002/rmv.2171. Epub 2020 Sep 18. Rev Med Virol. 2021. PMID: 33350025 Free PMC article. Review.
-
First Wave of COVID-19 Pandemic in Italy: Data and Evidence.Adv Exp Med Biol. 2021;1353:91-113. doi: 10.1007/978-3-030-85113-2_6. Adv Exp Med Biol. 2021. PMID: 35137370
-
Social Restrictions versus Testing Campaigns in the COVID-19 Crisis: A Predictive Model Based on the Spanish Case.Viruses. 2021 May 15;13(5):917. doi: 10.3390/v13050917. Viruses. 2021. PMID: 34063465 Free PMC article.
-
Comparing SARS-CoV-2 with SARS-CoV and influenza pandemics.Lancet Infect Dis. 2020 Sep;20(9):e238-e244. doi: 10.1016/S1473-3099(20)30484-9. Epub 2020 Jul 3. Lancet Infect Dis. 2020. PMID: 32628905 Free PMC article. Review.
Cited by
-
Seroprevalence of SARS-CoV-2 Infection among Occupational Groups from the Bucaramanga Metropolitan Area, Colombia.Int J Environ Res Public Health. 2021 Apr 15;18(8):4172. doi: 10.3390/ijerph18084172. Int J Environ Res Public Health. 2021. PMID: 33920843 Free PMC article.
-
On Pandemic Preparedness: How Well is the Modeling Community Prepared for COVID-19?Pharmacoeconomics. 2020 Nov;38(11):1149-1151. doi: 10.1007/s40273-020-00959-7. Pharmacoeconomics. 2020. PMID: 32924091 Free PMC article. No abstract available.
-
Methods in quantitative biology-from analysis of single-cell microscopy images to inference of predictive models for stochastic gene expression.Phys Biol. 2025 Jun 10;22(4):042001. doi: 10.1088/1478-3975/adda85. Phys Biol. 2025. PMID: 40388970 Free PMC article. Review.
-
A discrete model for the evaluation of public policies: The case of Colombia during the COVID-19 pandemic.PLoS One. 2023 Feb 14;18(2):e0275546. doi: 10.1371/journal.pone.0275546. eCollection 2023. PLoS One. 2023. PMID: 36787303 Free PMC article.
-
COVID-19 dynamics in Madrid (Spain): A new convolutional model to find out the missing information during the first three waves.PLoS One. 2022 Dec 22;17(12):e0279080. doi: 10.1371/journal.pone.0279080. eCollection 2022. PLoS One. 2022. PMID: 36548226 Free PMC article.
References
-
- Jamieson-Lane AD, Cytrnbaum E. The Effectiveness of Targeted Quarantine for Minimising Impact of COVID-19. medRxiv. 2020;.
MeSH terms
LinkOut - more resources
Full Text Sources
Medical
